Azure Module
editAzure Module
editThis functionality is in technical preview and may be changed or removed in a future release. Elastic will work to fix any issues, but features in technical preview are not subject to the support SLA of official GA features.
The Microsoft Azure module in Logstash helps you easily integrate your Azure activity logs and SQL diagnostic logs with the Elastic Stack.
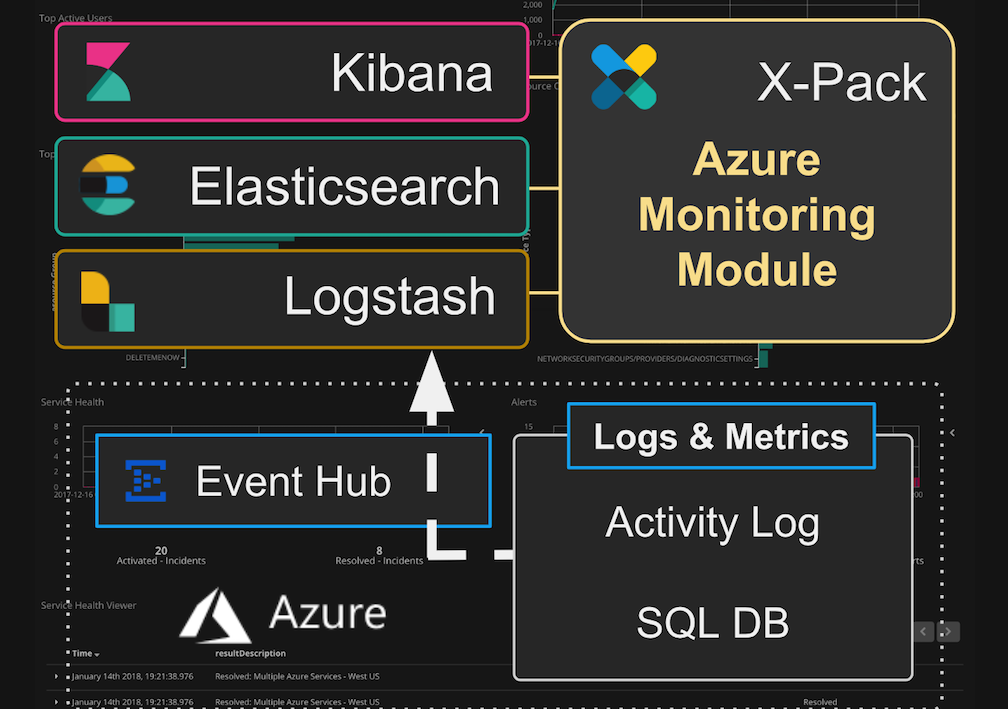
You can monitor your Azure cloud environments and SQL DB deployments with deep operational insights across multiple Azure subscriptions. You can explore the health of your infrastructure in real-time, accelerating root cause analysis and decreasing overall time to resolution. The Azure module helps you:
- Analyze infrastructure changes and authorization activity
- Identify suspicious behaviors and potential malicious actors
- Perform root-cause analysis by investigating user activity
- Monitor and optimize your SQL DB deployments.
The Logstash Azure module is an X-Pack feature under the Basic License and is therefore free to use. Please contact monitor-azure@elastic.co for questions or more information.
The Azure module uses the Logstash Azure Event Hubs input plugin to consume data from Azure Event Hubs. The module taps directly into the Azure dashboard, parses and indexes events into Elasticsearch, and installs a suite of Kibana dashboards to help you start exploring your data immediately.
Dashboards
editThese Kibana dashboards are available and ready for you to use. You can use them as they are, or tailor them to meet your needs.
Infrastructure activity monitoring
edit- Overview. Top-level view into your Azure operations, including info about users, resource groups, service health, access, activities, and alerts.
- Alerts. Alert info, including activity, alert status, and alerts heatmap
- User Activity. Info about system users, their activity, and requests.
SQL Database monitoring
edit- SQL DB Overview. Top-level view into your SQL Databases, including counts for databases, servers, resource groups, and subscriptions.
- SQL DB Database View. Detailed info about each SQL Database, including wait time, errors, DTU and storage utilization, size, and read and write input/output.
- SQL DB Queries. Info about SQL Database queries and performance.
Prerequisites
editAzure Monitor enabled with Azure Event Hubs and the Elastic Stack are required for this module.
Elastic prerequisites
editThe instructions below assume that you have Logstash, Elasticsearch, and Kibana running locally. You can also run Logstash, Elasticsearch, and Kibana on separate hosts.
The Elastic Stack version 6.4 (or later) is required for this module.
The Azure module uses the azure_event_hubs input plugin to consume logs and
metrics from your Azure environment. It is installed by default with Logstash 6.4
(or later). Basic understanding of the plugin and options is helpful when you
set up the Azure module.
See the azure_event_hubs input
plugin documentation for more information.
Elastic products are available to download and easy to install.
Azure prerequisites
editAzure Monitor should be configured to stream logs to one or more Event Hubs. Logstash will need to access these Event Hubs instances to consume your Azure logs and metrics. See Microsoft Azure resources at the end of this topic for links to Microsoft Azure documentation.
Configure the module
editSpecify options for the Logstash Azure module in the
logstash.yml configuration file.
-
Basic configuration. You can use the
logstash.ymlfile to configure inputs from multiple Event Hubs that share the same configuration. Basic configuration is recommended for most use cases. -
Advanced configuration. The advanced configuration is available for deployments where different Event Hubs
require different configurations. The
logstash.ymlfile holds your settings. Advanced configuration is not necessary or recommended for most use cases.
See the azure_event_hubs input plugin documentation for more information about basic and advanced configuration models.
Basic configuration sample
editThe configuration in the logstash.yml file is shared between Event Hubs.
Basic configuration is recommended for most use cases
modules:
  - name: azure
    var.elasticsearch.hosts: localhost:9200
    var.kibana.host: localhost:5601
    var.input.azure_event_hubs.consumer_group: "logstash"
    var.input.azure_event_hubs.storage_connection: "DefaultEndpointsProtocol=https;AccountName=instance1..."
    var.input.azure_event_hubs.threads: 9
    var.input.azure_event_hubs.event_hub_connections:
      - "Endpoint=sb://...EntityPath=insights-operational-logs"
      - "Endpoint=sb://...EntityPath=insights-metrics-pt1m"
      - "Endpoint=sb://...EntityPath=insights-logs-blocks"
      - "Endpoint=sb://...EntityPath=insights-logs-databasewaitstatistics"
      - "Endpoint=sb://...EntityPath=insights-logs-errors"
      - "Endpoint=sb://...EntityPath=insights-logs-querystoreruntimestatistics"
      - "Endpoint=sb://...EntityPath=insights-logs-querystorewaitstatistics"
      - "Endpoint=sb://...EntityPath=insights-logs-timeouts"
|
The |
|
|
The |
|
|
See Best practices for guidelines on choosing an appropriate number of threads. |
|
|
This connection sets up the consumption of Activity Logs. By default, Azure Monitor uses the |
|
|
This connection and the ones below set up the consumption of SQL DB diagnostic logs and metrics. By default, Azure Monitor uses all these different Event Hub names. |
The basic configuration requires the var.input.azure_event_hubs. prefix
before a configuration option.
Notice the notation for the threads option.
Advanced configuration sample
editAdvanced configuration in the logstash.yml file supports Event Hub specific
options. Advanced configuration is available for more granular tuning of
threading and Blob Storage usage across multiple Event Hubs. Advanced
configuration is not necessary or recommended for most use cases. Use it only if
it is required for your deployment scenario.
You must define the header array with name in the first position. You can
define other options in any order. The per Event Hub configuration takes
precedence. Any values not defined per Event Hub use the global config value.
In this example threads, consumer_group, and storage_connection will be
applied to each of the configured Event Hubs. Note that decorate_events is
defined in both the global and per Event Hub configuration. The per Event Hub
configuration takes precedence, and the global configuration is effectively
ignored when the per Event Hub setting is present.
modules:
  - name: azure
    var.elasticsearch.hosts: localhost:9200
    var.kibana.host: localhost:5601
    var.input.azure_event_hubs.decorate_events: true
    var.input.azure_event_hubs.threads: 9
    var.input.azure_event_hubs.consumer_group: "logstash"
    var.input.azure_event_hubs.storage_connection: "DefaultEndpointsProtocol=https;AccountName=instance1..."
    var.input.azure_event_hubs.event_hubs:
      - ["name",                                    "initial_position",  "storage_container",  "decorate_events",  "event_hub_connection"]
      - ["insights-operational-logs",                 "TAIL",              "activity-logs1",    "true",             "Endpoint=sb://...EntityPath=insights-operational-logs"]
      - ["insights-operational-logs",                 "TAIL",              "activity_logs2",  "true",             "Endpoint=sb://...EntityPath=insights-operational-logs"]
      - ["insights-metrics-pt1m",                     "TAIL",              "dbmetrics",         "true",             "Endpoint=sb://...EntityPath=insights-metrics-pt1m"]
      - ["insights-logs-blocks",                      "TAIL",              "dbblocks",          "true",             "Endpoint=sb://...EntityPath=insights-logs-blocks"]
      - ["insights-logs-databasewaitstatistics",      "TAIL",              "dbwaitstats",       "false",            "Endpoint=sb://...EntityPath=insights-logs-databasewaitstatistics"]
      - ["insights-logs-errors",                      "HEAD",              "dberrors",          "true",             "Endpoint=sb://...EntityPath=insights-logs-errors"
      - ["insights-logs-querystoreruntimestatistics", "TAIL",              "dbstoreruntime",    "true",             "Endpoint=sb://...EntityPath=insights-logs-querystoreruntimestatistics"]
      - ["insights-logs-querystorewaitstatistics",    "TAIL",              "dbstorewaitstats",  "true",             "Endpoint=sb://...EntityPath=insights-logs-querystorewaitstatistics"]
      - ["insights-logs-timeouts",                    "TAIL",              "dbtimeouts",        "true",             "Endpoint=sb://...EntityPath=insights-logs-timeouts"]
|
You can specify global Event Hub options. They will be overridden by any configurations specified in the event_hubs option. |
|
|
See Best practices for guidelines on choosing an appropriate number of threads. |
|
|
The header array must be defined with name in the first position. Other options can be defined in any order. The per Event Hub configuration takes precedence. Any values not defined per Event Hub use the global config value. |
|
|
This enables consuming from a second Activity Logs Event Hub that uses a different Blob Storage container. This is necessary to avoid the offsets from the first insights-operational-logs from overwriting the offsets for the second insights-operational-logs. |
The advanced configuration doesn’t require a prefix before a per Event Hub
configuration option. Notice the notation for the initial_position option.
Scale Event Hub consumption
editAn Azure Blob Storage account is an essential part of Azure-to-Logstash configuration. It is required for users who want to scale out multiple Logstash instances to consume from Event Hubs.
A Blob Storage account is a central location that enables multiple instances of Logstash to work together to process events. It records the offset (location) of processed events. On restart, Logstash resumes processing exactly where it left off.
Configuration notes:
- A Blob Storage account is highly recommended for use with this module, and is likely required for production servers.
-
The
storage_connectionoption passes the blob storage connection string. -
Configure all Logstash instances to use the same
storage_connectionto get the benefits of shared processing.
Sample Blob Storage connection string:
DefaultEndpointsProtocol=https;AccountName=logstash;AccountKey=ETOPnkd/hDAWidkEpPZDiXffQPku/SZdXhPSLnfqdRTalssdEuPkZwIcouzXjCLb/xPZjzhmHfwRCGo0SBSw==;EndpointSuffix=core.windows.net
Find the connection string to Blob Storage here:
Azure Portal-> Blob Storage account -> Access keys.
Best practices
editHere are some guidelines to help you achieve a successful deployment, and avoid data conflicts that can cause lost events.
- Create a Logstash consumer group. Create a new consumer group specifically for Logstash. Do not use the $default or any other consumer group that might already be in use. Reusing consumer groups among non-related consumers can cause unexpected behavior and possibly lost events. All Logstash instances should use the same consumer group so that they can work together for processing events.
-
Avoid overwriting offset with multiple Event Hubs. The offsets (position) of the Event Hubs are stored in the configured Azure Blob store. The Azure Blob store uses paths like a file system to store the offsets. If the paths between multiple Event Hubs overlap, then the offsets may be stored incorrectly. To avoid duplicate file paths, use the advanced configuration model and make sure that at least one of these options is different per Event Hub:
- storage_connection
- storage_container (defaults to Event Hub name if not defined)
- consumer_group
-
Set number of threads correctly. The number of threads should equal the number of Event Hubs plus one (or more). Each Event Hub needs at least one thread. An additional thread is needed to help coordinate the other threads. The number of threads should not exceed the number of Event Hubs multiplied by the number of partitions per Event Hub plus one. Threads are currently available only as a global setting.
- Sample: Event Hubs = 4. Partitions on each Event Hub = 3. Minimum threads is 5 (4 Event Hubs plus one). Maximum threads is 13 (4 Event Hubs times 3 partitions plus one).
- If you’re collecting activity logs from only one specified event hub instance, then only 2 threads (1 Event Hub plus one) are required.
Set up and run the module
editBe sure that the logstash.yml file is configured correctly.
First time setup
editRun this command from the Logstash directory:
bin/logstash --setup
The --modules azure option starts a Logstash pipeline for ingestion from Azure
Event Hubs. The --setup option creates an azure-* index pattern in
Elasticsearch and imports Kibana dashboards and visualizations.
Subsequent starts
editRun this command from the Logstash directory:
bin/logstash
The --setup option is intended only for first-time setup. If you include
--setup on subsequent runs, your existing Kibana dashboards will be
overwritten.
Explore your data
editWhen the Logstash Azure module starts receiving events, you can begin using the packaged Kibana dashboards to explore and visualize your data.
To explore your data with Kibana:
- Open a browser to http://localhost:5601 (username: "elastic"; password: "YOUR_PASSWORD")
- Click Dashboard.
- Click [Azure Monitor] Overview.
Configuration options
editAll Event Hubs options are common to both basic and advanced
configurations, with the following exceptions. The basic configuration uses
event_hub_connections to support multiple connections. The advanced
configuration uses event_hubs and event_hub_connection (singular).
event_hubs
edit- Value type is array
- No default value
- Ignored for basic and command line configuration
- Required for advanced configuration
Defines the per Event Hubs configuration for the advanced configuration.
The advanced configuration uses event_hub_connection instead of event_hub_connections.
The event_hub_connection option is defined per Event Hub.
event_hub_connections
edit- Value type is array
- No default value
- Required for basic and command line configuration
- Ignored for advanced configuration
List of connection strings that identifies the Event Hubs to be read. Connection strings include the EntityPath for the Event Hub.
checkpoint_interval
edit- Value type is number
-
Default value is
5seconds -
Set to
0to disable.
Interval in seconds to write checkpoints during batch processing. Checkpoints tell Logstash where to resume processing after a restart. Checkpoints are automatically written at the end of each batch, regardless of this setting.
Writing checkpoints too frequently can slow down processing unnecessarily.
consumer_group
edit- Value type is string
-
Default value is
$Default
Consumer group used to read the Event Hub(s). Create a consumer group specifically for Logstash. Then ensure that all instances of Logstash use that consumer group so that they can work together properly.
decorate_events
edit- Value type is boolean
-
Default value is
false
Adds metadata about the Event Hub, including Event Hub name, consumer_group,
processor_host, partition, offset, sequence, timestamp, and event_size.
initial_position
edit- Value type is string
-
Valid arguments are
beginning,end,look_back -
Default value is
beginning
When first reading from an Event Hub, start from this position:
-
beginningreads all pre-existing events in the Event Hub -
enddoes not read any pre-existing events in the Event Hub -
look_backreadsendminus a number of seconds worth of pre-existing events. You control the number of seconds using theinitial_position_look_backoption.
If storage_connection is set, the initial_position value is used only
the first time Logstash reads from the Event Hub.
initial_position_look_back
edit- Value type is number
-
Default value is
86400 -
Used only if
initial_positionis set tolook-back
Number of seconds to look back to find the initial position for pre-existing
events. This option is used only if initial_position is set to look_back. If
storage_connection is set, this configuration applies only the first time Logstash
reads from the Event Hub.
max_batch_size
edit- Value type is number
-
Default value is
125
Maximum number of events retrieved and processed together. A checkpoint is created after each batch. Increasing this value may help with performance, but requires more memory.
storage_connection
edit- Value type is string
- No default value
Connection string for blob account storage. Blob account storage persists the
offsets between restarts, and ensures that multiple instances of Logstash
process different partitions.
When this value is set, restarts resume where processing left off.
When this value is not set, the initial_position value is used on every restart.
We strongly recommend that you define this value for production environments.
storage_container
edit- Value type is string
- Defaults to the Event Hub name if not defined
Name of the storage container used to persist offsets and allow multiple instances of Logstash to work together.
To avoid overwriting offsets, you can use different storage containers. This is particularly important if you are monitoring two Event Hubs with the same name. You can use the advanced configuration model to configure different storage containers.
threads
edit- Value type is number
-
Minimum value is
2 -
Default value is
4
Total number of threads used to process events. The value you set here applies to all Event Hubs. Even with advanced configuration, this value is a global setting, and can’t be set per event hub.
The number of threads should be the number of Event Hubs plus one or more. See Best practices for more information.
Common options
The following configuration options are supported by all modules:
-
var.elasticsearch.hosts -
- Value type is uri
- Default value is "localhost:9200"
Sets the host(s) of the Elasticsearch cluster. For each host, you must specify the hostname and port. For example, "myhost:9200". If given an array, Logstash will load balance requests across the hosts specified in the hosts parameter. It is important to exclude dedicated master nodes from the hosts list to prevent Logstash from sending bulk requests to the master nodes. So this parameter should only reference either data or client nodes in Elasticsearch.
Any special characters present in the URLs here MUST be URL escaped! This means # should be put in as %23 for instance.
-
var.elasticsearch.username -
- Value type is string
- Default value is "elastic"
The username to authenticate to a secure Elasticsearch cluster.
-
var.elasticsearch.password -
- Value type is string
- Default value is "changeme"
The password to authenticate to a secure Elasticsearch cluster.
-
var.elasticsearch.ssl.enabled -
- Value type is boolean
- There is no default value for this setting.
Enable SSL/TLS secured communication to the Elasticsearch cluster. Leaving this unspecified will use whatever scheme is specified in the URLs listed in
hosts. If no explicit protocol is specified, plain HTTP will be used. If SSL is explicitly disabled here, the plugin will refuse to start if an HTTPS URL is given in hosts. -
var.elasticsearch.ssl.verification_mode -
- Value type is string
- Default value is "strict"
The hostname verification setting when communicating with Elasticsearch. Set to
disableto turn off hostname verification. Disabling this has serious security concerns. -
var.elasticsearch.ssl.certificate_authority -
- Value type is string
- There is no default value for this setting
The path to an X.509 certificate to use to validate SSL certificates when communicating with Elasticsearch.
-
var.elasticsearch.ssl.certificate -
- Value type is string
- There is no default value for this setting
The path to an X.509 certificate to use for client authentication when communicating with Elasticsearch.
-
var.elasticsearch.ssl.key -
- Value type is string
- There is no default value for this setting
The path to the certificate key for client authentication when communicating with Elasticsearch.
-
var.kibana.host -
- Value type is string
- Default value is "localhost:5601"
Sets the hostname and port of the Kibana instance to use for importing dashboards and visualizations. For example: "myhost:5601".
-
var.kibana.scheme -
- Value type is string
- Default value is "http"
Sets the protocol to use for reaching the Kibana instance. The options are: "http" or "https". The default is "http".
-
var.kibana.username -
- Value type is string
- Default value is "elastic"
The username to authenticate to a secured Kibana instance.
-
var.kibana.password -
- Value type is string
- Default value is "changeme"
The password to authenticate to a secure Kibana instance.
-
var.kibana.ssl.enabled -
- Value type is boolean
- Default value is false
Enable SSL/TLS secured communication to the Kibana instance.
-
var.kibana.ssl.verification_mode -
- Value type is string
- Default value is "strict"
The hostname verification setting when communicating with Kibana. Set to
disableto turn off hostname verification. Disabling this has serious security concerns. -
var.kibana.ssl.certificate_authority -
- Value type is string
- There is no default value for this setting
The path to an X.509 certificate to use to validate SSL certificates when communicating with Kibana.
-
var.kibana.ssl.certificate -
- Value type is string
- There is no default value for this setting
The path to an X.509 certificate to use for client authentication when communicating with Kibana.
-
var.kibana.ssl.key -
- Value type is string
- There is no default value for this setting
The path to the certificate key for client authentication when communicating with Kibana.
Azure module schema
editThis module reads data from the Azure Event Hub and adds some additional structure to the data for Activity Logs and SQL Diagnostics. The original data is always preserved and any data added or parsed will be namespaced under azure. For example, azure.subscription may have been parsed from a longer more complex URN.
| Name | Description | Notes |
|---|---|---|
azure.subscription |
Azure subscription from which this data originates. |
Some Activity Log events may not be associated with a subscription. |
azure.group |
Primary type of data. |
Current values are either activity_log or sql_diagnostics |
azure.category* |
Secondary type of data specific to group from which the data originated |
|
azure.provider |
Azure provider |
|
azure.resource_group |
Azure resource group |
|
azure.resource_type |
Azure resource type |
|
azure.resource_name |
Azure resource name |
|
azure.database |
Azure database name, for display purposes |
SQL Diagnostics only |
azure.db_unique_id |
Azure database name that is guaranteed to be unique |
SQL Diagnostics only |
azure.server |
Azure server for the database |
SQL Diagnostics only |
azure.server_and_database |
Azure server and database combined |
SQL Diagnostics only |
Notes:
- Activity Logs can have the following categories: Administrative, ServiceHealth, Alert, Autoscale, Security
- SQL Diagnostics can have the following categories: Metric, Blocks, Errors, Timeouts, QueryStoreRuntimeStatistics, QueryStoreWaitStatistics, DatabaseWaitStatistics, SQLInsights
Microsoft documents Activity log schema here. The SQL Diagnostics data is documented here. Elastic does not own these data models, and as such, cannot make any assurances of information accuracy or passivity.
Special note - Properties field
editMany of the logs contain a properties top level field. This is often where the
most interesting data lives. There is not a fixed schema between log types for
properties fields coming from different sources.
For example, one log may have
properties.type where one log sets this a String type and another sets this an
Integer type. To avoid mapping errors, the original properties field is moved to
<azure.group>_<azure_category>_properties.<original_key>.
For example
properties.type may end up as sql_diagnostics_Errors_properties.type or
activity_log_Security_properties.type depending on the group/category where
the event originated.
Deploying the module in production
editUse security best practices to secure your configuration. See Secure a cluster for details and recommendations.
Microsoft Azure resources
editMicrosoft is the best source for the most up-to-date Azure information.