To monitor Logstash nodes:
- Install X-Pack in the Logstash installation directory on each node you want to monitor:
-
Configure your Logstash nodes to send metrics to your Elasticsearch cluster by setting the
xpack.monitoring.elasticsearch.urlinlogstash.yml. If security is enabled, you also need to specify the credentials for the built-inlogstash_systemuser. For more information about these settings, see Monitoring Settings.To visualize Logstash as part of the Stack (shown below in Step 5), send metrics to your production cluster. Sending metrics to a dedicated monitoring cluster will show the Logstash metrics under the monitoring cluster.
xpack.monitoring.elasticsearch.url:
["http://es-prod-node-1:9200", "http://es-prod-node-2:9200"]
xpack.monitoring.elasticsearch.username: "logstash_system"
xpack.monitoring.elasticsearch.password: "changeme"
If SSL/TLS is enabled on the production cluster, you must connect through HTTPS. As of v5.2.1, you can specify multiple Elasticsearch hosts as an array as well as specifying a single host as a string. If multiple URLs are specified, Logstash can round-robin requests to these production nodes.
The
logstash_systemuser is automatically added when you install X-Pack. Don’t forget to change the default passwords for all of the built in users. If X-Pack security is disabled on the production cluster, you can omit theusernameandpasswordfor the agent. -
If SSL/TLS is enabled on the production Elasticsearch cluster, specify the trusted CA certificates that will be used to verify the identity of the nodes in the cluster.
To add a CA certificate to a Logstash node’s trusted certificates, you can specify the location of the PEM encoded certificate with the
casetting:xpack.monitoring.elasticsearch.ssl.ca: /path/to/ca.crt
Alternatively, you can configure trusted certificates using a truststore (a Java Keystore file that contains the certificates):
xpack.monitoring.elasticsearch.ssl.truststore.path: /path/to/file
xpack.monitoring.elasticsearch.ssl.truststore.password: password
Also, optionally, you can set up client certificate using a keystore (a Java Keystore file that contains the certificate):
xpack.monitoring.elasticsearch.ssl.keystore.path: /path/to/file
xpack.monitoring.elasticsearch.ssl.keystore.password: password
Set sniffing to
trueto enable discovery of other nodes of the elasticsearch cluster. Defaults tofalse.xpack.monitoring.elasticsearch.sniffing: false
- Restart your Logstash nodes.
-
To verify your X-Pack monitoring configuration, point your web browser at your Kibana host, and select Monitoring from the side navigation. Metrics reported from your Logstash nodes should be visible in the Logstash section. When security is enabled, to view the monitoring dashboards you must log in to Kibana as a user who has the
kibana_userandmonitoring_userroles.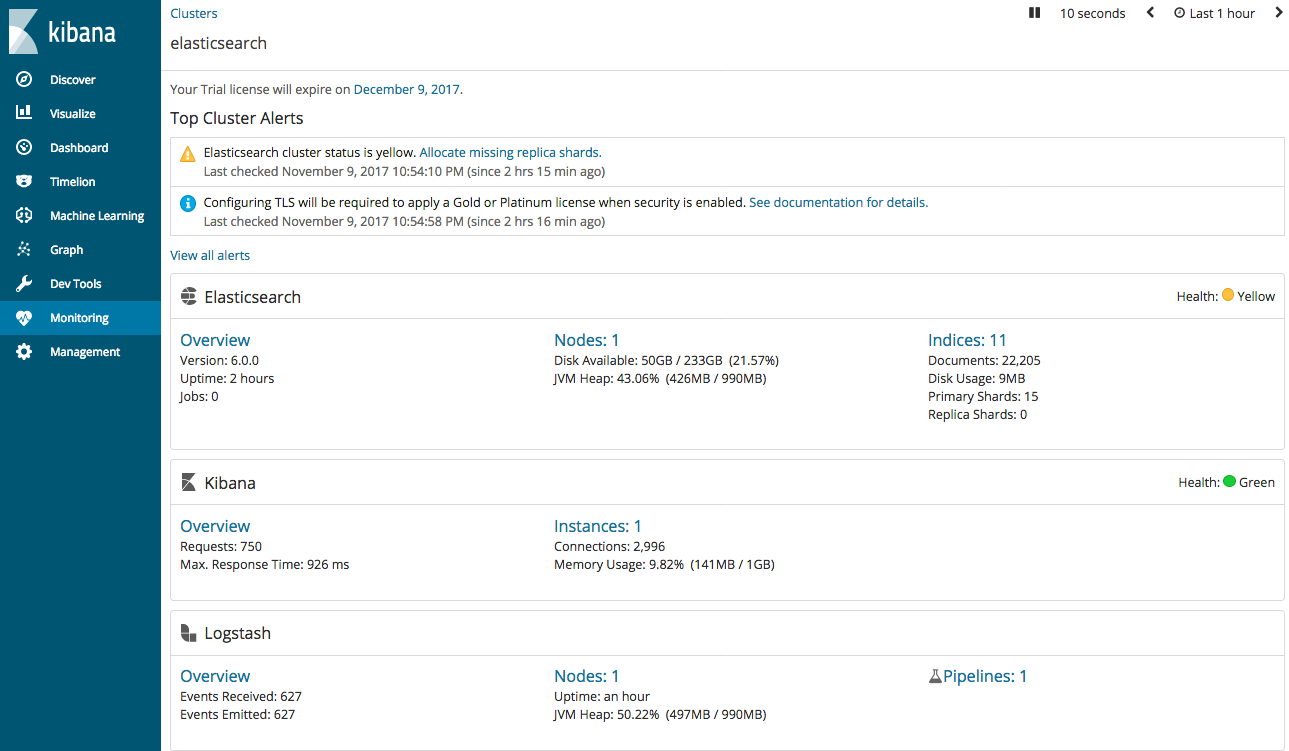
When upgrading from older versions of X-Pack, the built-in logstash_system
user is disabled for security reasons. To resume monitoring,
change the password and re-enable the logstash_system user.
You can set the following xpack.monitoring settings in logstash.yml to
control how monitoring data is collected from your Logstash nodes. However, the
defaults work best in most circumstances. For more information about configuring
Logstash, see logstash.yml.
-
xpack.monitoring.enabled -
Monitoring is enabled by default. Set to
falseto disable X-Pack monitoring. -
xpack.monitoring.elasticsearch.url -
The Elasticsearch instances that you want to ship your Logstash metrics to. This might be
the same Elasticsearch instance specified in the
outputssection in your Logstash configuration, or a different one. This is not the URL of your dedicated monitoring cluster. Even if you are using a dedicated monitoring cluster, the Logstash metrics must be routed through your production cluster. You can specify a single host as a string, or specify multiple hosts as an array. Defaults tohttp://localhost:9200. -
xpack.monitoring.elasticsearch.usernameandxpack.monitoring.elasticsearch.password - If your Elasticsearch is protected with basic authentication, these settings provide the username and password that the Logstash instance uses to authenticate for shipping monitoring data.
-
xpack.monitoring.collection.interval -
Controls how often data samples are collected and shipped on the Logstash side.
Defaults to
10s.
You can configure the following Transport Layer Security (TLS) or Secure Sockets Layer (SSL) settings. For more information, see Configuring Credentials for Logstash Monitoring.
-
xpack.monitoring.elasticsearch.ssl.ca -
Optional setting that enables you to specify a path to the
.pemfile for the certificate authority for your Elasticsearch instance. -
xpack.monitoring.elasticsearch.ssl.truststore.path - Optional settings that provide the paths to the Java keystore (JKS) to validate the server’s certificate.
-
xpack.monitoring.elasticsearch.ssl.truststore.password - Optional settings that provide the password to the truststore.
-
xpack.monitoring.elasticsearch.ssl.keystore.path - Optional settings that provide the paths to the Java keystore (JKS) to validate the client’s certificate.
-
xpack.monitoring.elasticsearch.ssl.keystore.password - Optional settings that provide the password to the keystore.