Parsing Logs with Logstash
editParsing Logs with Logstash
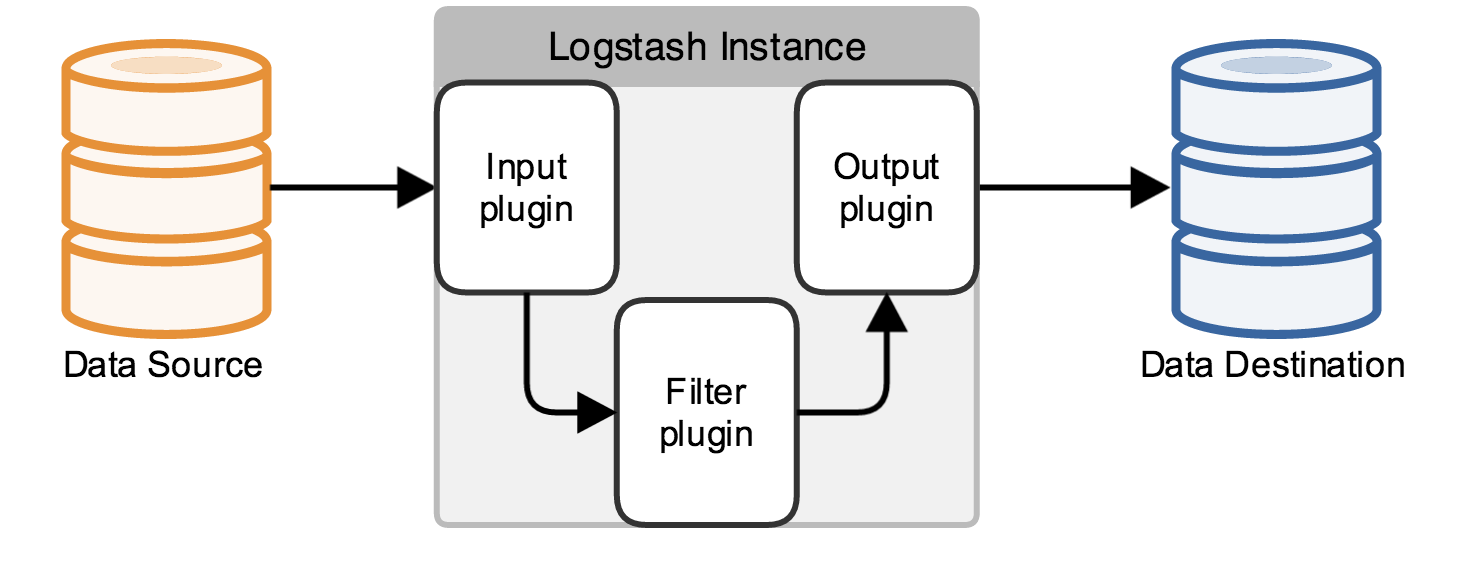
editA Logstash pipeline in most use cases has one or more input, filter, and output plugins. The scenarios in this section build Logstash configuration files to specify these plugins and discuss what each plugin is doing.
The Logstash configuration file defines your Logstash pipeline. When you start a Logstash instance, use the
-f <path/to/file> option to specify the configuration file that defines that instance’s pipeline.
A Logstash pipeline has two required elements, input and output, and one optional element, filter. The input
plugins consume data from a source, the filter plugins modify the data as you specify, and the output plugins write
the data to a destination.
In this section, you create a Logstash pipeline that takes Apache web logs as input, parses those logs to create specific, named fields from the logs, and writes the parsed data to an Elasticsearch cluster. Rather than defining the pipeline configuration at the command line, you’ll define the pipeline in a config file.
The following text represents the skeleton of a configuration pipeline:
# The # character at the beginning of a line indicates a comment. Use
# comments to describe your configuration.
input {
}
# The filter part of this file is commented out to indicate that it is
# optional.
# filter {
#
# }
output {
}
This skeleton is non-functional, because the input and output sections don’t have any valid options defined.
To get started, copy and paste the skeleton configuration pipeline into a file named first-pipeline.conf in your home
Logstash directory. Then go here to
download the sample data set used in this example. Unpack the file.
Configuring Logstash for File Input
editThis example uses the file input plugin for convenience. To tail files in the real world, you’ll use Filebeat to ship log events to Logstash. You learn how to configure the Filebeat input plugin later when you build a more sophisticated pipeline.
To begin your Logstash pipeline, configure the Logstash instance to read from a file by using the file input plugin.
Edit the first-pipeline.conf file and replace the entire input section with the following text:
|
The default behavior of the file input plugin is to monitor a file for new information, in a manner similar to the
UNIX |
|
|
Setting |
Replace /path/to/file with the absolute path to the location of logstash-tutorial.log in your file system.
Parsing Web Logs with the Grok Filter Plugin
editThe grok filter plugin is one of several plugins that are available by default in
Logstash. For details on how to manage Logstash plugins, see the reference documentation for
the plugin manager.
The grok filter plugin enables you to parse the unstructured log data into something structured and queryable.
Because the grok filter plugin looks for patterns in the incoming log data, configuration requires you to make
decisions about how to identify the patterns that are of interest to your use case. A representative line from the web
server log sample looks like this:
83.149.9.216 - - [04/Jan/2015:05:13:42 +0000] "GET /presentations/logstash-monitorama-2013/images/kibana-search.png
HTTP/1.1" 200 203023 "http://semicomplete.com/presentations/logstash-monitorama-2013/" "Mozilla/5.0 (Macintosh; Intel
Mac OS X 10_9_1) AppleWebKit/537.36 (KHTML, like Gecko) Chrome/32.0.1700.77 Safari/537.36"
The IP address at the beginning of the line is easy to identify, as is the timestamp in brackets. To parse the data, you can use the %{COMBINEDAPACHELOG} grok pattern, which structures lines from the Apache log using the following schema:
|
Information |
Field Name |
|
IP Address |
|
|
User ID |
|
|
User Authentication |
|
|
timestamp |
|
|
HTTP Verb |
|
|
Request body |
|
|
HTTP Version |
|
|
HTTP Status Code |
|
|
Bytes served |
|
|
Referrer URL |
|
|
User agent |
|
Edit the first-pipeline.conf file and replace the entire filter section with the following text:
filter {
    grok {
        match => { "message" => "%{COMBINEDAPACHELOG}"}
    }
}
After processing the log file with the grok pattern, the sample line will have the following JSON representation:
{
"clientip" : "83.149.9.216",
"ident" : ,
"auth" : ,
"timestamp" : "04/Jan/2015:05:13:42 +0000",
"verb" : "GET",
"request" : "/presentations/logstash-monitorama-2013/images/kibana-search.png",
"httpversion" : "HTTP/1.1",
"response" : "200",
"bytes" : "203023",
"referrer" : "http://semicomplete.com/presentations/logstash-monitorama-2013/",
"agent" : "Mozilla/5.0 (Macintosh; Intel Mac OS X 10_9_1) AppleWebKit/537.36 (KHTML, like Gecko) Chrome/32.0.1700.77 Safari/537.36"
}
Enhancing Your Data with the Geoip Filter Plugin
editIn addition to parsing log data for better searches, filter plugins can derive supplementary information from existing
data. As an example, the geoip plugin looks up IP addresses, derives geographic
location information from the addresses, and adds that location information to the logs.
Configure your Logstash instance to use the geoip filter plugin by adding the following lines to the filter section
of the first-pipeline.conf file:
geoip {
    source => "clientip"
}
The geoip plugin configuration requires you to specify the name of the source field that contains the IP address to look up. In this example, the clientip field contains the IP address.
Since filters are evaluated in sequence, make sure that the geoip section is after the grok section of
the configuration file and that both the grok and geoip sections are nested within the filter section
like this:
 filter {
    grok {
        match => { "message" => "%{COMBINEDAPACHELOG}"}
    }
    geoip {
        source => "clientip"
    }
Indexing Your Data into Elasticsearch
editNow that the web logs are broken down into specific fields, the Logstash pipeline can index the data into an
Elasticsearch cluster. Edit the first-pipeline.conf file and replace the entire output section with the following
text:
output {
    elasticsearch {
        hosts => [ "localhost:9200" ]
    }
}
With this configuration, Logstash uses http protocol to connect to Elasticsearch. The above example assumes that
Logstash and Elasticsearch are running on the same instance. You can specify a remote Elasticsearch instance by using
the hosts configuration to specify something like hosts => [ "es-machine:9092" ].
Testing Your Initial Pipeline
editAt this point, your first-pipeline.conf file has input, filter, and output sections properly configured, and looks
like this:
input {
    file {
        path => "/Users/myusername/tutorialdata/*.log"
        start_position => beginning
        ignore_older => 0
    }
}
filter {
    grok {
        match => { "message" => "%{COMBINEDAPACHELOG}"}
    }
    geoip {
        source => "clientip"
    }
}
output {
    elasticsearch {
        hosts => [ "localhost:9200" ]
    }
}
To verify your configuration, run the following command:
bin/logstash -f first-pipeline.conf --configtest
The --configtest option parses your configuration file and reports any errors. When the configuration file passes
the configuration test, start Logstash with the following command:
bin/logstash -f first-pipeline.conf
Try a test query to Elasticsearch based on the fields created by the grok filter plugin:
curl -XGET 'localhost:9200/logstash-$DATE/_search?pretty&q=response=200'
Replace $DATE with the current date, in YYYY.MM.DD format.
We get multiple hits back. For example:
{
  "took" : 4,
  "timed_out" : false,
  "_shards" : {
    "total" : 5,
    "successful" : 5,
    "failed" : 0
  },
  "hits" : {
    "total" : 98,
    "max_score" : 5.0091305,
    "hits" : [ {
      "_index" : "logstash-2016.08.30",
      "_type" : "logs",
      "_id" : "AVbd1HyuICXLyJ--dz7g",
      "_score" : 5.0091305,
      "_source" : {
        "message" : "83.149.9.216 - - [04/Jan/2015:05:13:45 +0000] \"GET /presentations/logstash-monitorama-2013/images/frontend-response-codes.png HTTP/1.1\" 200 52878 \"http://semicomplete.com/presentations/logstash-monitorama-2013/\" \"Mozilla/5.0 (Macintosh; Intel Mac OS X 10_9_1) AppleWebKit/537.36 (KHTML, like Gecko) Chrome/32.0.1700.77 Safari/537.36\"",
        "@version" : "1",
        "@timestamp" : "2016-08-30T23:41:45.044Z",
        "path" : "/Users/myusername/tutorialdata/logstash-tutorial.log",
        "host" : "My-Macbook.local",
        "clientip" : "83.149.9.216",
        "ident" : "-",
        "auth" : "-",
        "timestamp" : "04/Jan/2015:05:13:45 +0000",
        "verb" : "GET",
        "request" : "/presentations/logstash-monitorama-2013/images/frontend-response-codes.png",
        "httpversion" : "1.1",
        "response" : "200",
        "bytes" : "52878",
        "referrer" : "\"http://semicomplete.com/presentations/logstash-monitorama-2013/\"",
        "agent" : "\"Mozilla/5.0 (Macintosh; Intel Mac OS X 10_9_1) AppleWebKit/537.36 (KHTML, like Gecko) Chrome/32.0.1700.77 Safari/537.36\"",
        "geoip" : {
          "ip" : "83.149.9.216",
          "country_code2" : "RU",
          "country_code3" : "RUS",
          "country_name" : "Russian Federation",
          "continent_code" : "EU",
          "region_name" : "48",
          "city_name" : "Moscow",
          "latitude" : 55.75219999999999,
          "longitude" : 37.6156,
          "timezone" : "Europe/Moscow",
          "real_region_name" : "Moscow City",
          "location" : [ 37.6156, 55.75219999999999 ]
        }
      }
    },
    ...
Try another search for the geographic information derived from the IP address:
curl -XGET 'localhost:9200/logstash-$DATE/_search?pretty&q=geoip.city_name=Buffalo'
Replace $DATE with the current date, in YYYY.MM.DD format.
One of the log entries comes from Buffalo, so the query produces the following response:
{
  "took" : 6,
  "timed_out" : false,
  "_shards" : {
    "total" : 5,
    "successful" : 5,
    "failed" : 0
  },
  "hits" : {
    "total" : 1,
    "max_score" : 1.0149983,
    "hits" : [ {
      "_index" : "logstash-2016.08.30",
      "_type" : "logs",
      "_id" : "AVbd1HyuICXLyJ--dz8u",
      "_score" : 1.0149983,
      "_source" : {
        "message" : "108.174.55.234 - - [04/Jan/2015:05:27:45 +0000] \"GET /?flav=rss20 HTTP/1.1\" 200 29941 \"-\" \"-\"",
        "@version" : "1",
        "@timestamp" : "2016-08-30T23:41:45.066Z",
        "path" : "/Users/myusername/tutorialdata/logstash-tutorial.log",
        "host" : "My-Macbook",
        "clientip" : "108.174.55.234",
        "ident" : "-",
        "auth" : "-",
        "timestamp" : "04/Jan/2015:05:27:45 +0000",
        "verb" : "GET",
        "request" : "/?flav=rss20",
        "httpversion" : "1.1",
        "response" : "200",
        "bytes" : "29941",
        "referrer" : "\"-\"",
        "agent" : "\"-\"",
        "geoip" : {
          "ip" : "108.174.55.234",
          "country_code2" : "US",
          "country_code3" : "USA",
          "country_name" : "United States",
          "continent_code" : "NA",
          "region_name" : "NY",
          "city_name" : "Buffalo",
          "postal_code" : "14221",
          "latitude" : 42.9864,
          "longitude" : -78.7279,
          "dma_code" : 514,
          "area_code" : 716,
          "timezone" : "America/New_York",
          "real_region_name" : "New York",
          "location" : [ -78.7279, 42.9864 ]
        }
      }
    } ]
  }
}
Stitching Together Multiple Input and Output Plugins
editThe information you need to manage often comes from several disparate sources, and use cases can require multiple destinations for your data. Your Logstash pipeline can use multiple input and output plugins to handle these requirements.
In this section, you create a Logstash pipeline that takes input from a Twitter feed and the Filebeat client, then sends the information to an Elasticsearch cluster as well as writing the information directly to a file.
Reading from a Twitter feed
editTo add a Twitter feed, you use the twitter input plugin. To
configure the plugin, you need several pieces of information:
- A consumer key, which uniquely identifies your Twitter app.
- A consumer secret, which serves as the password for your Twitter app.
- One or more keywords to search in the incoming feed.
- An oauth token, which identifies the Twitter account using this app.
- An oauth token secret, which serves as the password of the Twitter account.
Visit https://dev.twitter.com/apps to set up a Twitter account and generate your consumer
key and secret, as well as your access token and secret. See the docs for the twitter input plugin if you’re not sure how to generate these keys.
Like you did earlier when you worked on Parsing Logs with Logstash, create a config file (called second-pipeline.conf) that
contains the skeleton of a configuration pipeline. If you want, you can reuse the file you created earlier, but make
sure you pass in the correct config file name when you run Logstash.
Add the following lines to the input section of the second-pipeline.conf file, substituting your values for the
placeholder values shown here:
    twitter {
        consumer_key => "enter_your_consumer_key_here"
        consumer_secret => "enter_your_secret_here"
        keywords => ["cloud"]
        oauth_token => "enter_your_access_token_here"
        oauth_token_secret => "enter_your_access_token_secret_here"
    }
The Filebeat Client
editThe Filebeat client is a lightweight, resource-friendly tool that
collects logs from files on the server and forwards these logs to your Logstash instance for processing. Filebeat is
designed for reliability and low latency. Filebeat uses the computing resources of the machine hosting the source data,
and the Beats input plugin minimizes the
resource demands on the Logstash instance.
In a typical use case, Filebeat runs on a separate machine from the machine running your Logstash instance. For the purposes of this tutorial, Logstash and Filebeat are running on the same machine.
The default Logstash installation includes the Beats input plugin. To install
Filebeat on your data source machine, download the appropriate package from the Filebeat product page.
After installing Filebeat, you need to configure it. Open the filebeat.yml file located in your Filebeat installation
directory, and replace the contents with the following lines. Make sure paths points to your syslog:
filebeat:
  prospectors:
    -
      paths:
        - /var/log/*.log
      fields:
        type: syslog
output:
  logstash:
    hosts: ["localhost:5043"]
|
Absolute path to the file or files that Filebeat processes. |
|
|
Adds a field called |
Save your changes.
To keep the configuration simple, you won’t specify TLS/SSL settings as you would in a real world scenario.
Configure your Logstash instance to use the Filebeat input plugin by adding the following lines to the input section
of the second-pipeline.conf file:
    beats {
        port => "5043"
    }
Writing Logstash Data to a File
editYou can configure your Logstash pipeline to write data directly to a file with the
file output plugin.
Configure your Logstash instance to use the file output plugin by adding the following lines to the output section
of the second-pipeline.conf file:
    file {
        path => /path/to/target/file
    }
Writing to Multiple Elasticsearch Nodes
editWriting to multiple Elasticsearch nodes lightens the resource demands on a given Elasticsearch node, as well as providing redundant points of entry into the cluster when a particular node is unavailable.
To configure your Logstash instance to write to multiple Elasticsearch nodes, edit the output section of the second-pipeline.conf file to read:
output {
    elasticsearch {
        hosts => ["IP Address 1:port1", "IP Address 2:port2", "IP Address 3"]
    }
}
Use the IP addresses of three non-master nodes in your Elasticsearch cluster in the host line. When the hosts
parameter lists multiple IP addresses, Logstash load-balances requests across the list of addresses. Also note that
default port for Elasticsearch is 9200 and can be omitted in the configuration above.
Testing the Pipeline
editAt this point, your second-pipeline.conf file looks like this:
input {
    twitter {
        consumer_key => "enter_your_consumer_key_here"
        consumer_secret => "enter_your_secret_here"
        keywords => ["cloud"]
        oauth_token => "enter_your_access_token_here"
        oauth_token_secret => "enter_your_access_token_secret_here"
    }
    beats {
        port => "5043"
    }
}
output {
    elasticsearch {
        hosts => ["IP Address 1:port1", "IP Address 2:port2", "IP Address 3"]
    }
    file {
        path => "/path/to/target/file"
    }
}
Logstash is consuming data from the Twitter feed you configured, receiving data from Filebeat, and indexing this information to three nodes in an Elasticsearch cluster as well as writing to a file.
At the data source machine, run Filebeat with the following command:
sudo ./filebeat -e -c filebeat.yml -d "publish"
Filebeat will attempt to connect on port 5403. Until Logstash starts with an active Beats plugin, there won’t be any answer on that port, so any messages you see regarding failure to connect on that port are normal for now.
To verify your configuration, run the following command:
bin/logstash -f second-pipeline.conf --configtest
The --configtest option parses your configuration file and reports any errors. When the configuration file passes
the configuration test, start Logstash with the following command:
bin/logstash -f second-pipeline.conf
Use the grep utility to search in the target file to verify that information is present:
grep syslog /path/to/target/file
Run an Elasticsearch query to find the same information in the Elasticsearch cluster:
curl -XGET 'localhost:9200/logstash-$DATE/_search?pretty&q=fields.type:syslog'
Replace $DATE with the current date, in YYYY.MM.DD format.
To see data from the Twitter feed, try this query:
curl -XGET 'http://localhost:9200/logstash-$DATE/_search?pretty&q=client:iphone'
Again, remember to replace $DATE with the current date, in YYYY.MM.DD format.