Transaction overview
editTransaction overview
editA transaction describes an event captured by an Elastic APM agent instrumenting a service. APM agents automatically collect performance metrics on HTTP requests, database queries, and much more.
Selecting a service brings you to the transactions overview.
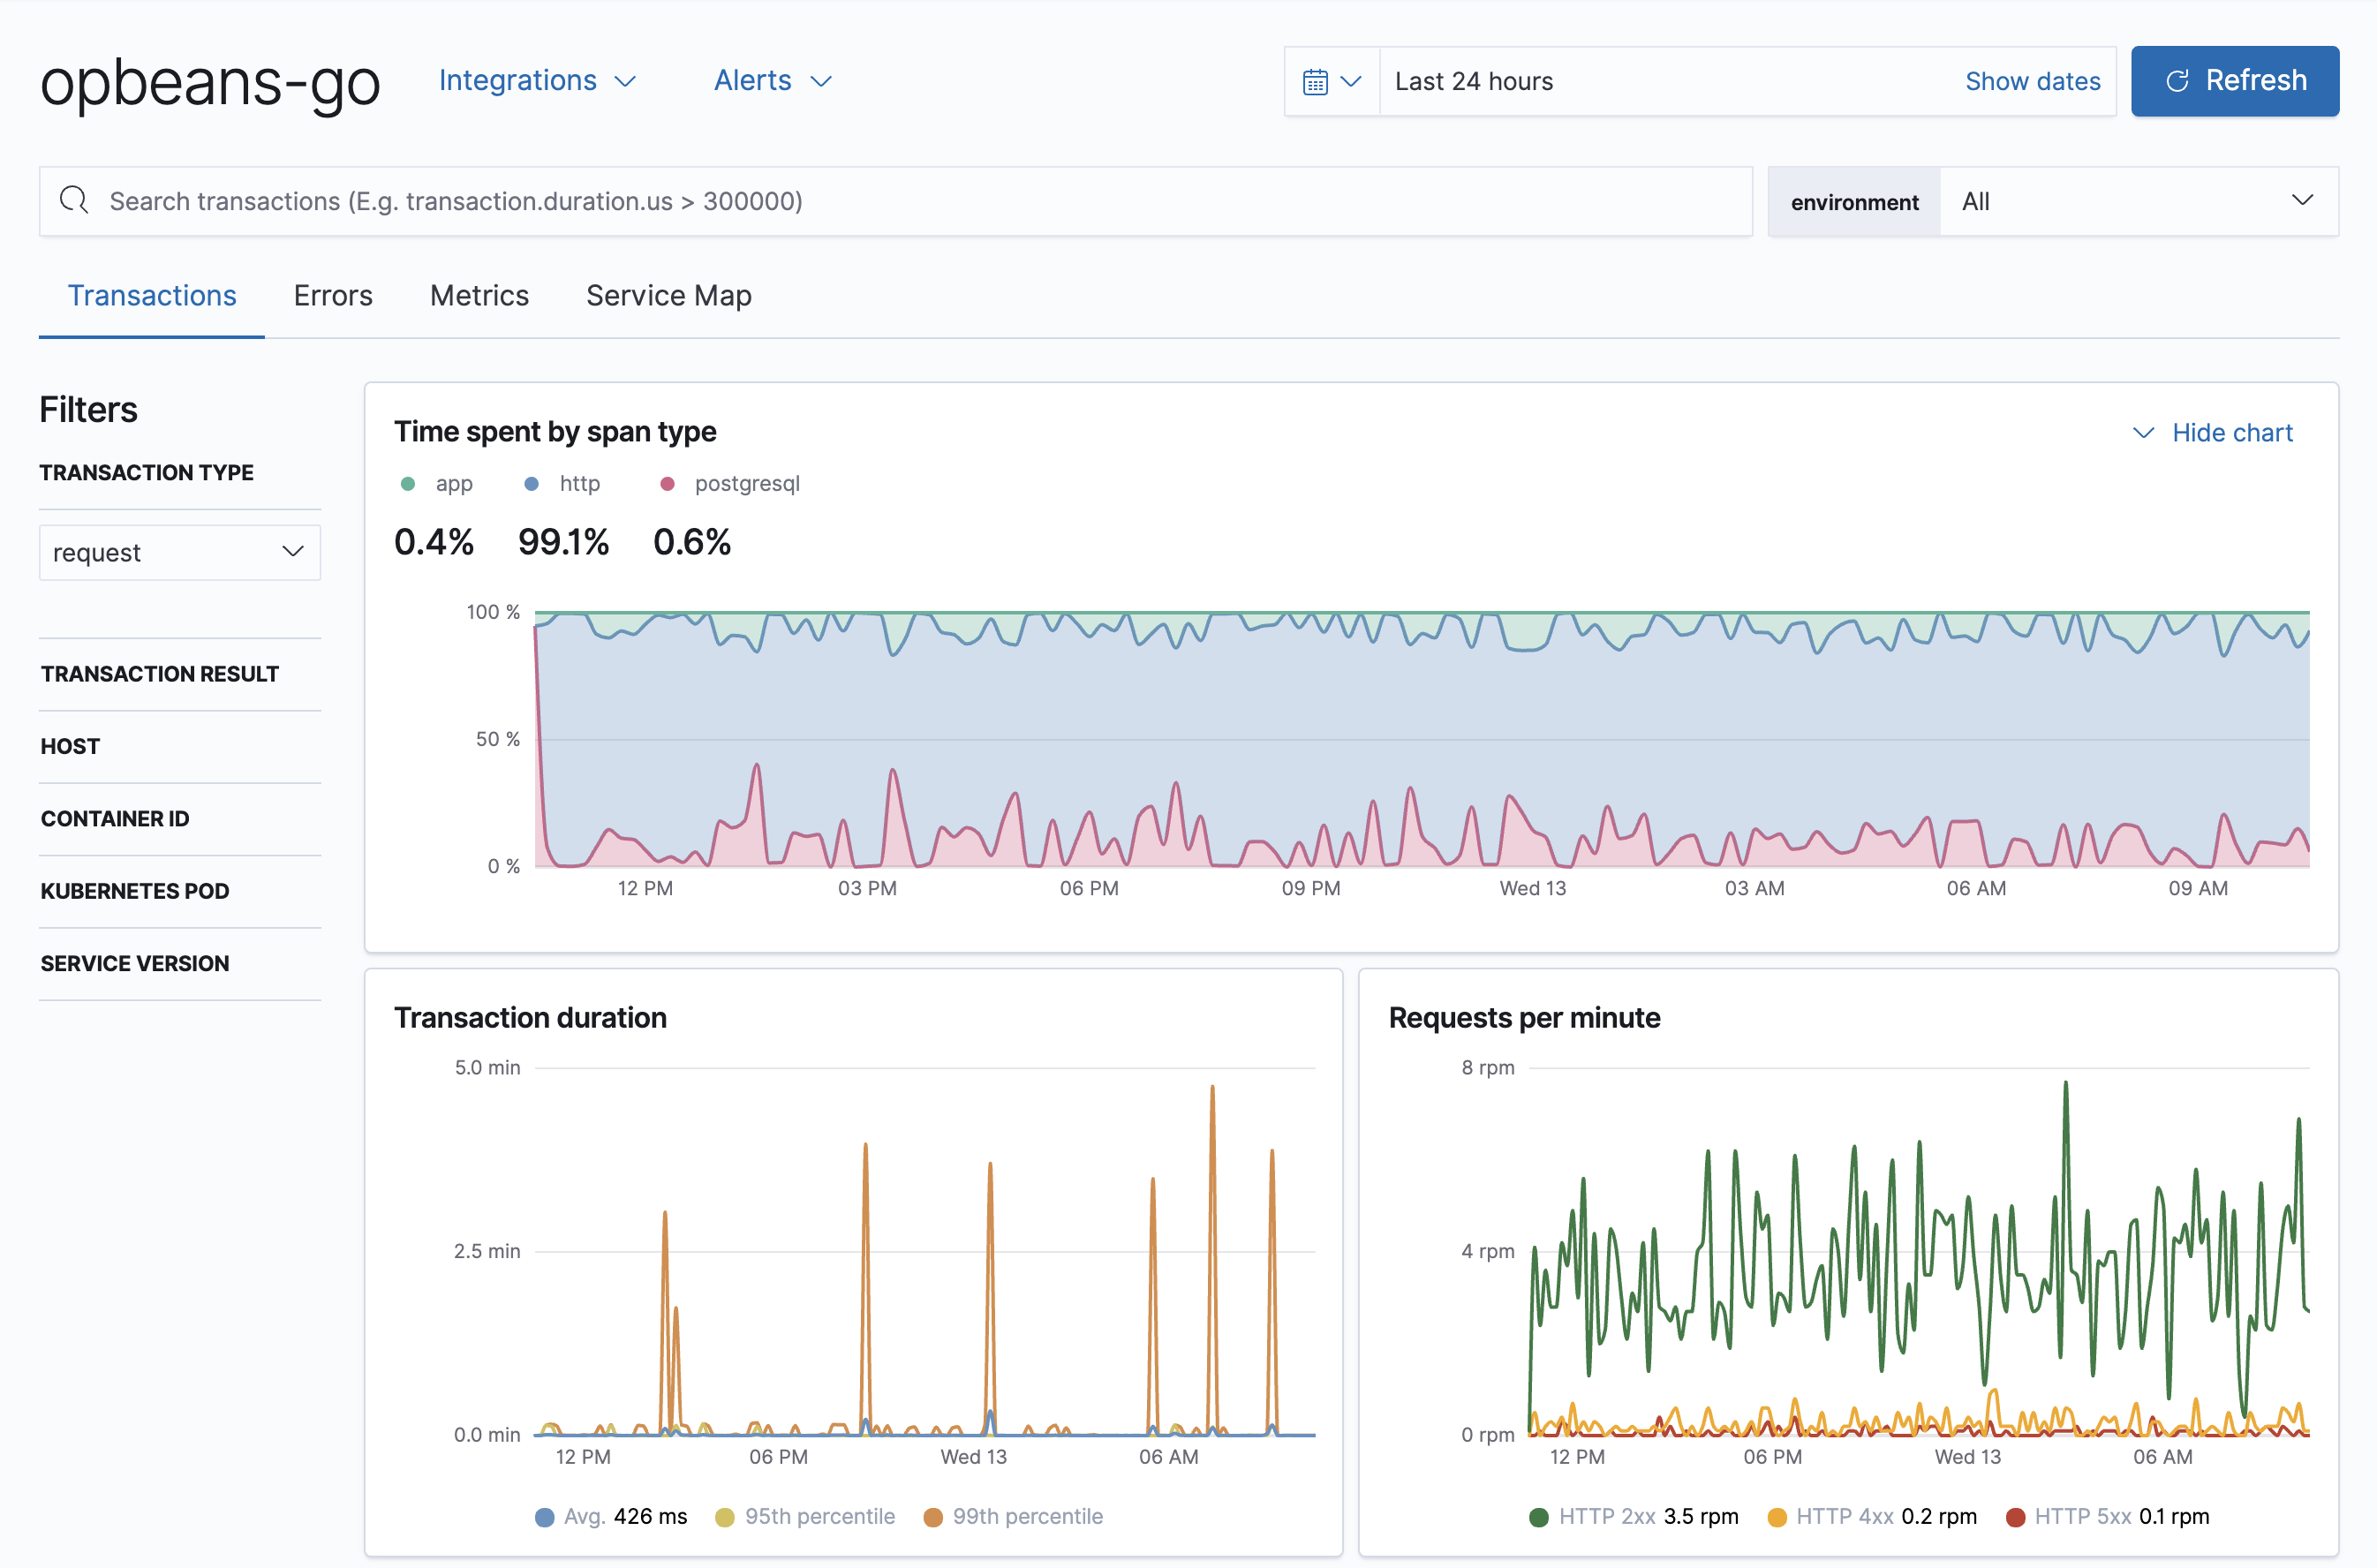
The time spent by span type, transaction duration, and requests per minute chart display information on all transactions associated with the selected service:
- Time spent by span type
-
Visualize where your application is spending most of its time. For example, is your app spending time in external calls, database processing, or application code execution?
The time a transaction took to complete is also recorded and displayed on the chart under the "app" label. "app" indicates that something was happening within the application, but we’re not sure exactly what. This could be a sign that the agent does not have auto-instrumentation for whatever was happening during that time.
It’s important to note that if you have asynchronous spans, the sum of all span times may exceed the duration of the transaction.
- Transaction duration
- Response times for this service, broken down into average, 95th, and 99th percentile. If there’s a weird spike that you’d like to investigate, you can simply zoom in on the graph - this will adjust the specific time range, and all of the data on the page will update accordingly.
- Requests per minute
-
Visualize response codes:
2xx,3xx,4xx, etc., and is useful for determining if you’re serving more of one code than you typically do. Like in the Transaction duration graph, you can zoom in on anomalies to further investigate them.
Transactions table
editThe Transactions table displays a list of transaction groups for the selected service. In other words, this view groups all transactions of the same name together, and only displays one entry for each group.
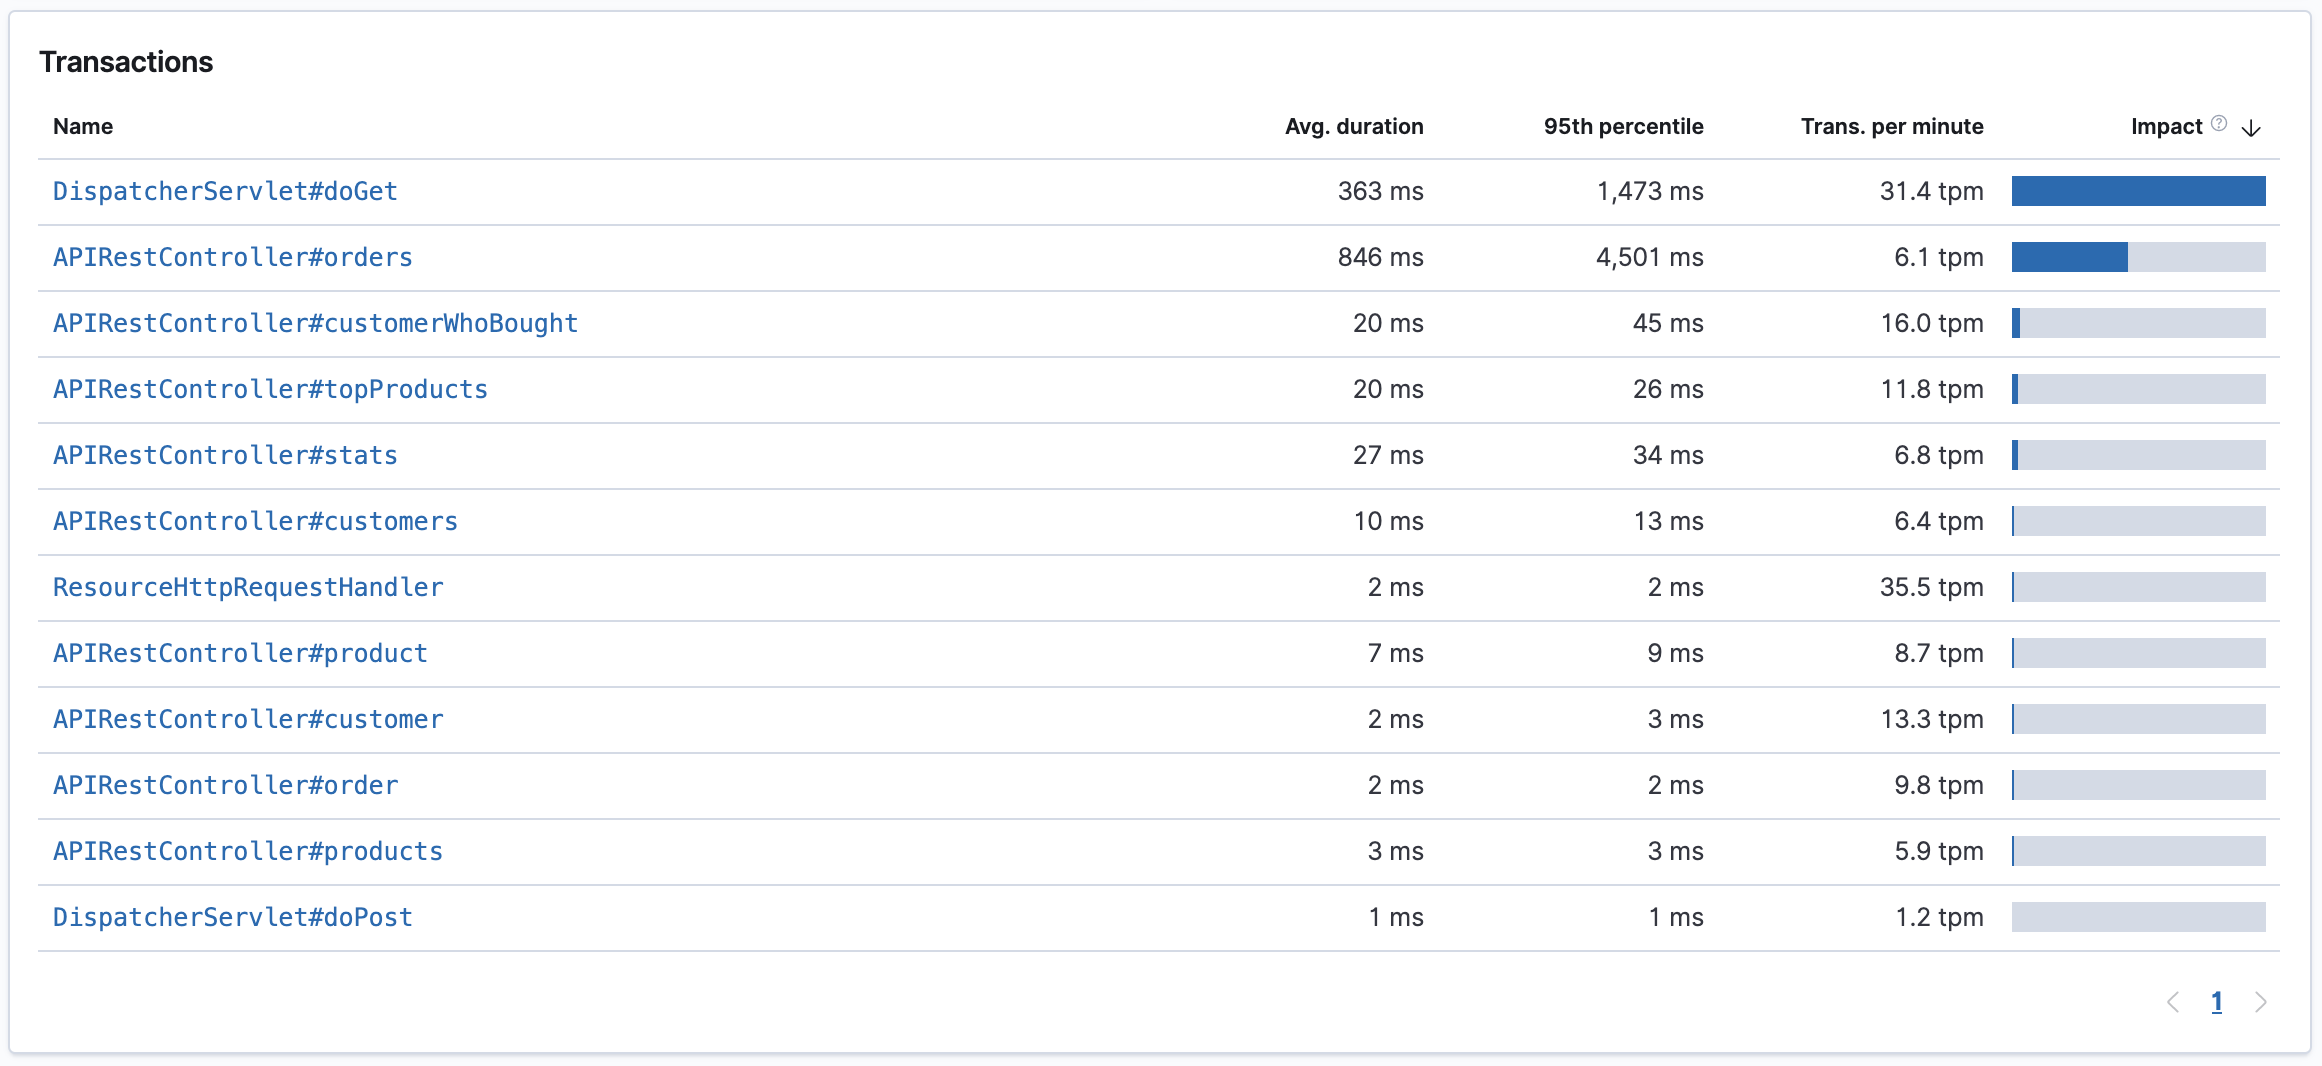
By default, transaction groups are sorted by Impact. Impact helps show the most used and slowest endpoints in your service - in other words, it’s the collective amount of pain a specific endpoint is causing your users. If there’s a particular endpoint you’re worried about, you can click on it to view the transaction details.
If you only see one route in the Transactions table, or if you have transactions named "unknown route", it could be a symptom that the agent either wasn’t installed correctly or doesn’t support your framework.
For further details, including troubleshooting and custom implementation instructions, refer to the documentation for each APM Agent you’ve implemented.
RUM Transaction overview
editThe transaction overview page is customized for the JavaScript RUM Agent. This page highlights things like page load times, transactions per minute, and even the average page load duration distribution by country.
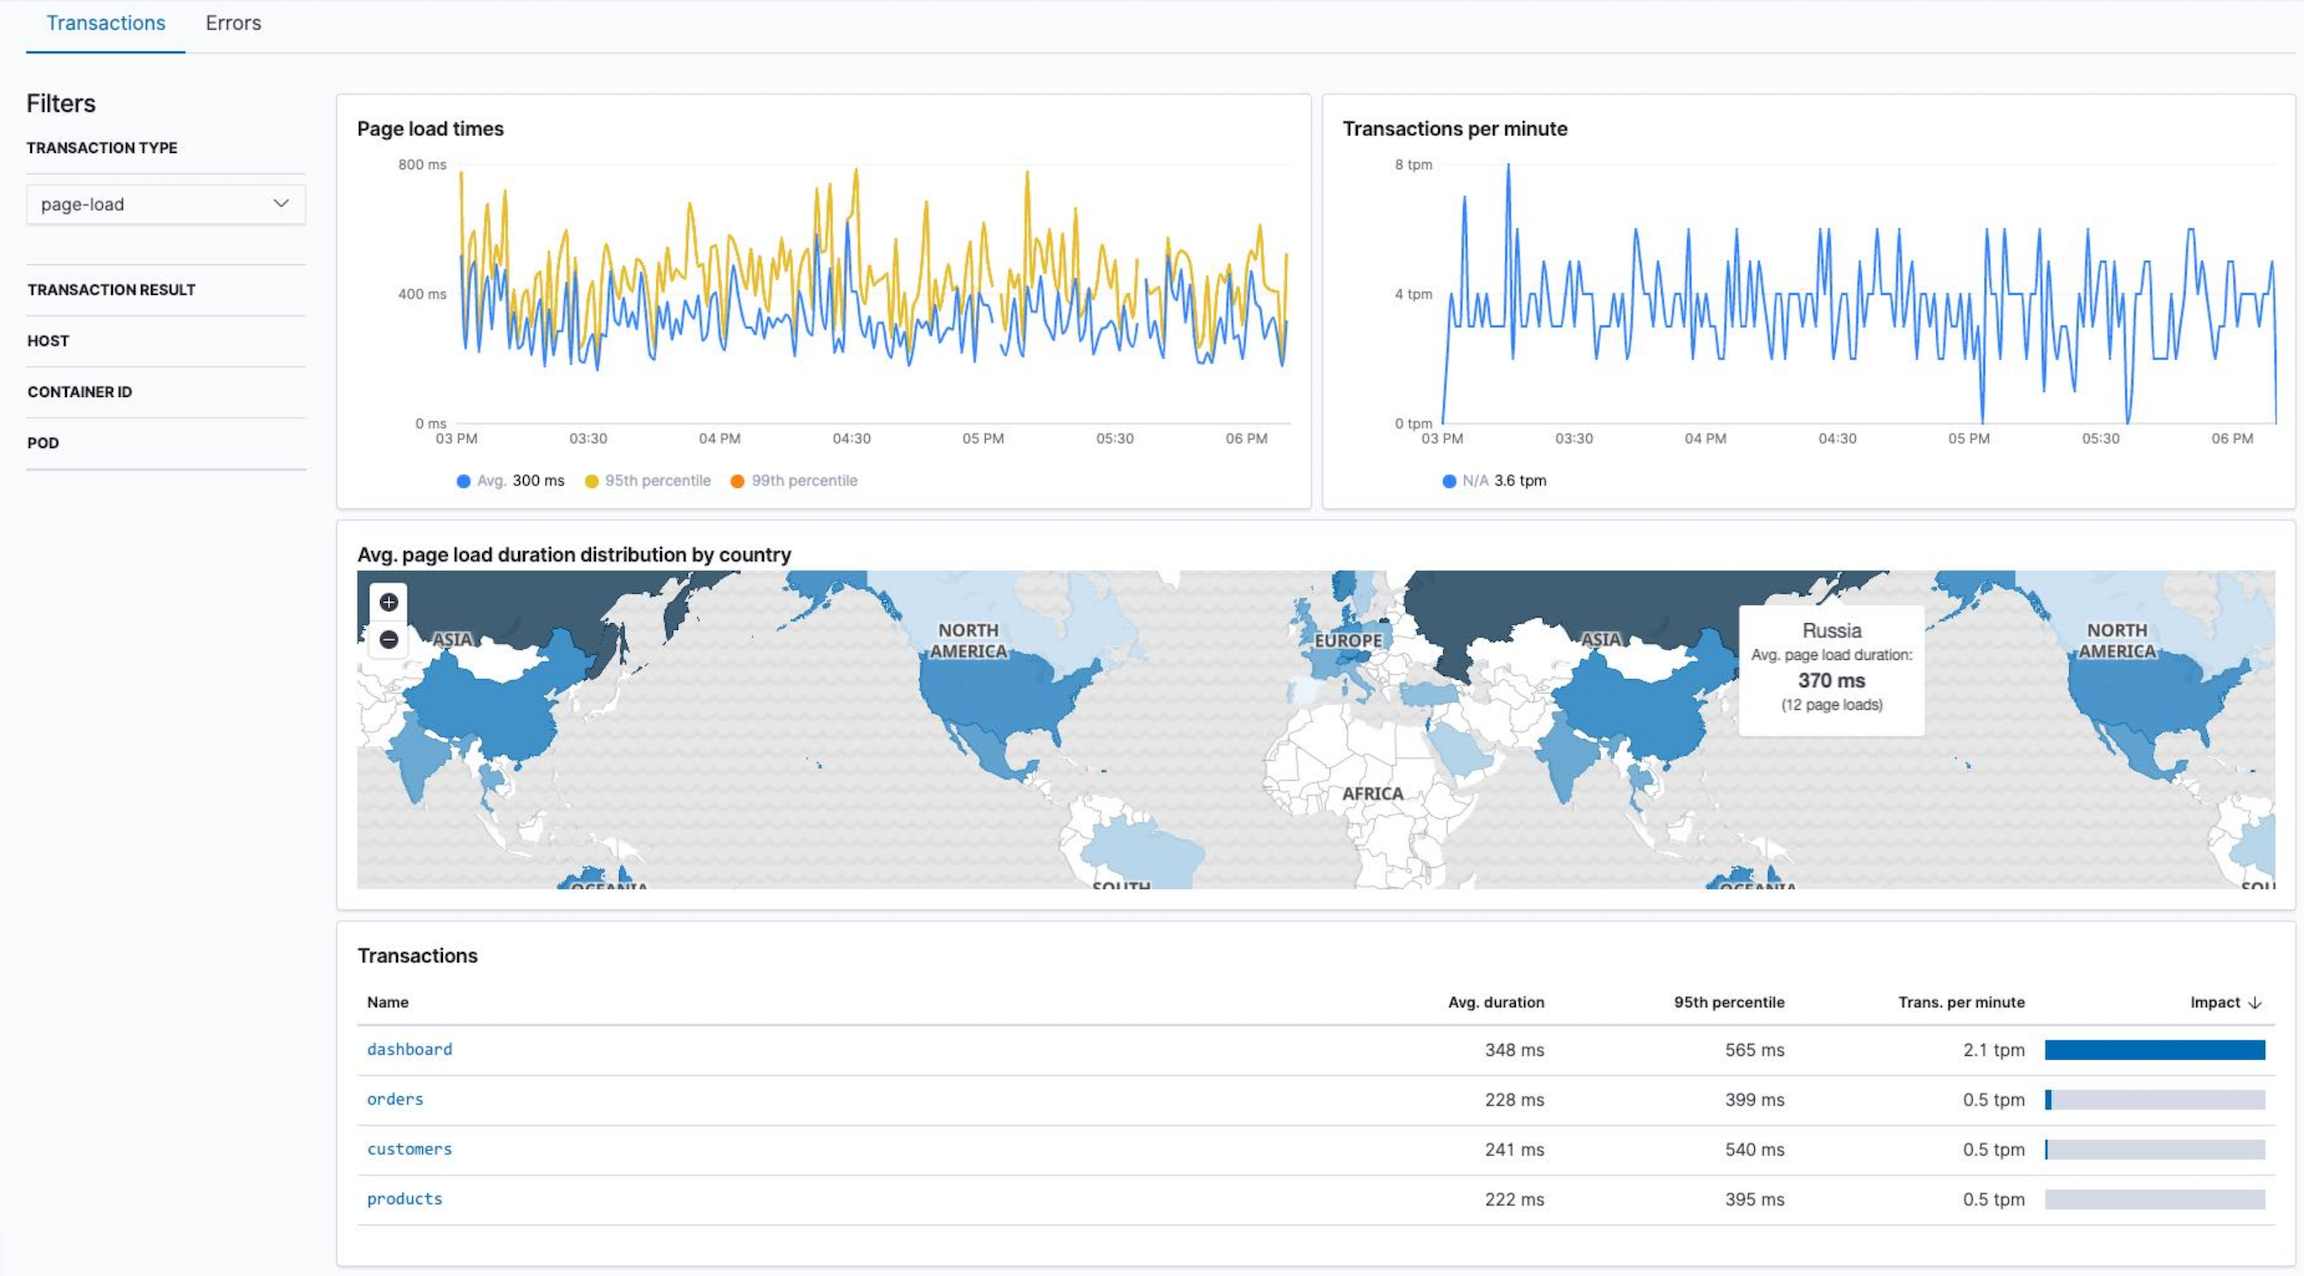
This data is available due to the geo-ip and user agent pipelines being enabled by default, which allows for the capture of geo-location and user agent data. These visualizations make it easy for you to visualize performance information about your end-users' experience based on their location.
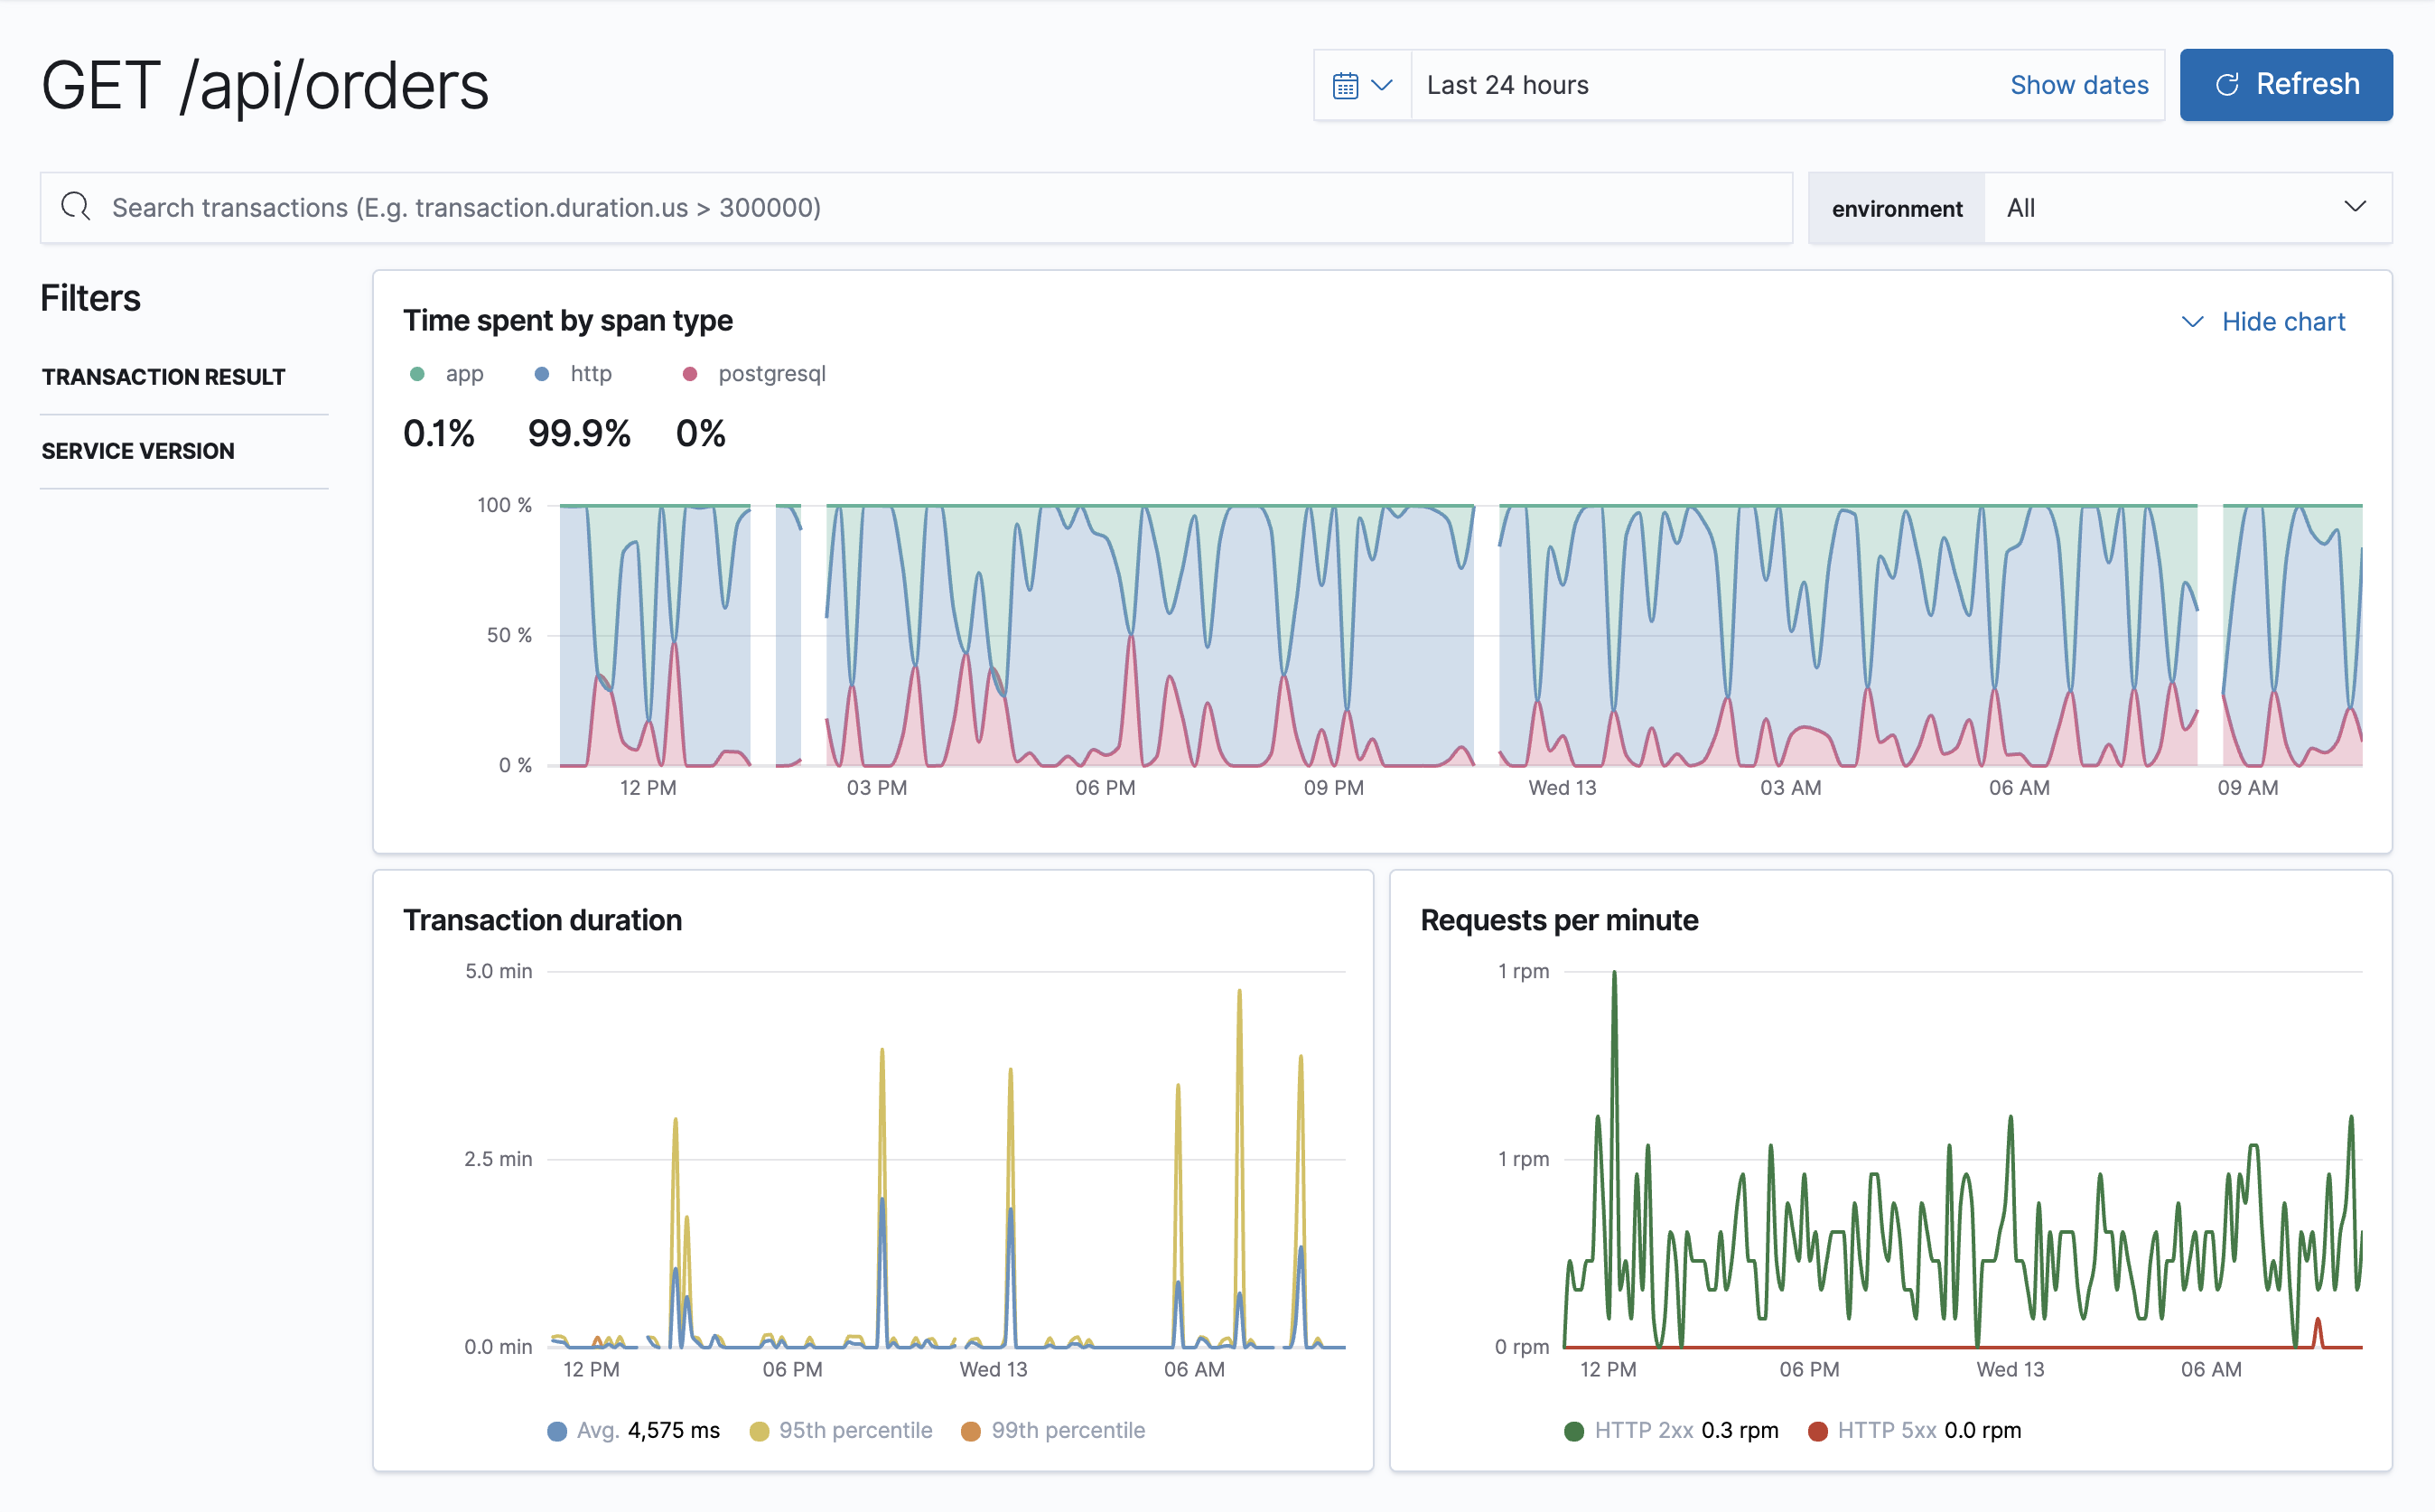
Transaction details
editSelecting a transaction group will bring you to the transaction details. Transaction details include a high-level overview of the time spent by span type, transaction group duration, requests per minute, and transaction group duration distribution. It’s important to note that all of these graphs show data from every transaction within the selected transaction group.
Up to ten sampled transactions are also displayed. These sampled transactions are based on your selection in the Transactions duration distribution. You can update the sampled transactions by selecting a new bucket in the transactions duration distribution graph. The number of requests per bucket is displayed when hovering over the graph, and the selected bucket is highlighted to stand out.
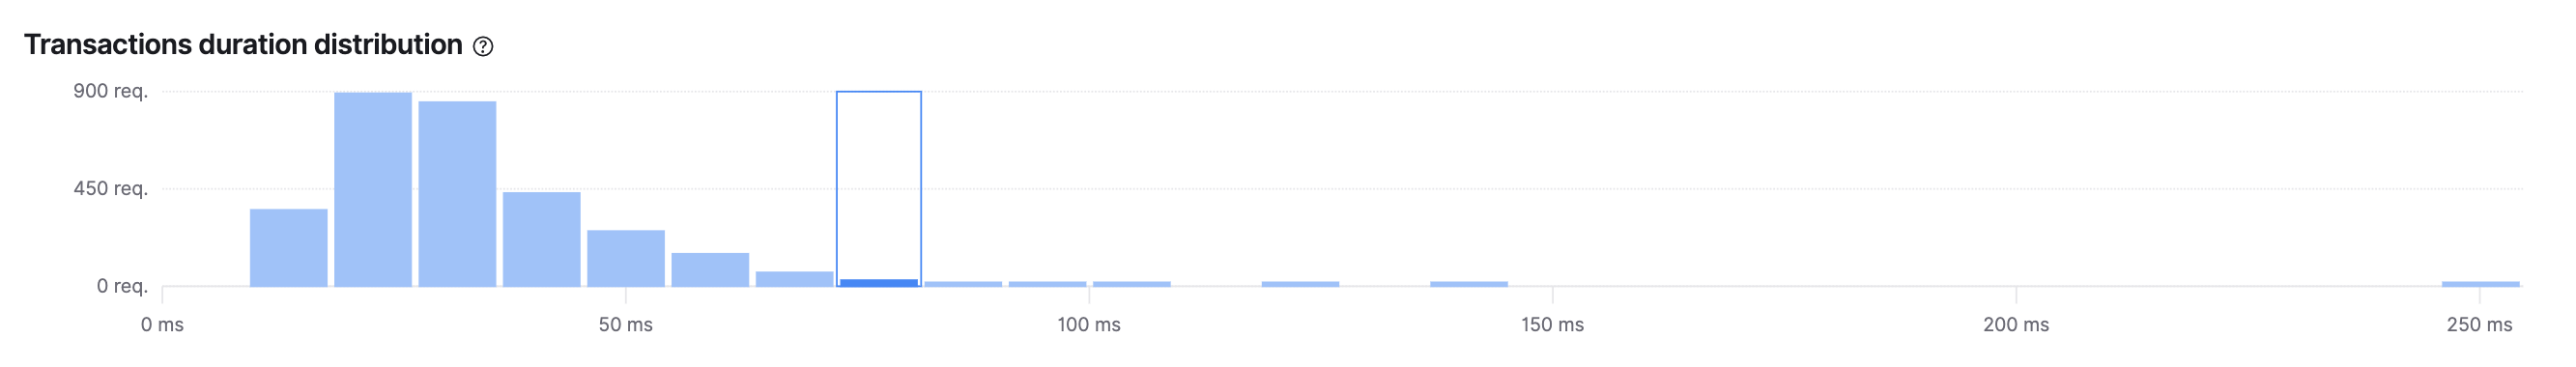
This graph shows a typical distribution, and indicates most of our requests were served quickly—awesome! It’s the requests on the right, the ones taking longer than average, that we probably want to focus on.
When you select one of these buckets, you’re presented with up to ten trace samples. Each sample has a trace timeline waterfall that shows what a typical request in that bucket was doing. By investigating this timeline waterfall, we can hopefully determine why this request was slow and then implement a fix.
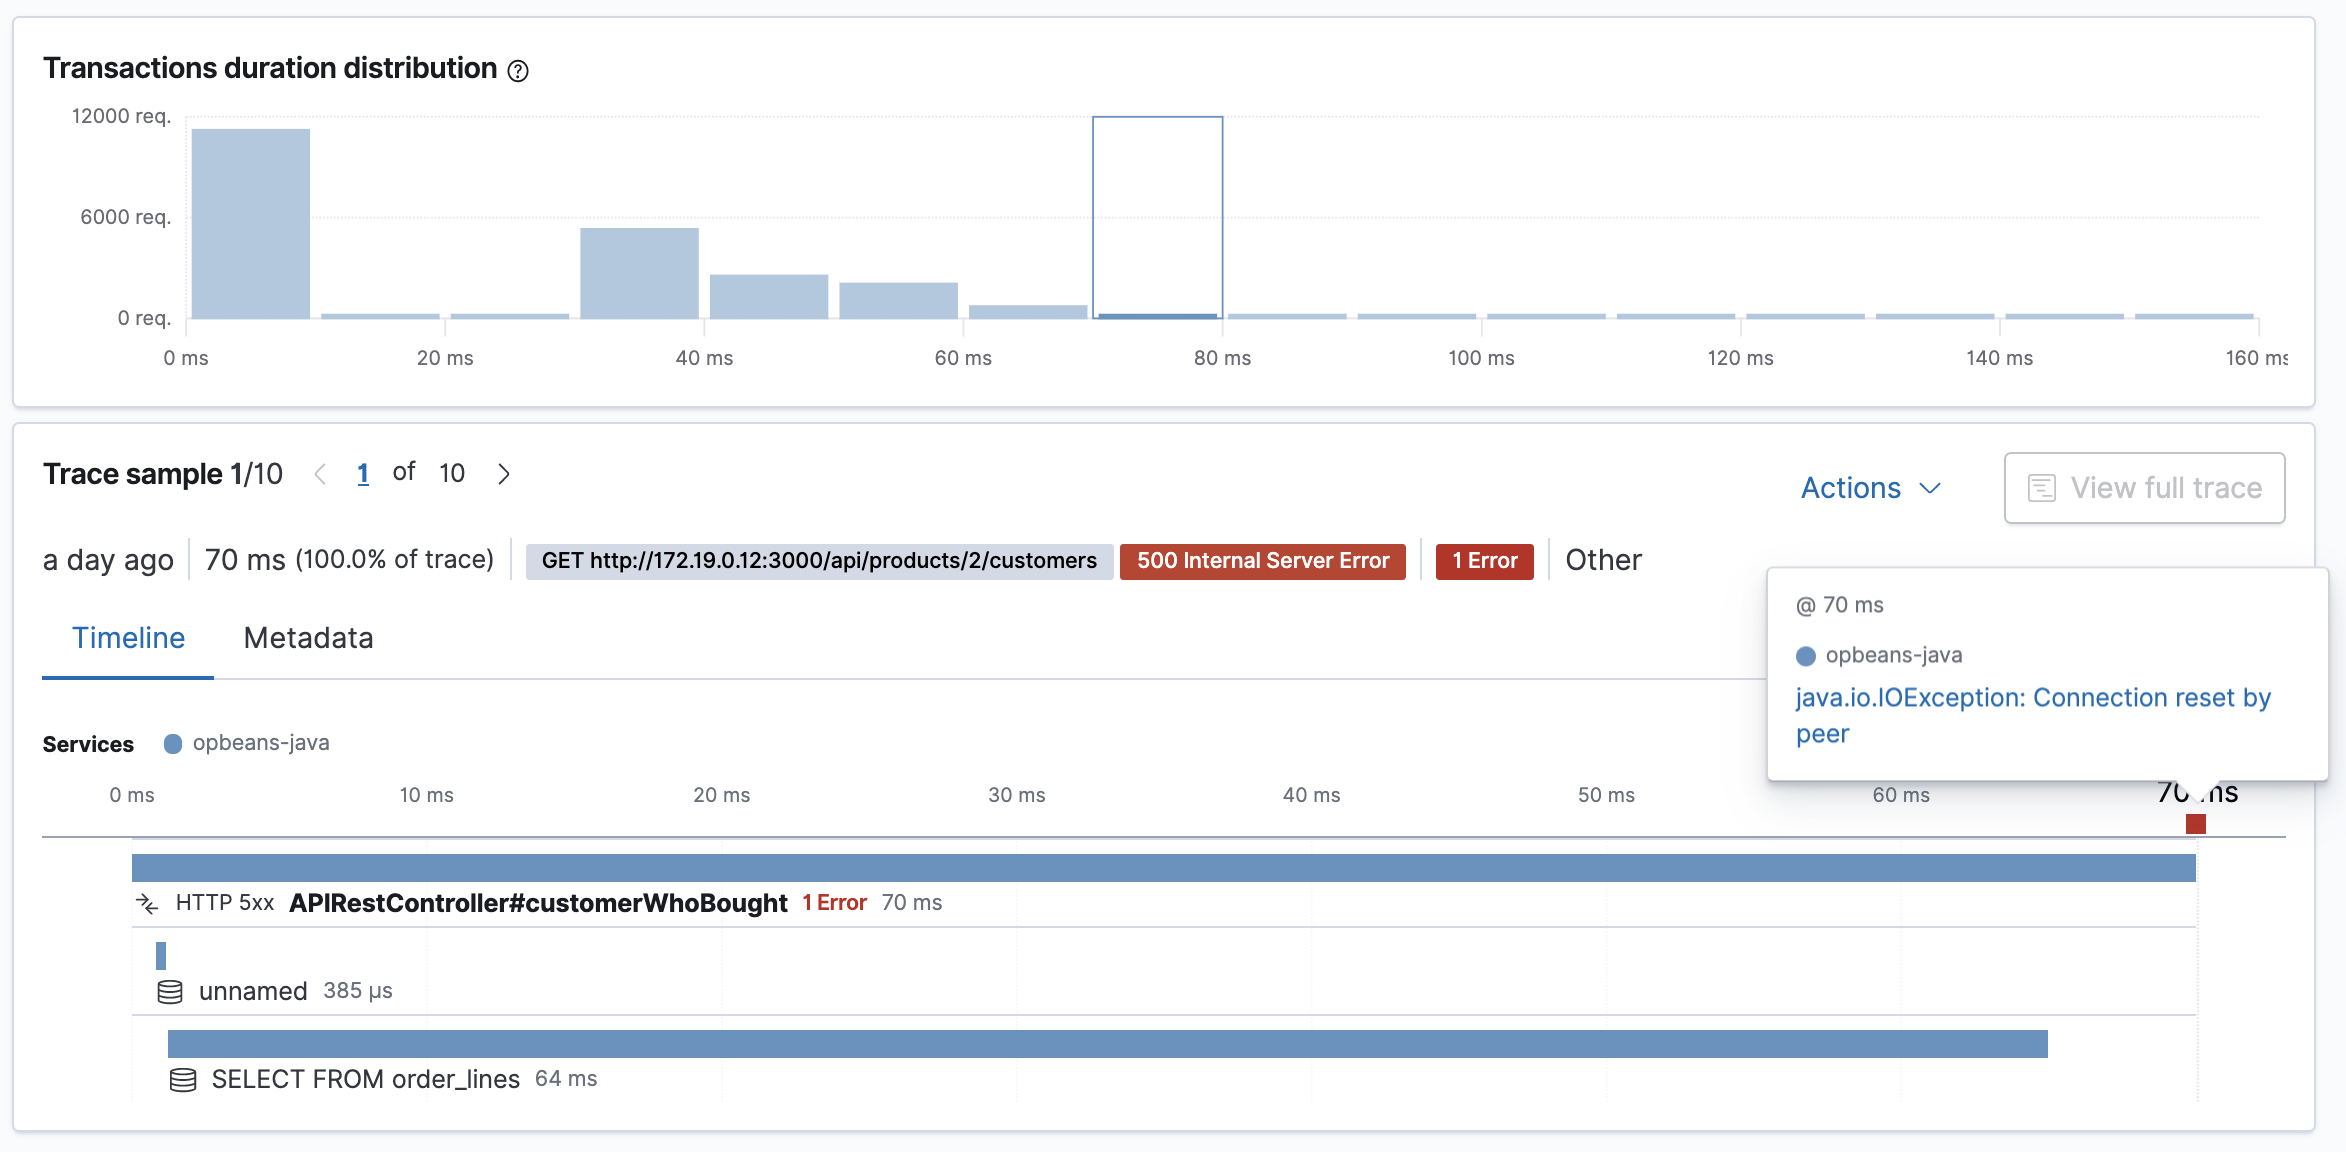
More information on timeline waterfalls is available in spans.
For a particular transaction sample, we can get even more information in the metadata tab:
- Labels - Custom labels added by agents
- HTTP request/response information
- Host information
- Container information
- Service - The service/application runtime, agent, name, etc..
- Process - The process id that served up the request.
- Agent information
- URL
- User - Requires additional configuration, but allows you to see which user experienced the current transaction.
- Custom - You can configure your agent to add custom contextual information on transactions.
All of this data is stored in documents in Elasticsearch. This means you can select "Actions - View sample document" to see the actual Elasticsearch document under the discover tab.