Use drilldowns for dashboard actions
editUse drilldowns for dashboard actions
editDrilldowns, also known as custom actions, allow you to configure a workflow for analyzing and troubleshooting your data. Using a drilldown, you can navigate from one dashboard to another, taking the current time range, filters, and other parameters with you, so the context remains the same. You can continue your analysis from a new perspective.
For example, you might have a dashboard that shows the overall status of multiple data centers. You can create a drilldown that navigates from this dashboard to a dashboard that shows a single data center or server.
How drilldowns work
editDrilldowns are user-configurable Kibana actions that are stored with the dashboard metadata. Drilldowns are specific to the dashboard panel for which you create them—they are not shared across panels. A panel can have multiple drilldowns.
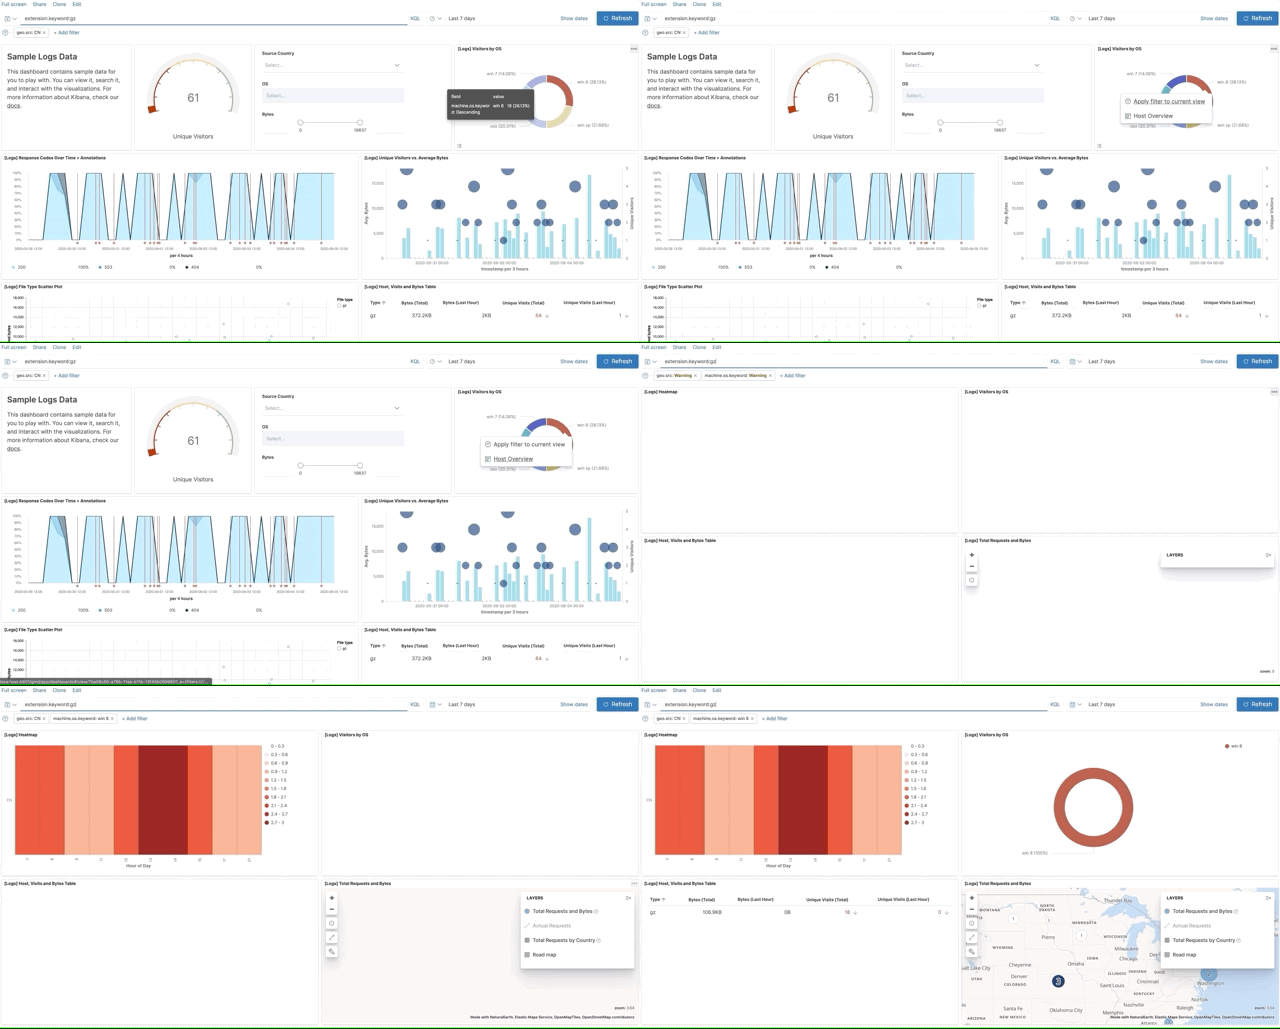
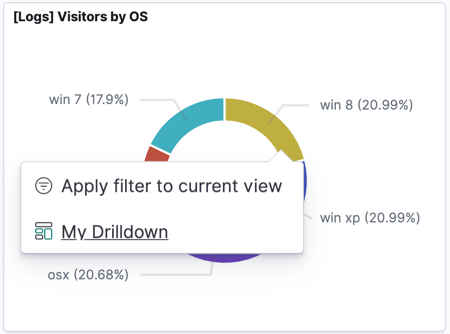
This example shows a dashboard panel that contains a pie chart. Typically, clicking a pie slice applies the current filter. When a panel has a drilldown, clicking a pie slice opens a menu with the default action and your drilldowns. Refer to the Try it section for instructions on how to create this drilldown.

Third-party developers can create drilldowns. Refer to this example plugin to learn how to code drilldowns.
Create and manage drilldowns
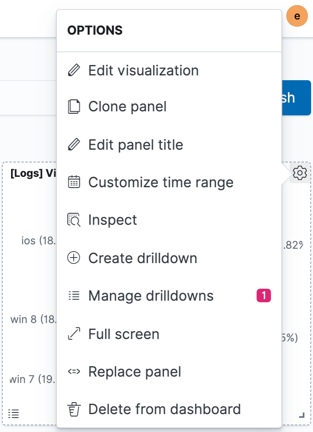
editYour dashboard must be in Edit mode to create a drilldown. Once a panel has at least one drilldown, the menu also includes a Manage drilldowns action for editing and deleting drilldowns.

Try it: Create a drilldown
editThis example shows how to create the Host Overview drilldown shown earlier in this doc.
Set up the dashboards
edit- Add the sample web logs data set.
-
Create a new dashboard, called
Host Overview, and include these visualizations from the sample data set:[Logs] Heatmap
[Logs] Visitors by OS
[Logs] Host, Visits, and Bytes Table
[Logs] Total Requests and BytesIf you don’t see data for a panel, try changing the time range.
- Open the [Logs] Web traffic dashboard.
-
Set a search and filter.
Search:
extension.keyword:( “gz” or “css” or “deb”)
Filter:geo.src : CN
Create the drilldown
edit- In the dashboard menu bar, click Edit.
- In [Logs] Visitors by OS, open the panel menu, and then select Create drilldown.
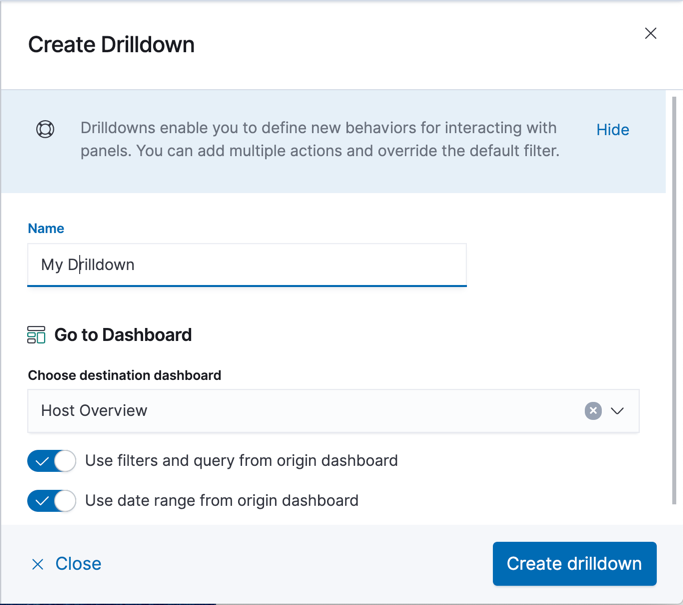
- Give the drilldown a name.
- Select Host Overview as the destination dashboard.
-
Keep both filters enabled so that the drilldown carries over the global filters and date range.
Your input should look similar to this:

- Click Create drilldown.
-
Save the dashboard.
If you don’t save the drilldown, and then navigate away, the drilldown is lost.
-
In [Logs] Visitors by OS, click the
win 8slice of the pie, and then select the name of your drilldown.
You are navigated to your destination dashboard. Verify that the search query, filters, and time range are carried over.