Create a dashboard
editCreate a dashboard
editTo create a dashboard, you must have data indexed into Elasticsearch, an index pattern to retrieve the data from Elasticsearch, and visualizations, saved searches, or maps. If these don’t exist, you’re prompted to add them as you create the dashboard, or you can add sample data sets, which include pre-built dashboards.
To begin, open the menu, go to Dashboard, then click Create dashboard.
Add elements
editThe visualizations, saved searches, and maps are stored as elements in panels that you can move and resize.
You can add elements from multiple indices, and the same element can appear in multiple dashboards.
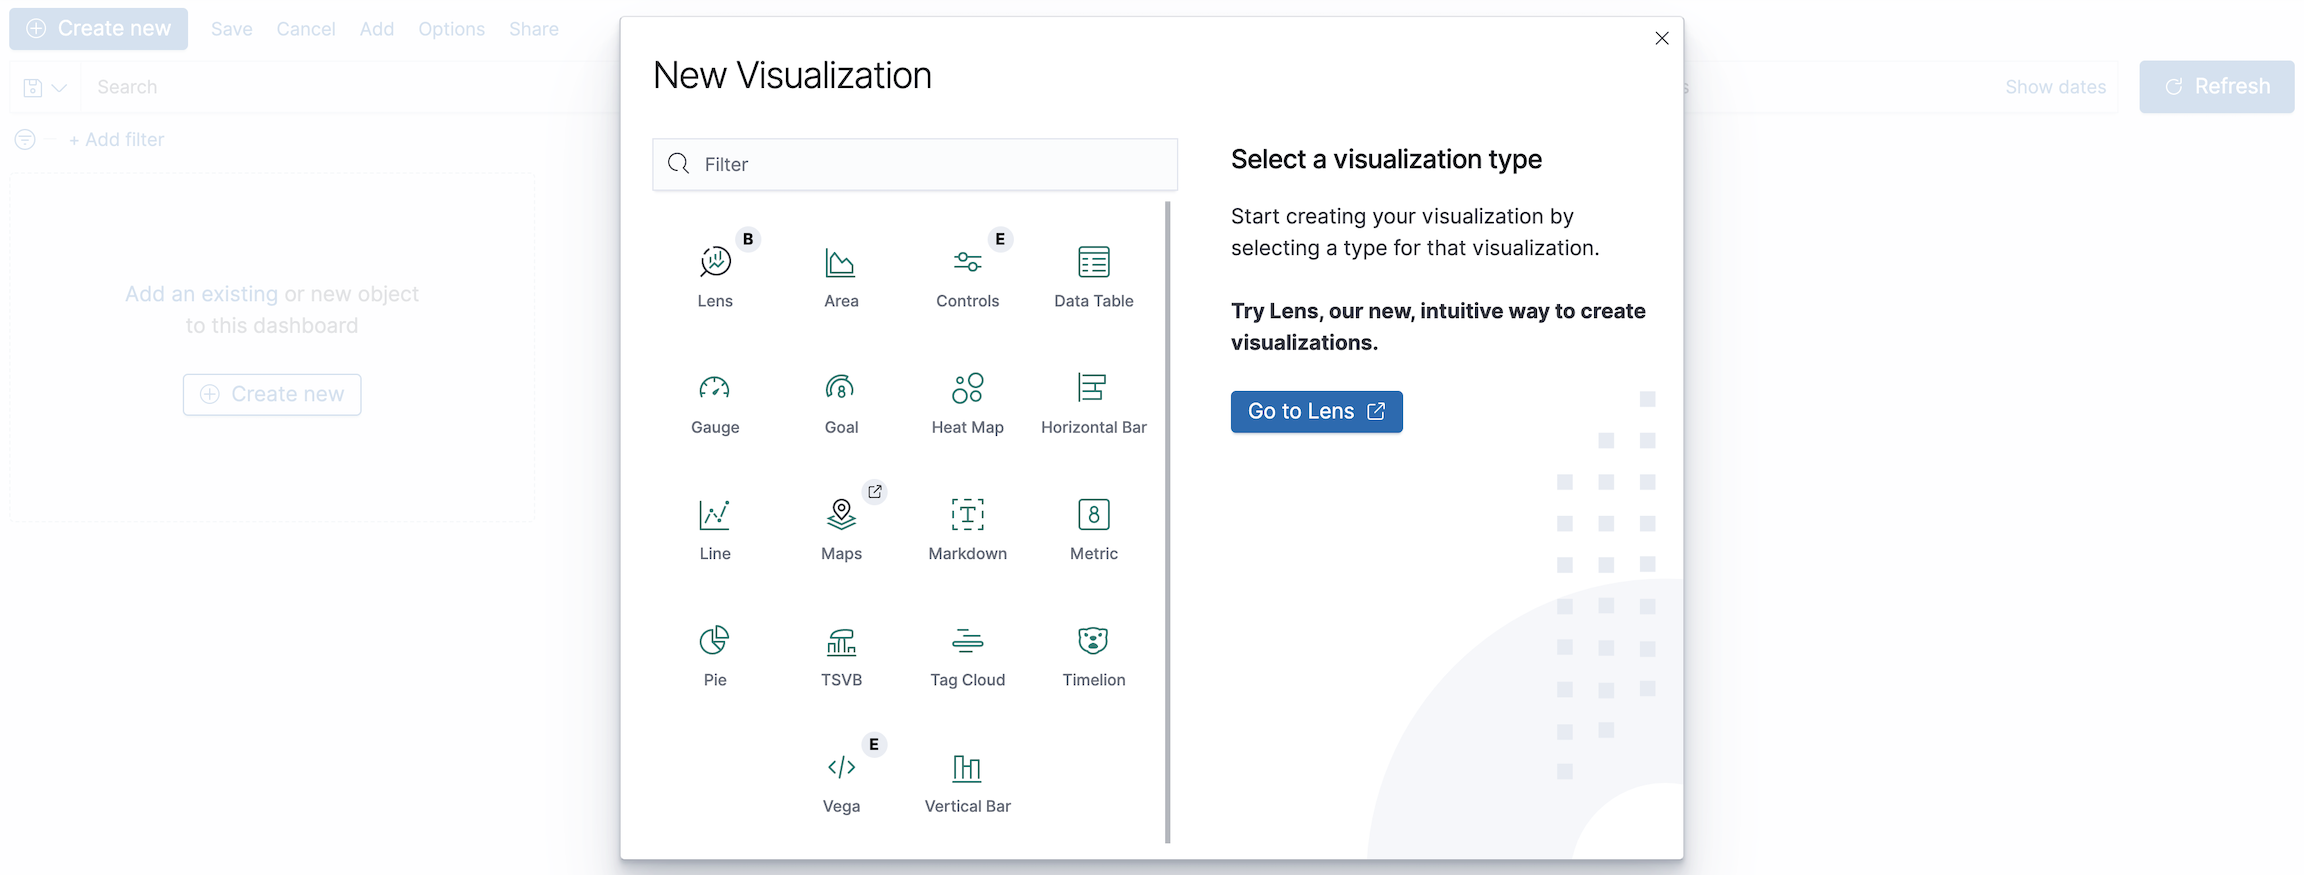
To create an element:
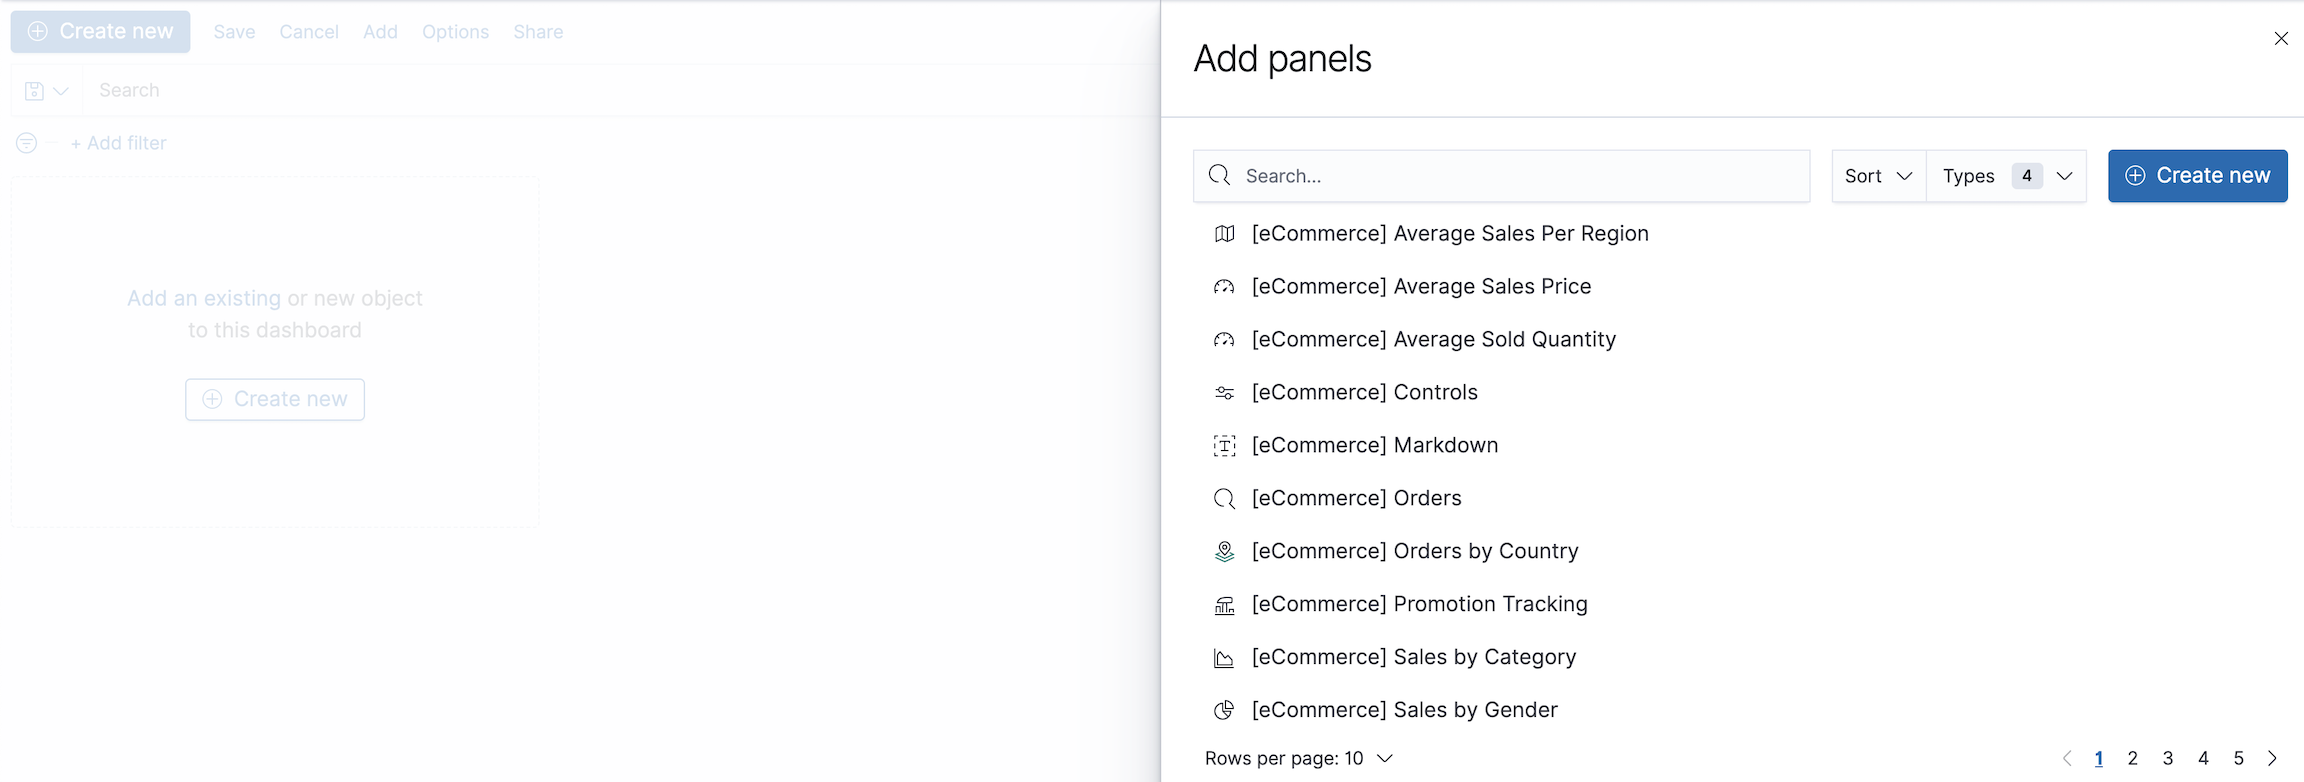
To add an existing element:
- Click Add.
-
On the Add panels flyout, select the panel.
When a dashboard element has a stored query, both queries are applied.
Arrange dashboard elements
editIn Edit mode, you can move, resize, customize, and delete panels to suit your needs.
- To move a panel, click and hold the panel header and drag to the new location.
- To resize a panel, click the resize control and drag to the new dimensions.
- To toggle the use of margins and panel titles, use the Options menu.
- To delete a panel, open the panel menu and select Delete from dashboard. Deleting a panel from a dashboard does not delete the saved visualization or search.
Clone dashboard elements
editIn Edit mode, you can clone any panel on a dashboard.
To clone an existing panel, open the panel menu of the element you wish to clone, then select Clone panel.
- Cloned panels appear beside the original, and will move other panels down to make room if necessary.
- Clones support all of the original panel’s functionality, including renaming, editing, and cloning.
- All cloned visualizations will appear in the visualization list.
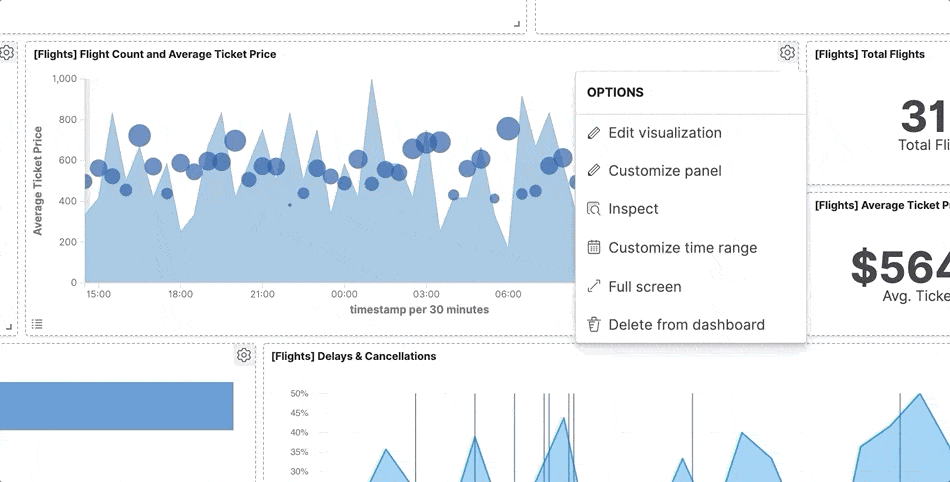
Inspect and edit elements
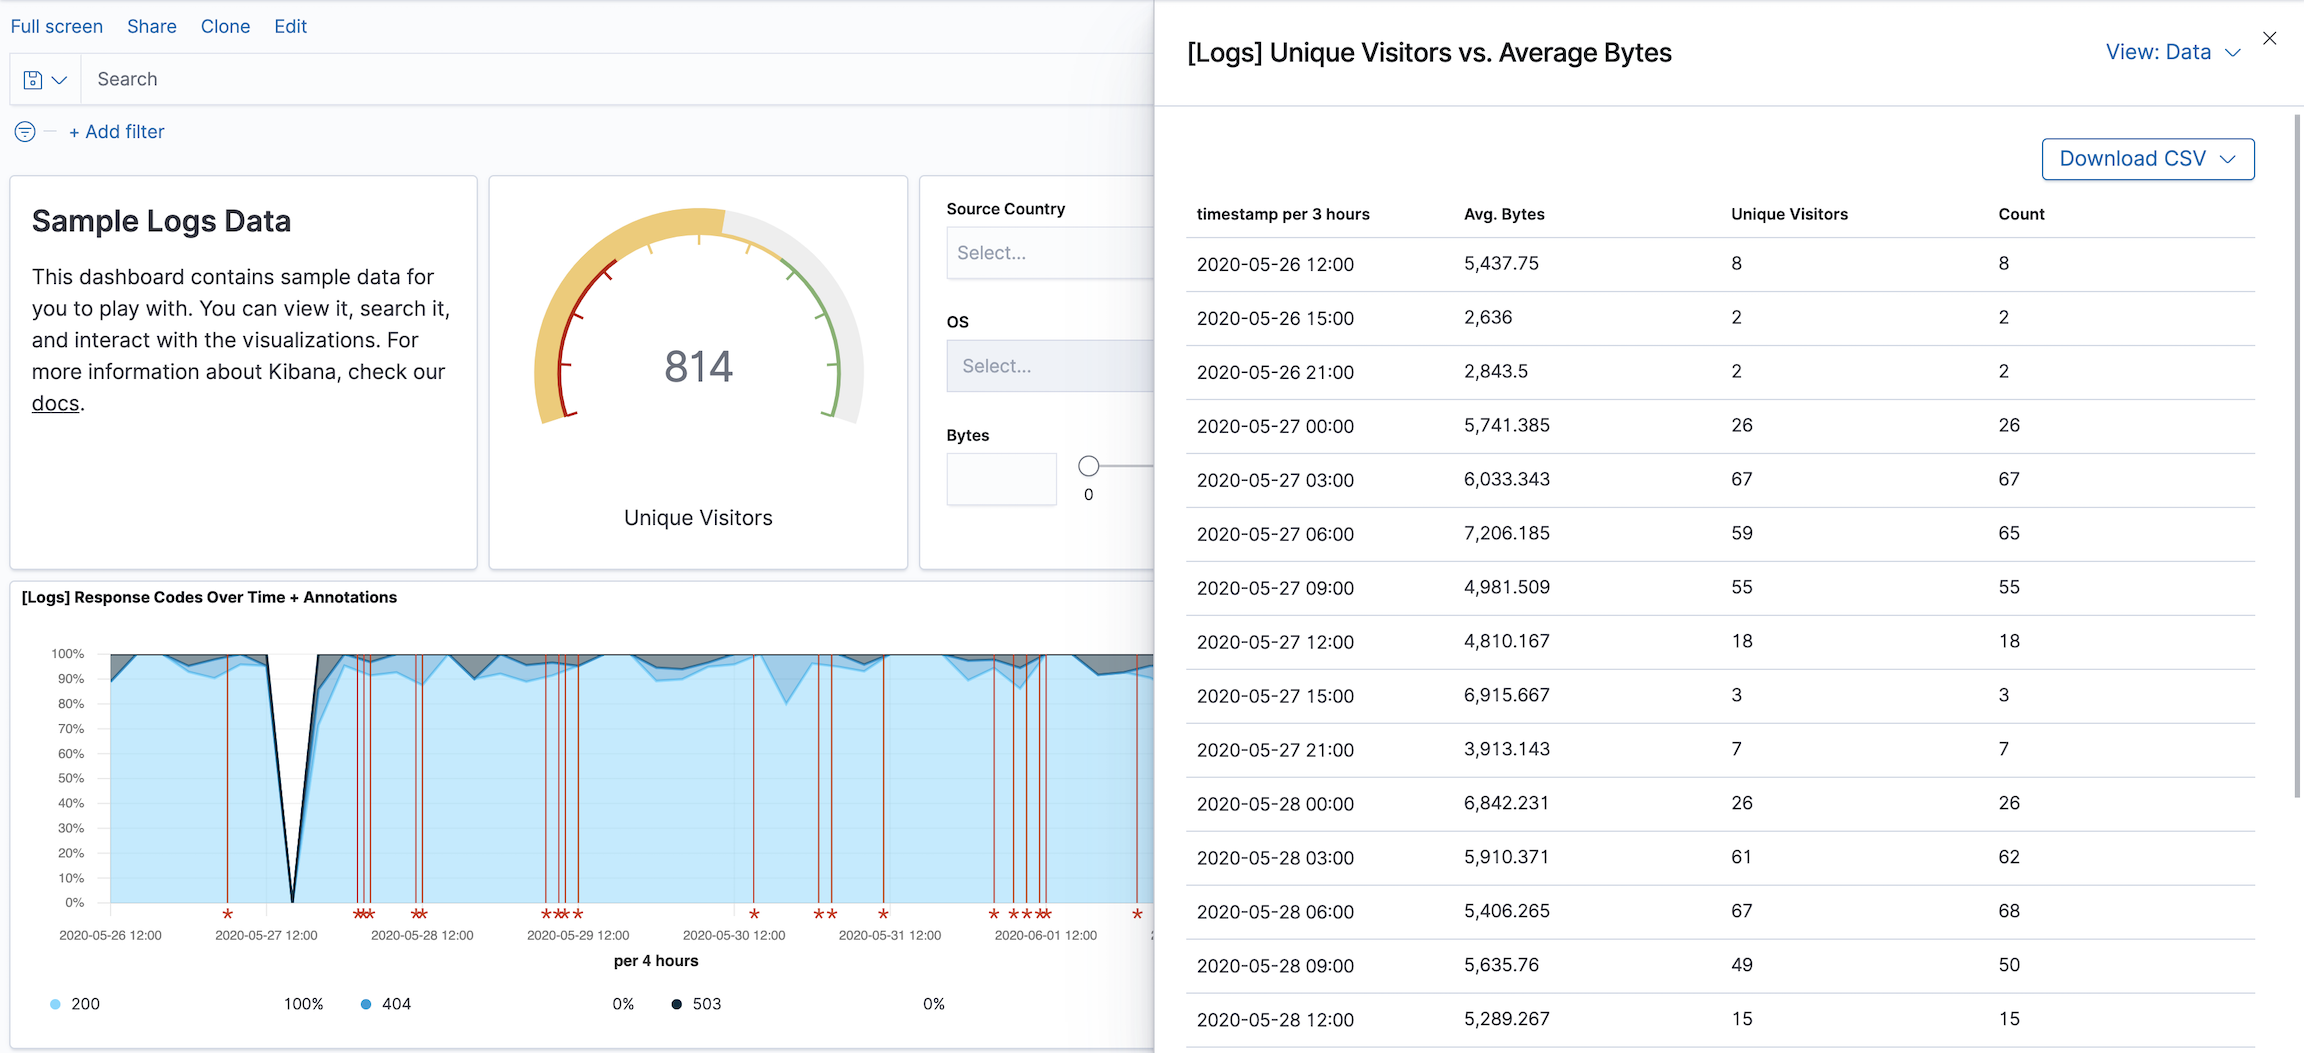
editMany dashboard elements allow you to drill down into the data and requests behind the element.
From the panel menu, select Inspect. The data that displays depends on the element that you inspect.
To open an element for editing, put the dashboard in Edit mode, and then select Edit visualization from the panel menu. The changes you make appear in every dashboard that uses the element.
Customize time ranges
editYou can configure each visualization, saved search, and map on your dashboard for a specific time range. For example, you might want one visualization to show the monthly trend for CPU usage and another to show the current CPU usage.
From the panel menu, select Customize time range to expose a time filter dedicated to that panel. Panels that are not restricted by a specific time range are controlled by the global time filter.
Save the dashboard
editWhen you’re finished adding and arranging the panels, save the dashboard.
- In the Kibana toolbar, click Save.
- Enter the dashboard Title and optional Description, then Save the dashboard.