What’s new in Kibana 7.8
editWhat’s new in Kibana 7.8
editHere are the highlights of what’s new and improved in 7.8. For detailed information about this release, check out the release notes and breaking changes.
Other versions: 7.7 | 7.6 | 7.5 | 7.4 | 7.3 | 7.2 | 7.1 | 7.0
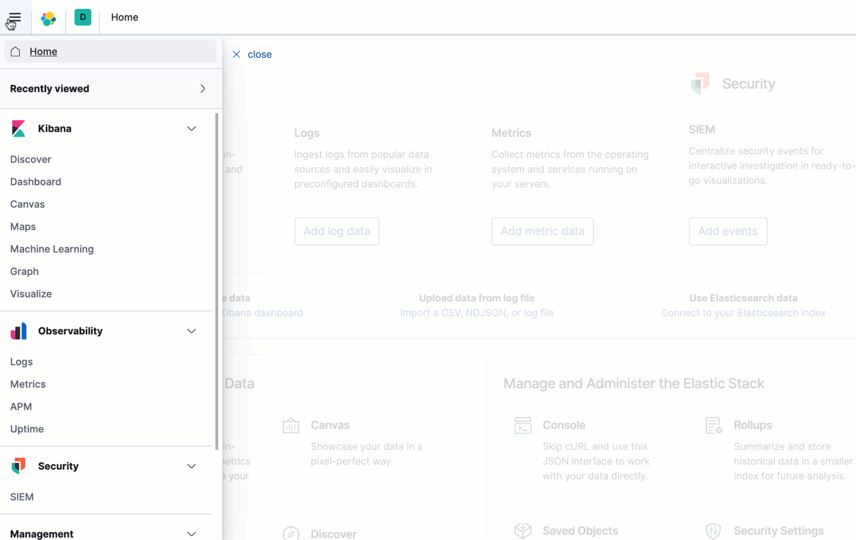
Side navigation organized by use cases
editKibana has a cleaner, more organized side navigation for getting you where you need to go. For example, when you’re ready to work with your logs, metrics, APM, or Uptime data, you’ll find the apps you need under Observability. The side navigation also includes Recently viewed to easily access previously opened apps.
Hidden by default, the sidebar is accessible with a single click on the hamburger menu. Use the Dock Navigation link at the bottom of the sidebar to keep the navigation visible.
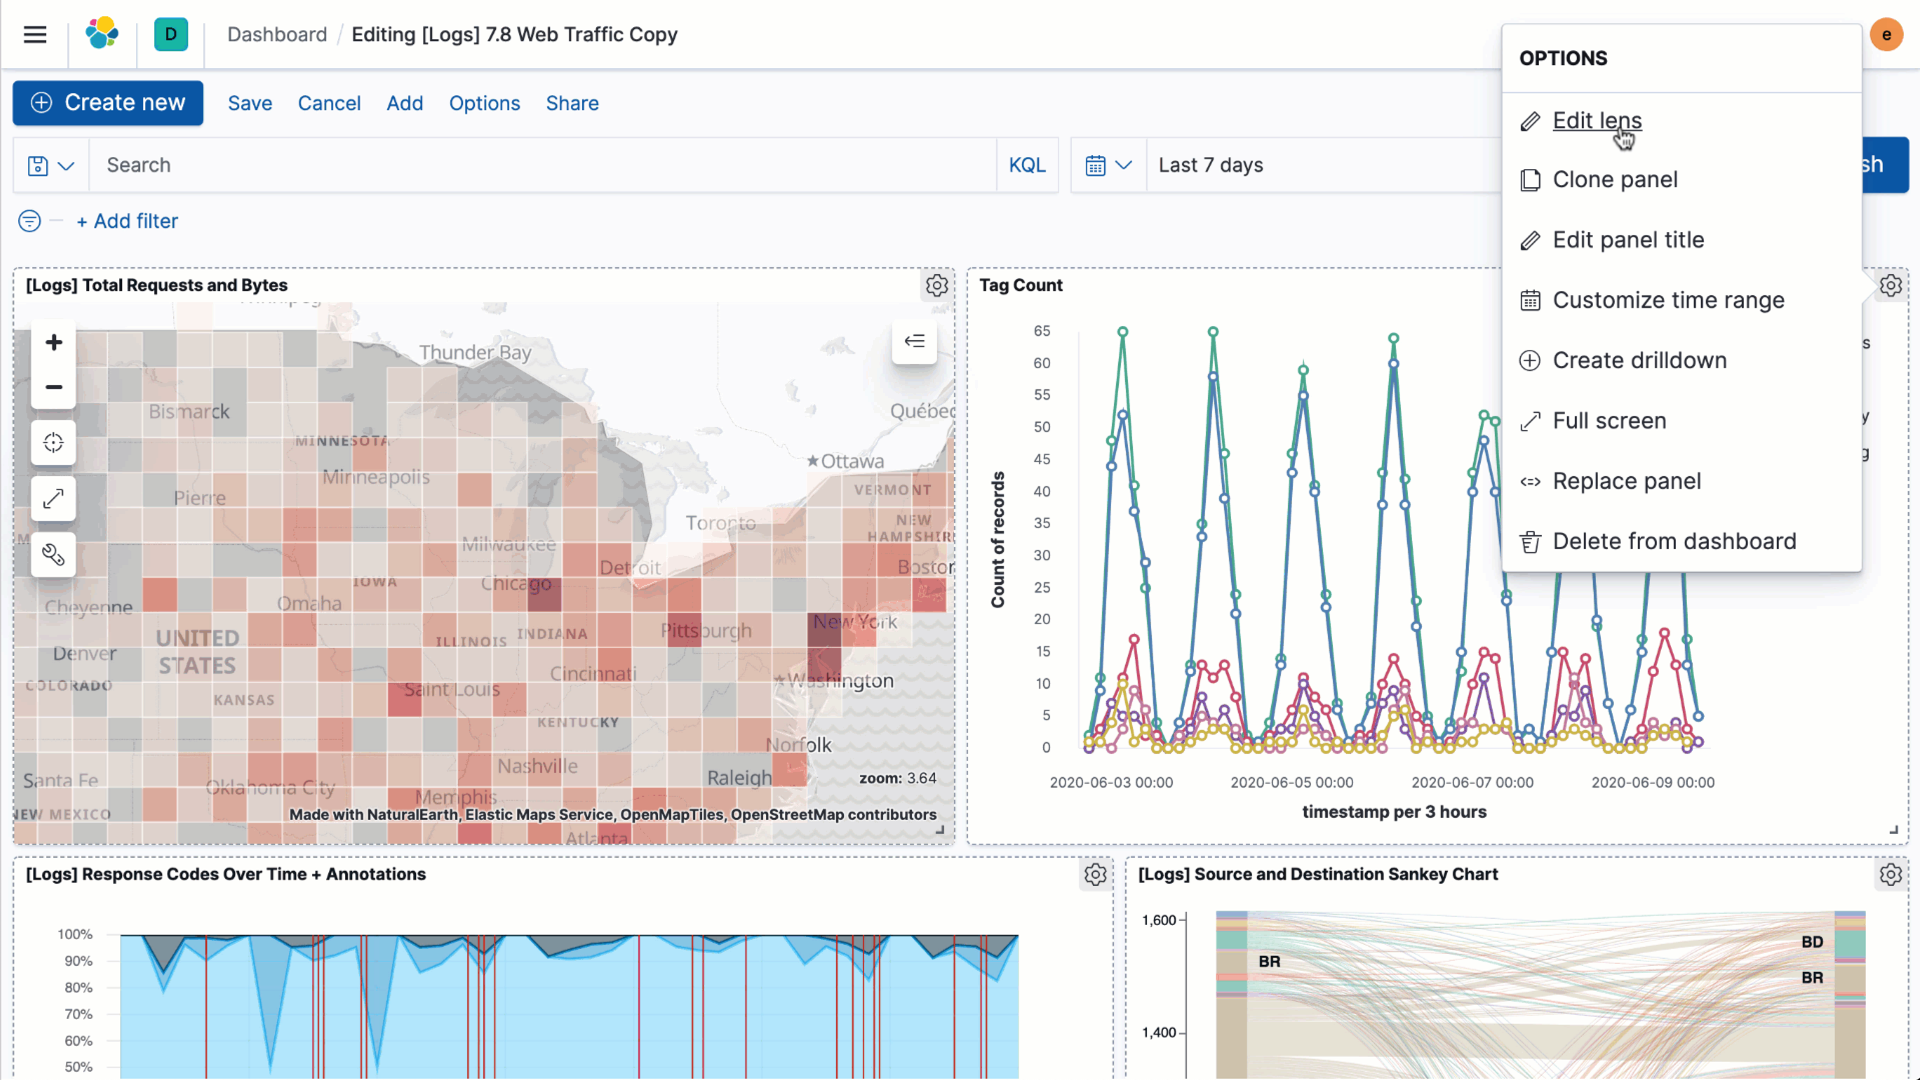
Dashboard-first experience
editIn 7.7, dashboards became a starting point for creating visualizations. Building on that experience, this release introduces a simplified workflow for editing a dashboard. You can now open the visualization editor directly from the dashboard, and then automatically return to the dashboard when you save the changes. This workflow keeps you focused on analyzing the data.
Dashboard-to-dashboard drilldowns
editWith 7.8, Kibana delivers drilldowns, which enable you to create custom navigation paths between dashboards. Drilldowns work well when you have multiple dashboards that support different audiences or provide different levels of analysis. For example, you might have a dashboard that shows the overall status of multiple data centers, and then create a drilldown that navigates to a dashboard for a single data center. Drilldown paths are available to all users who view the dashboard.
Cloning of dashboard elements
editKibana now lets you create an identical copy of any panel on the dashboard. You can modify the visualization in the new panel as needed, and then save your changes. Cloning enables you to quickly view your data from a new perspective.
New visualizations for Lens
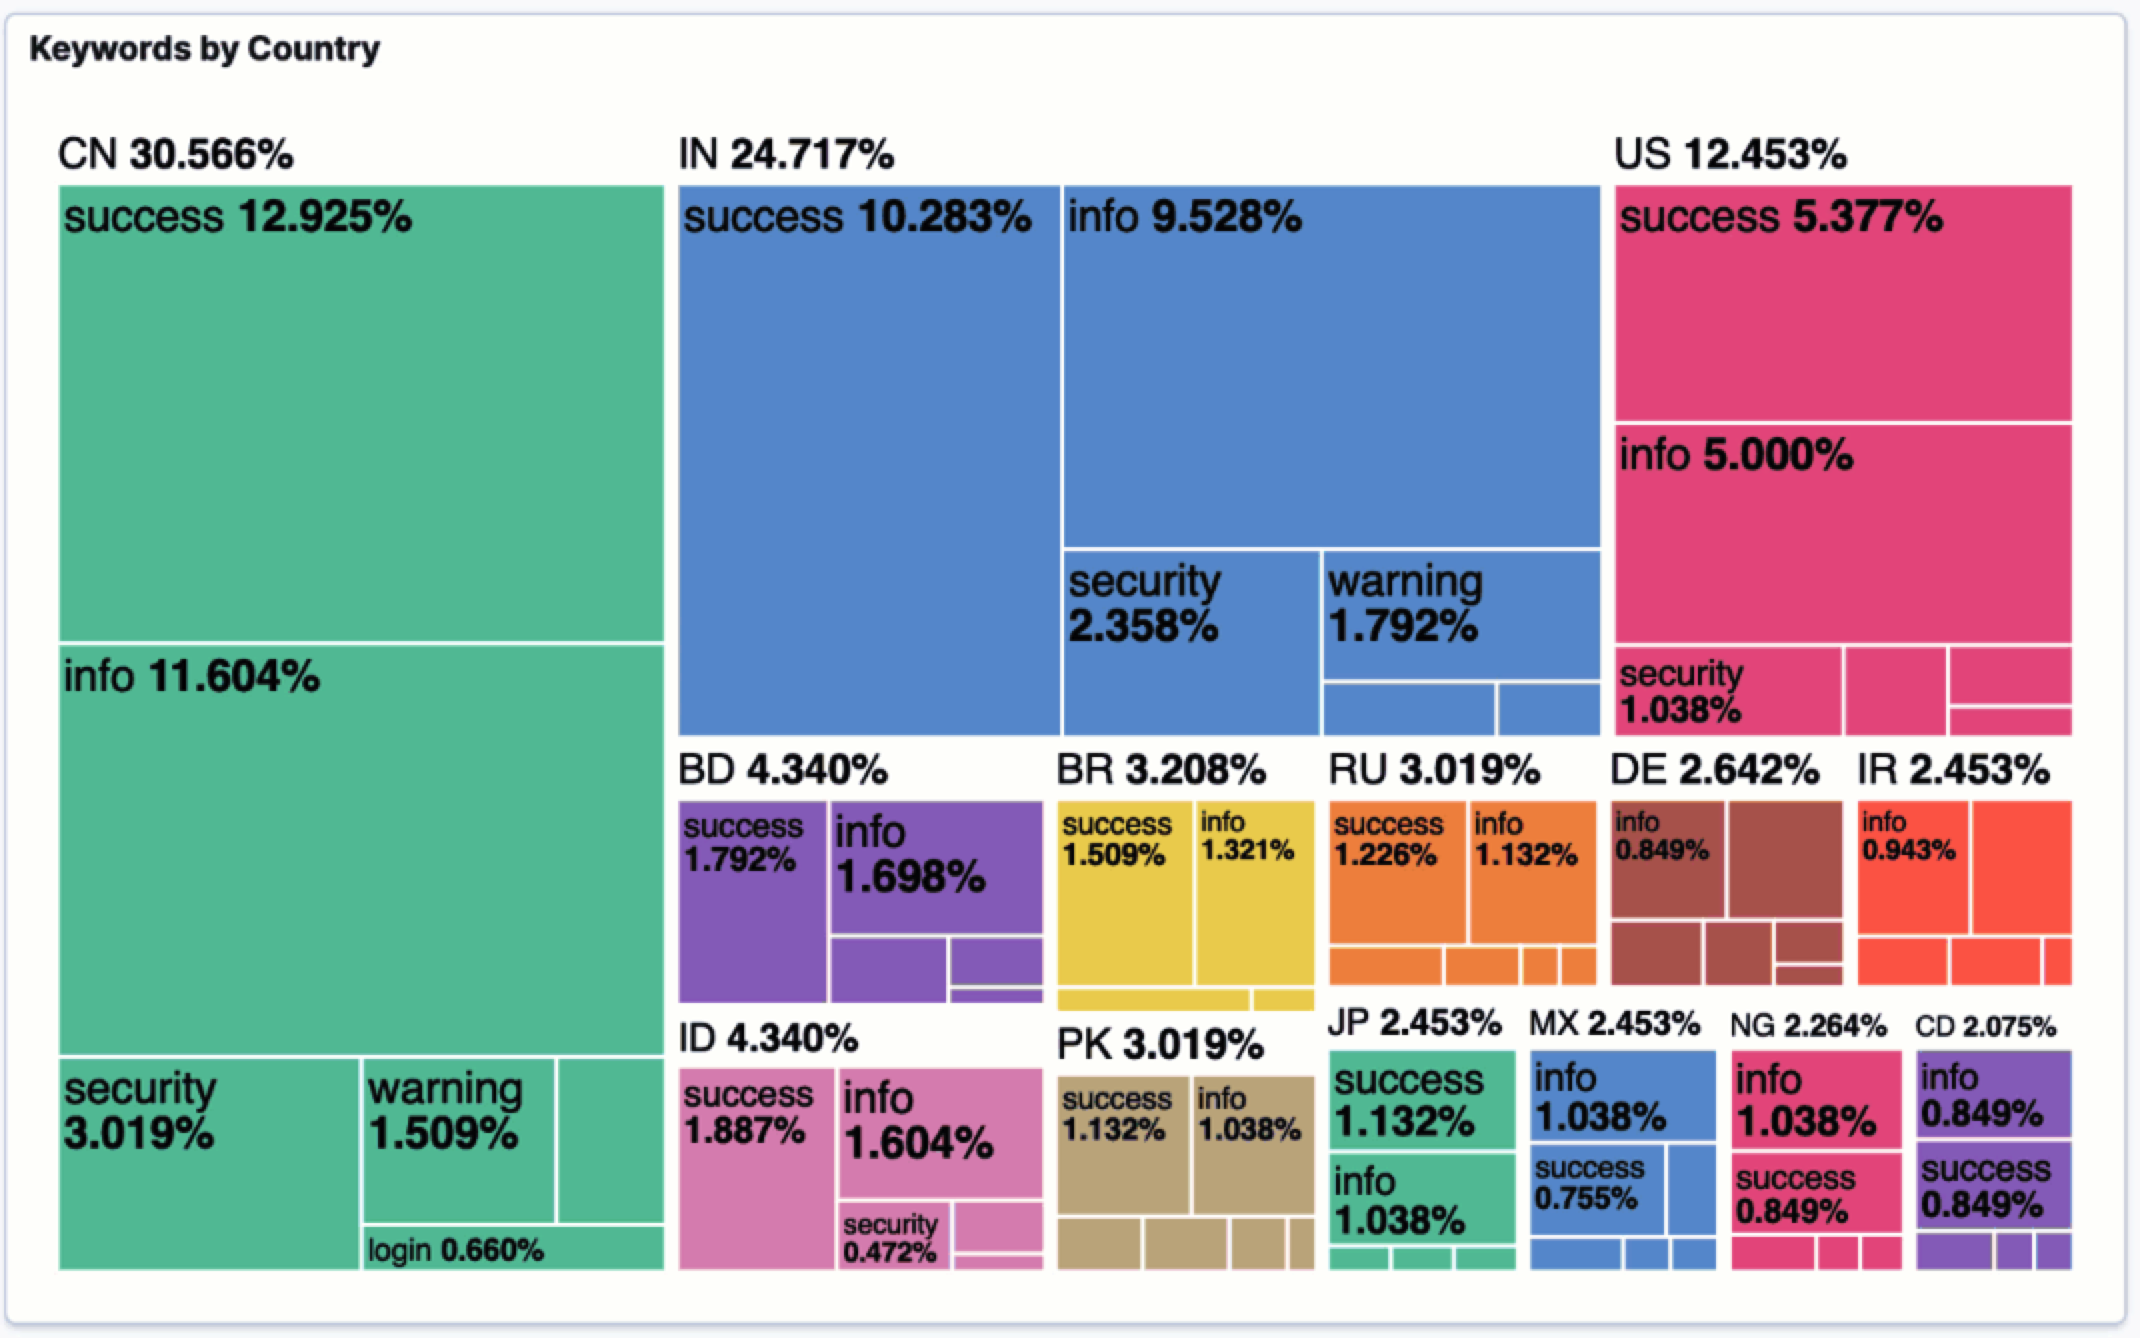
editLens introduces three new visualization types: pie chart, donut chart, and treemap. New to Kibana, treemaps provide a hierarchical view of your data and are good for visualizing part-to-whole relationships.
Menu updates for Canvas
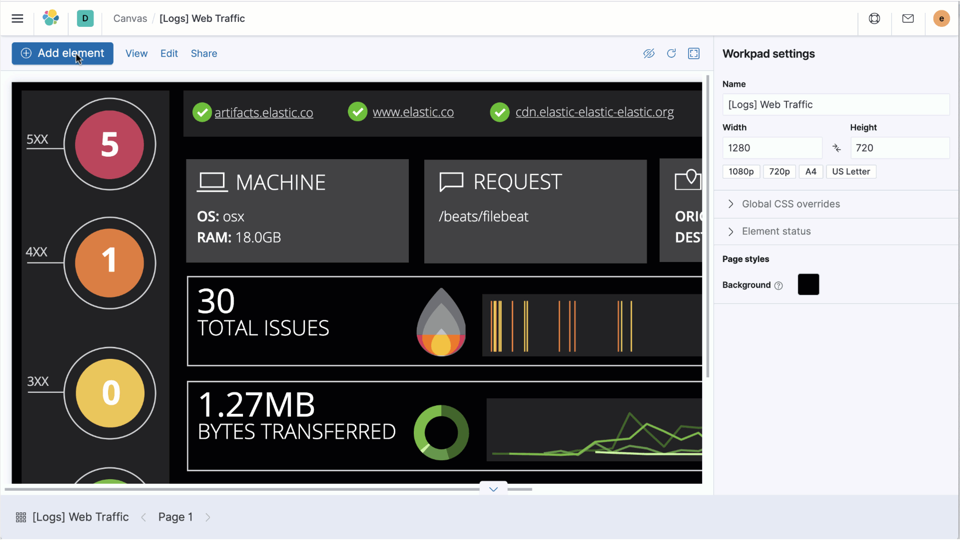
editCanvas has a new top-level menu that makes it easier for you to find the options to create, customize, and share your workpads.
Dedicated solution layer for Maps
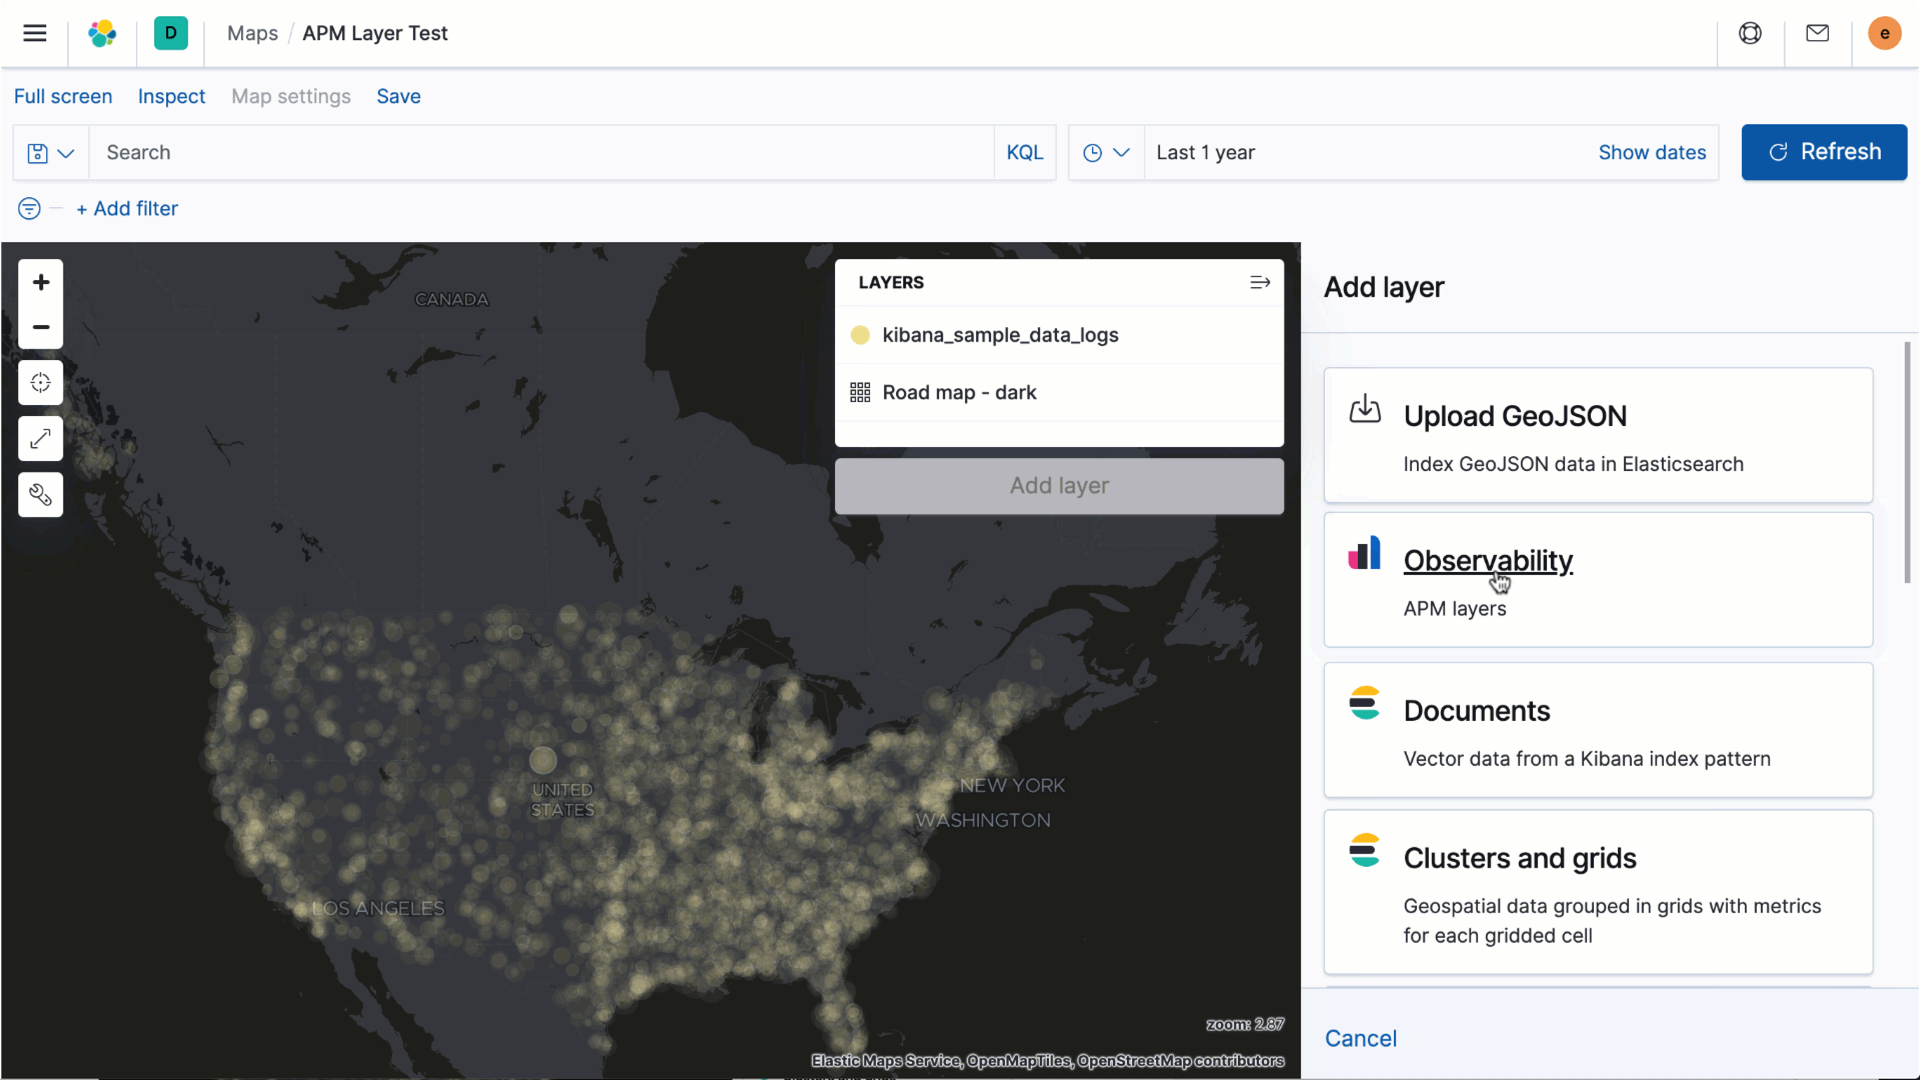
editMaps has a new Observability layer that supports real user monitoring (RUM) data. You’re presented with the Observability option if you have APM indices in the Elastic Common Schema. You can then select either APM RUM Performance or APM RUM Traffic, and Maps overlays that layer on your geoanalysis.
Ingest Node Pipelines builder
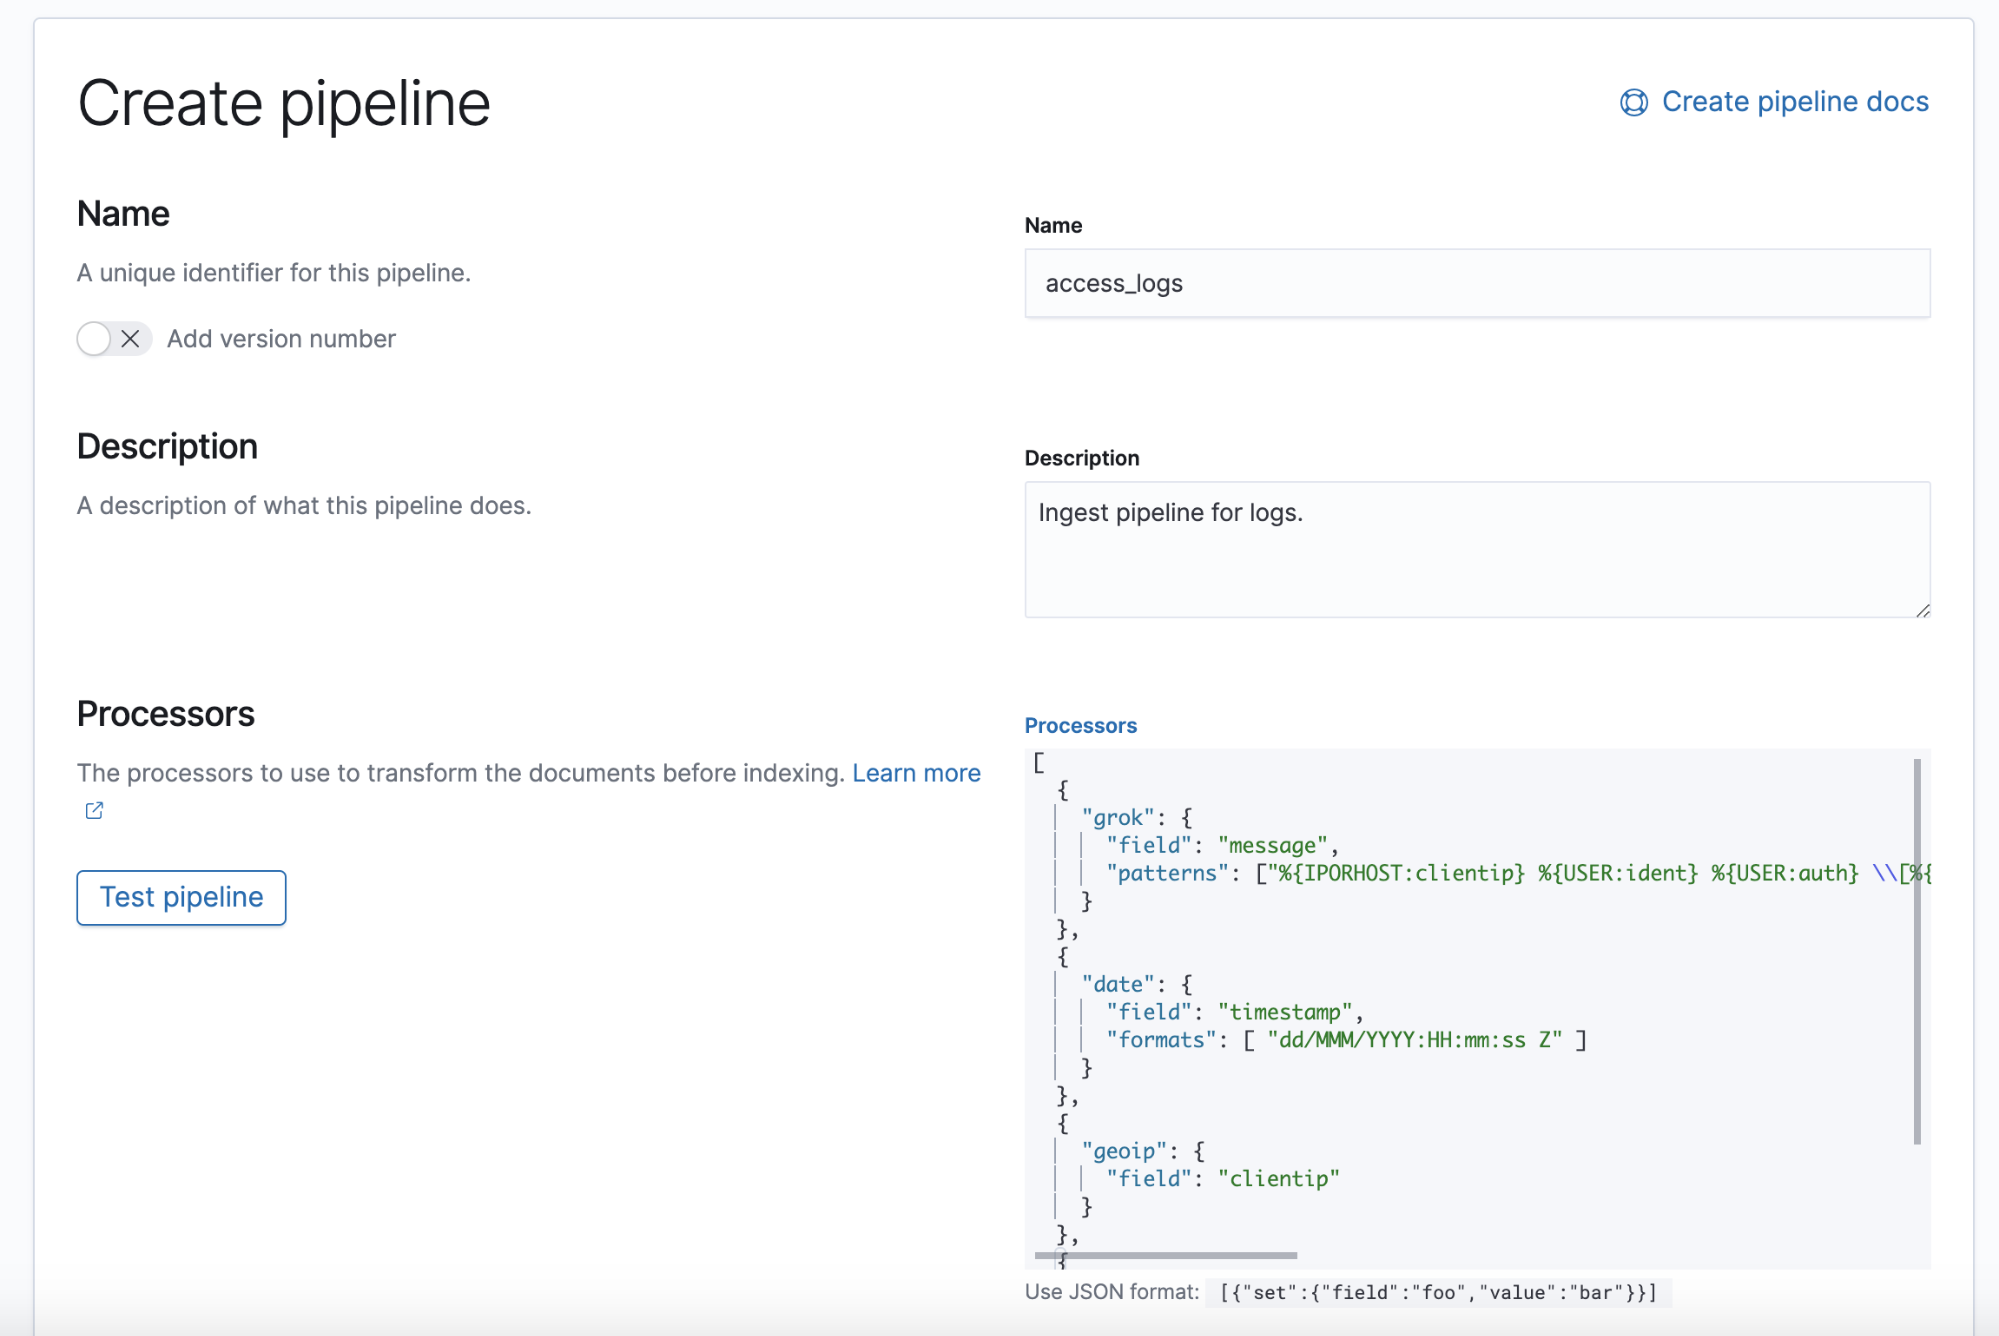
editIngesting data into the Elastic Stack is easier with the new Ingest Node Pipelines builder. This UI shows all your data piplelines in a single view and enables you to drill down into details. You can create a pipeline and define the tasks it performs, such as renaming an existing field or setting a new field. You can also test how a pipeline and its processors transform data before putting it into production.
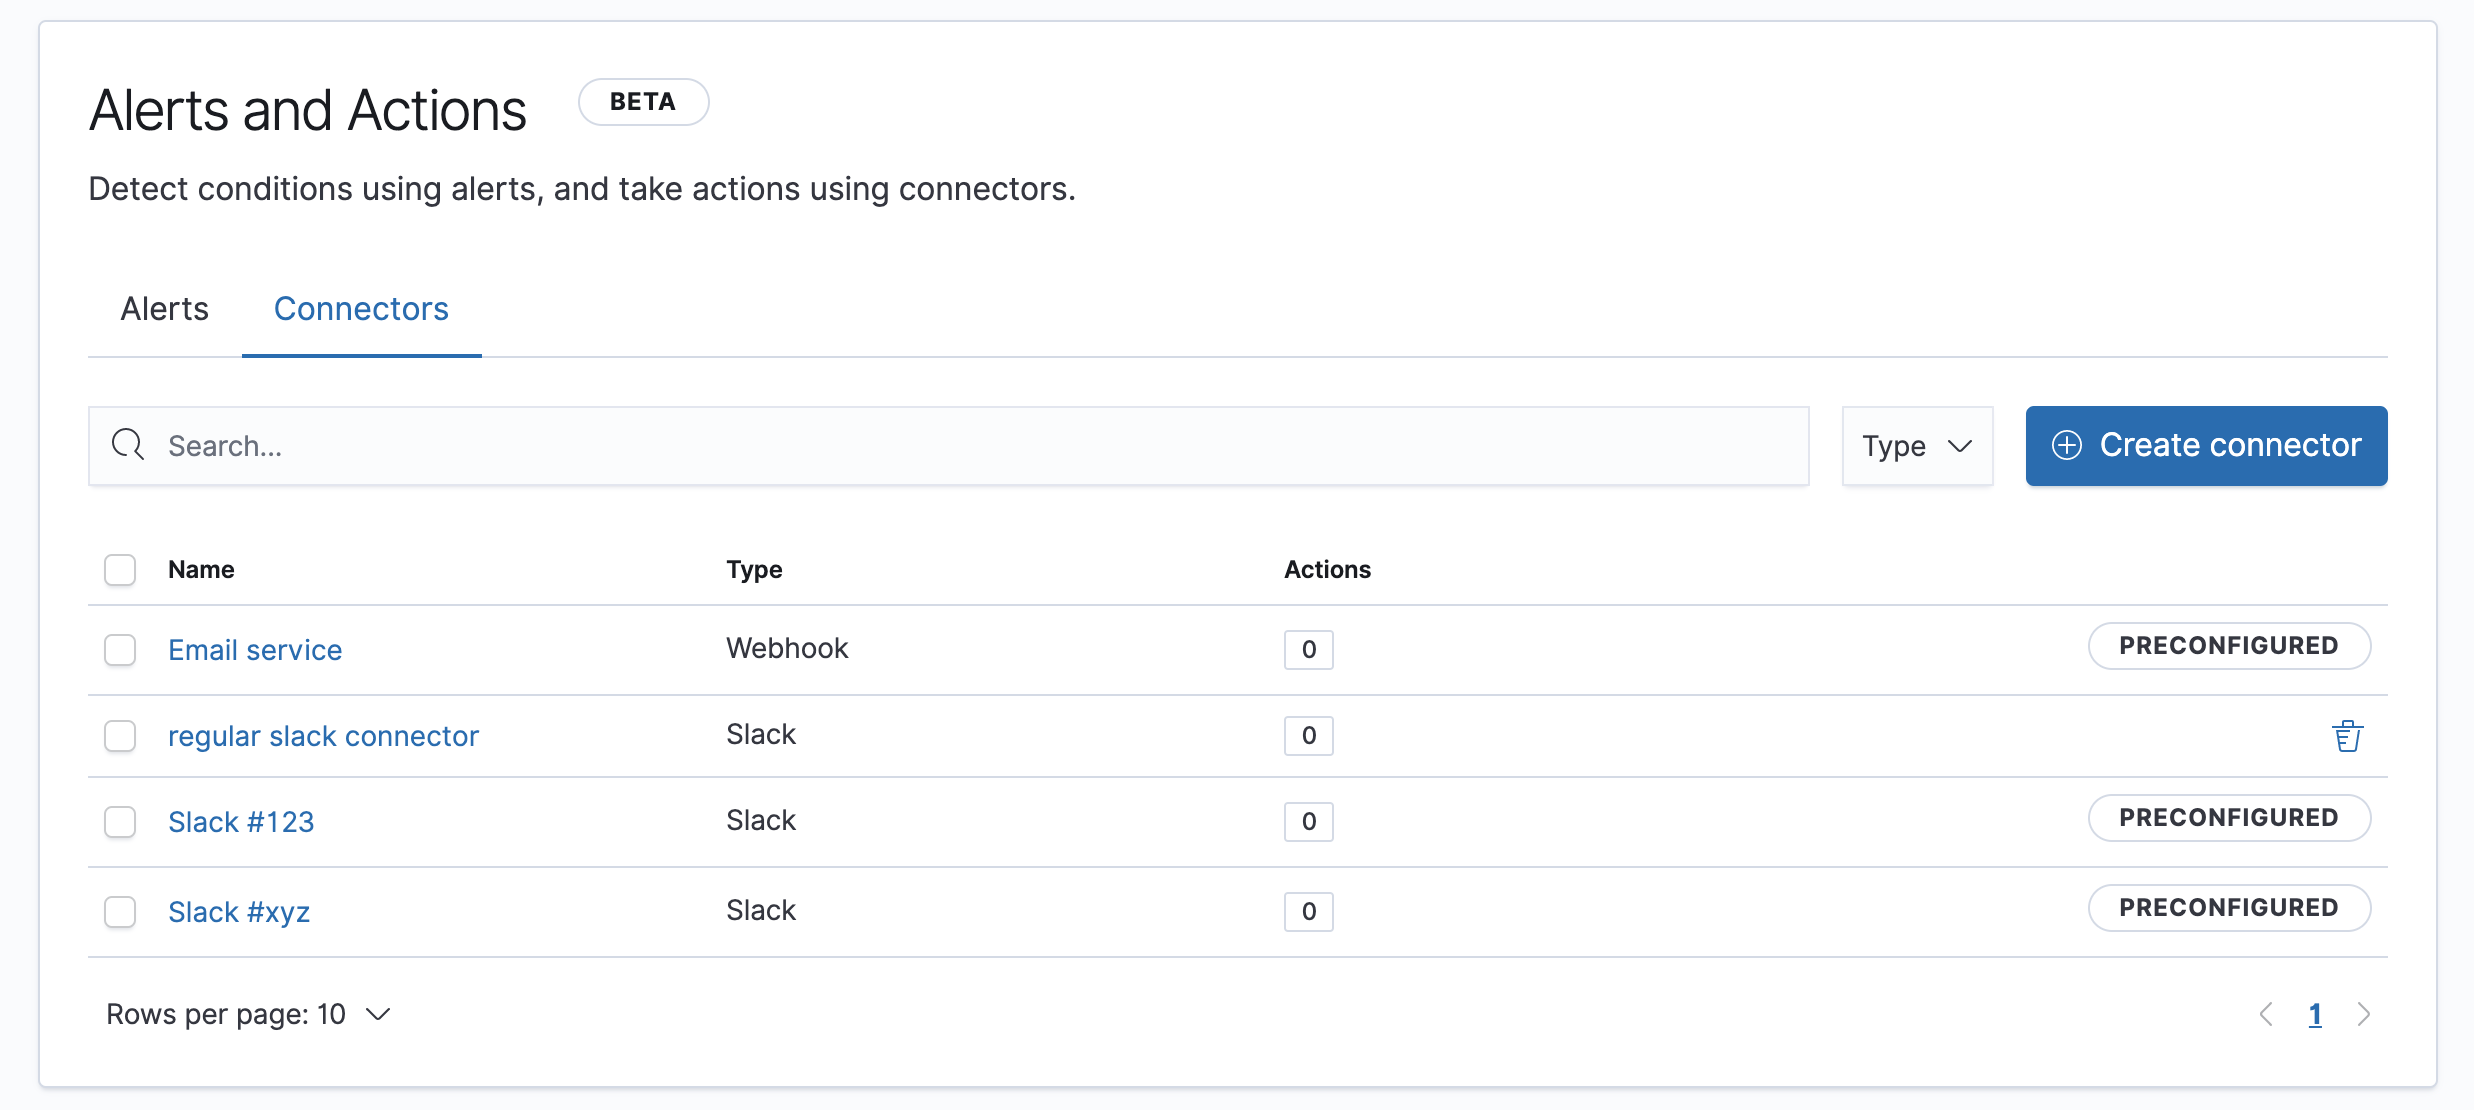
Preconfigured connectors for alerting
editIn 7.7, Kibana introduced a new system for handing alerts, and this release adds support for preconfigured connectors, which automatically start up with Kibana. This capability enables you to pre-plumb alert connections directly into Slack channels and designated email services. Preconfigured connectors are available in every Kibana space, and require no additional configuration after initialization.
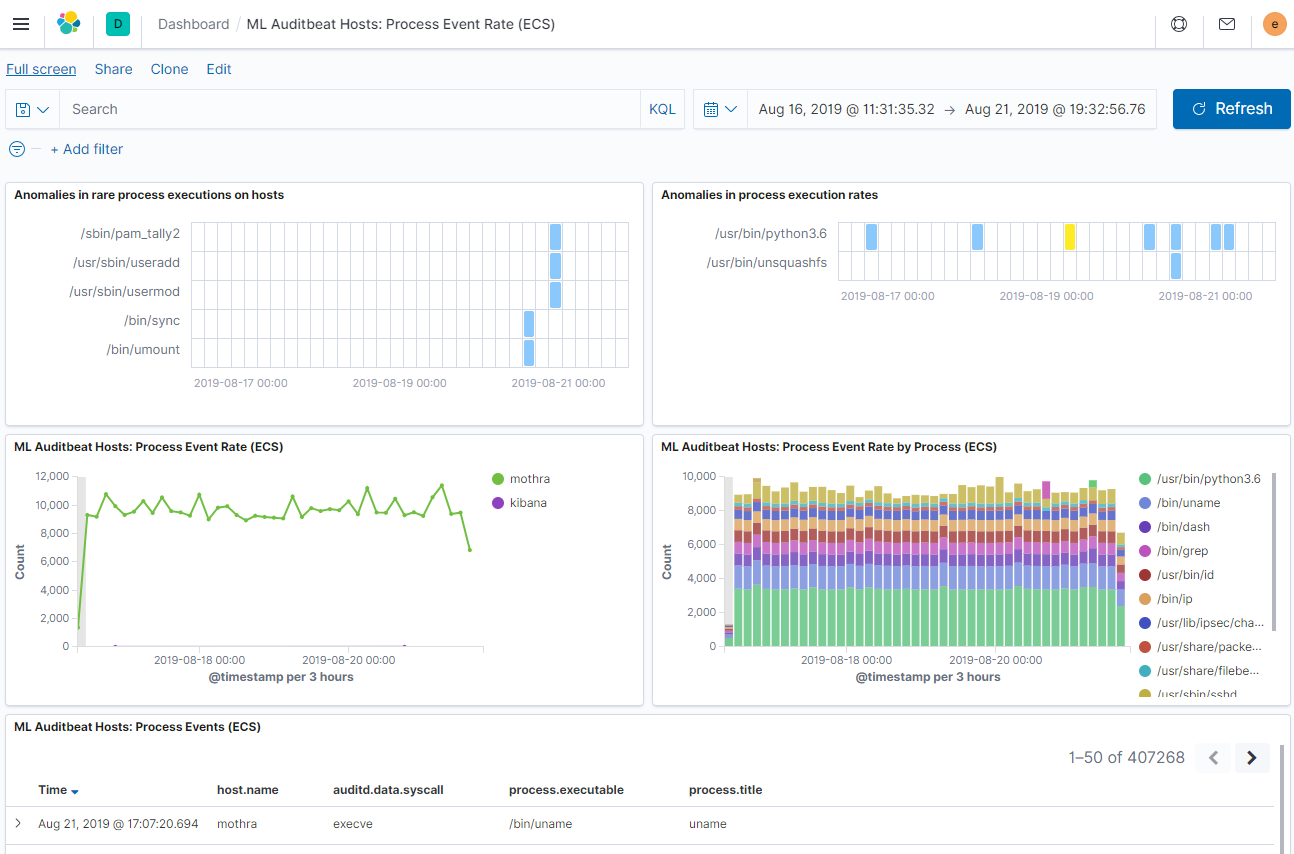
Embeddable machine learning swim lanes
editIn 7.8, you can view anomalies alongside your source data in a Kibana dashboard with embedded swim lanes. From the Add panel menu, you can select the jobs of interest, decide whether to view an overall score or split by job or influencer, and choose the number of lanes to display.
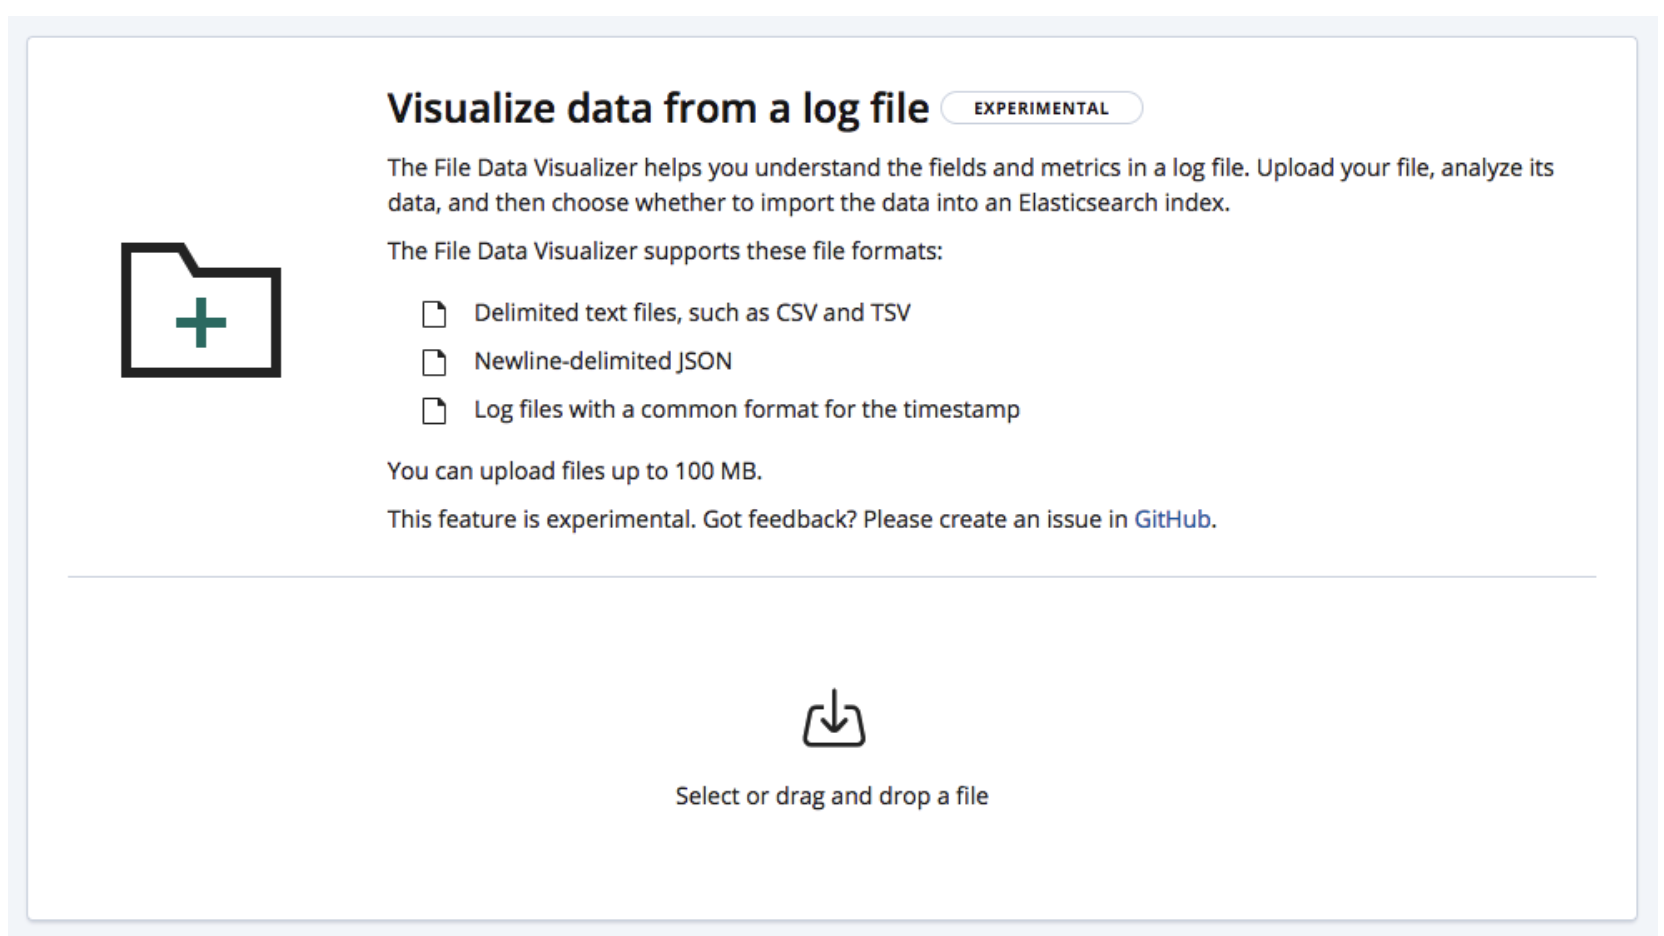
Increased limit for file upload
editThe upload limit for the File Data Visualizer increased from 100 MB to 1 GB, so you can now upload larger CSV, JSON, and log files. To configure this value, go to Advanced Settings.
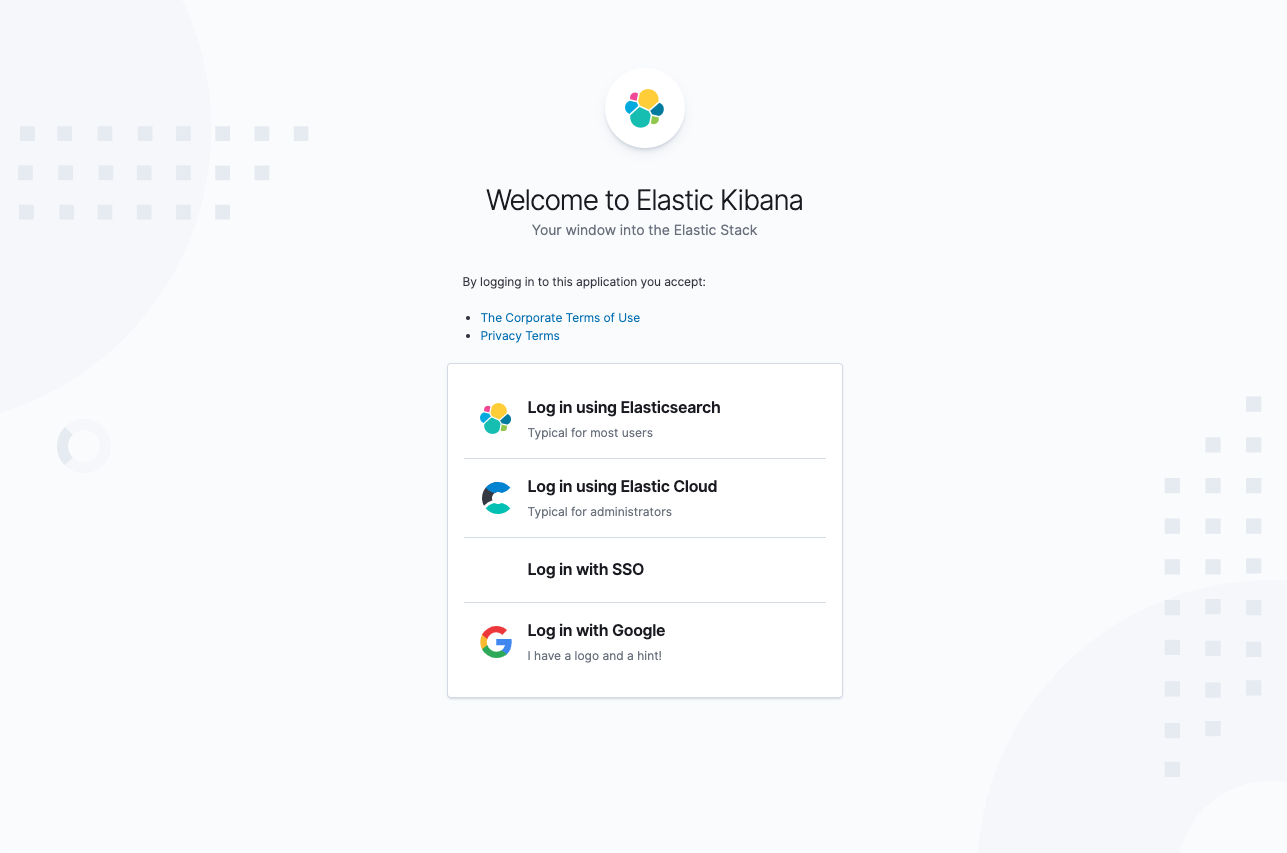
Customization of login experience
editKibana now offers two ways to customize the login experience. Before starting Kibana, you can show a screen specific to your requirements, for example, if users must agree to certain terms and conditions. You can also modify the login screen: edit the text for password hints, customize the icons for SSO options, and add messages and prompts.
Give 7.8 a try
editTry 7.8 now by deploying Elasticsearch and Kibana on Elastic Cloud or by downloading them. Let us know what you think on Twitter (@elastic) or in our forum.