Maps
editMaps
editMaps enables you to parse through your geographical data at scale, with speed, and in real time. With features like multiple layers and indices in a map, plotting of raw documents, dynamic client-side styling, and global search across multiple layers, you can understand and monitor your data with ease.
With Maps, you can:
- Create maps with multiple layers and indices.
- Upload GeoJSON files into Elasticsearch.
- Embed your map in dashboards.
- Symbolize features using data values.
- Focus in on just the data you want.
Ready to get started? Start your tour of Maps with the getting started tutorial.
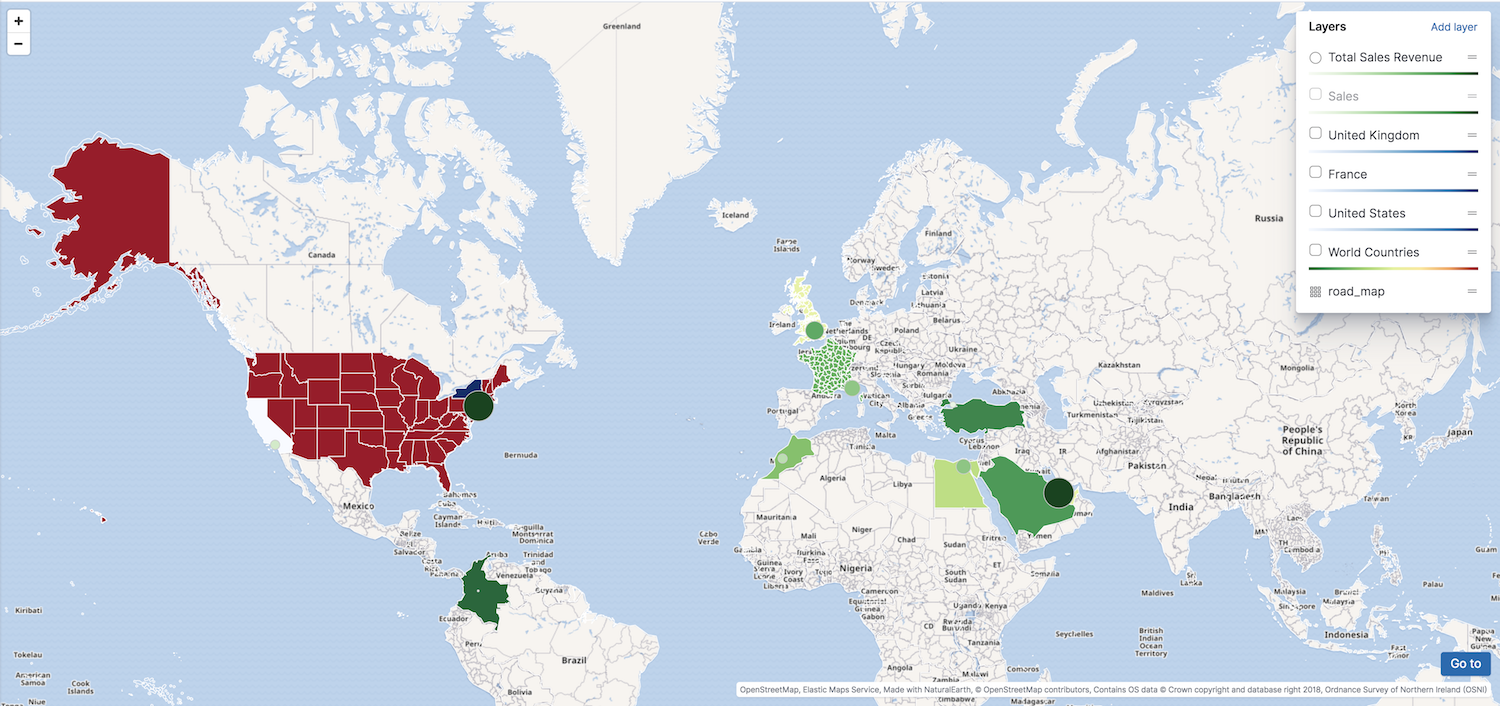
Create maps with multiple layers and indices
editYou can use multiple layers and indices to show all your data in a single map. This enables your map to show how data sits relative to physical features like weather patterns, human-made features like international borders, and business-specific features like sales regions. You can plot individual documents or use aggregations to plot any data set, no matter how large.
Upload GeoJSON files into Elasticsearch
editMaps makes it easy to import geospatial data into the Elastic Stack. Using the GeoJSON Upload feature, you can drag and drop your point and shape data files directly into Elasticsearch, and then use them as layers in the map.
Embed your map in dashboards
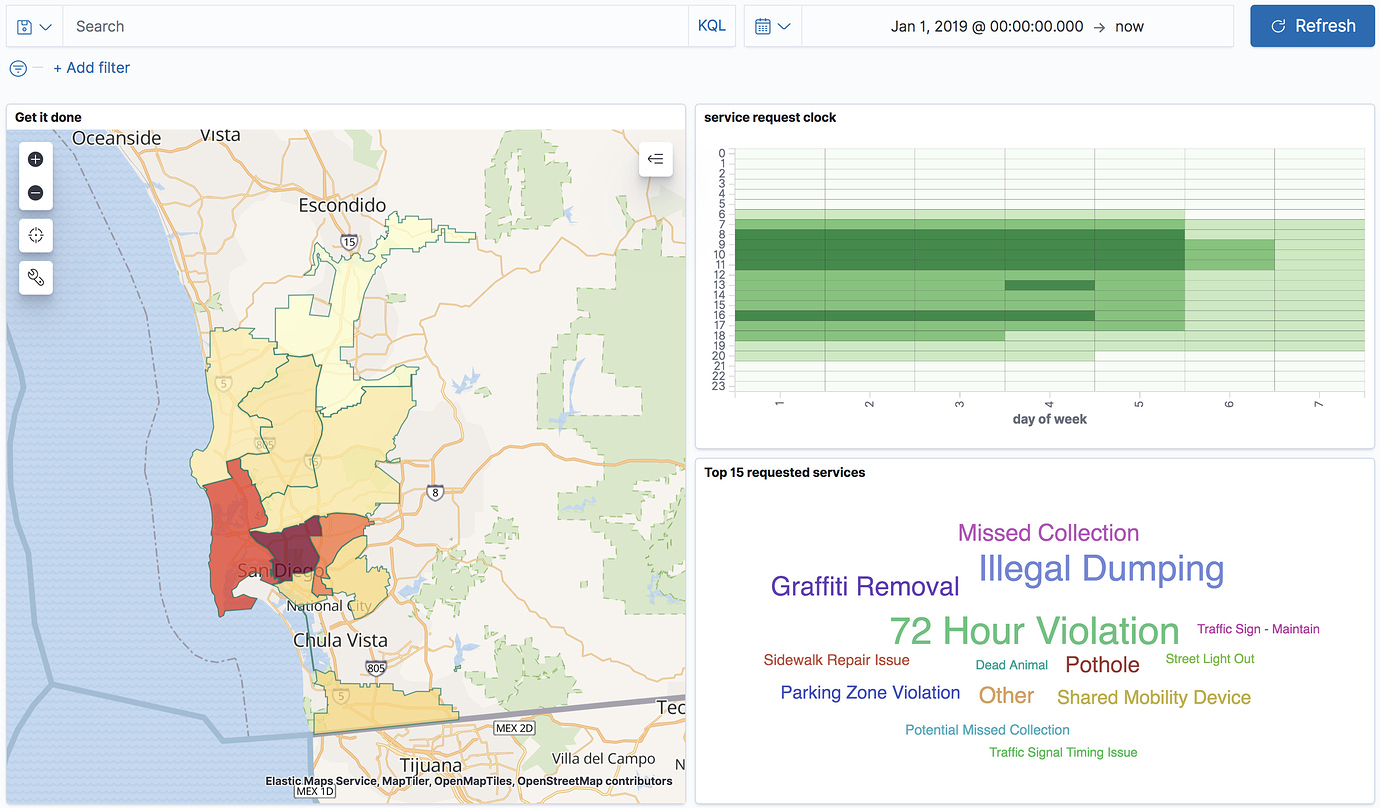
editViewing data from different angles provides better insights. Dimensions that are obscured in one visualization might be illuminated in another. Add your map to a dashboard and view your geospatial data alongside bar charts, pie charts, tag clouds, and more.
This choropleth map shows the density of non-emergency service requests in San Diego by council district. The map is embedded in a dashboard, so users can better understand when services are requested and gain insight into the top requested services.
Symbolize features using data values
editYou can customize each layer to highlight meaningful dimensions in your data. For example, you can use dark colors to symbolize areas with more web log traffic, and lighter colors to symbolize areas with less traffic.
Focus in on just the data you want
editYou can search across your Elasticsearch layers to focus in on just the data you want. Draw a polygon on the map or use the shape from features to create spatial filters to narrow search results to documents that either intersect with, are within, or do not intersect with the specified geometry. Filter individual layers to compares facets.