Traces overview
editTraces overview
editTraces link together related transactions to show an end-to-end performance of how a request was served and which services were part of it. In addition to the Traces overview, you can view your application traces in the span timeline waterfall.
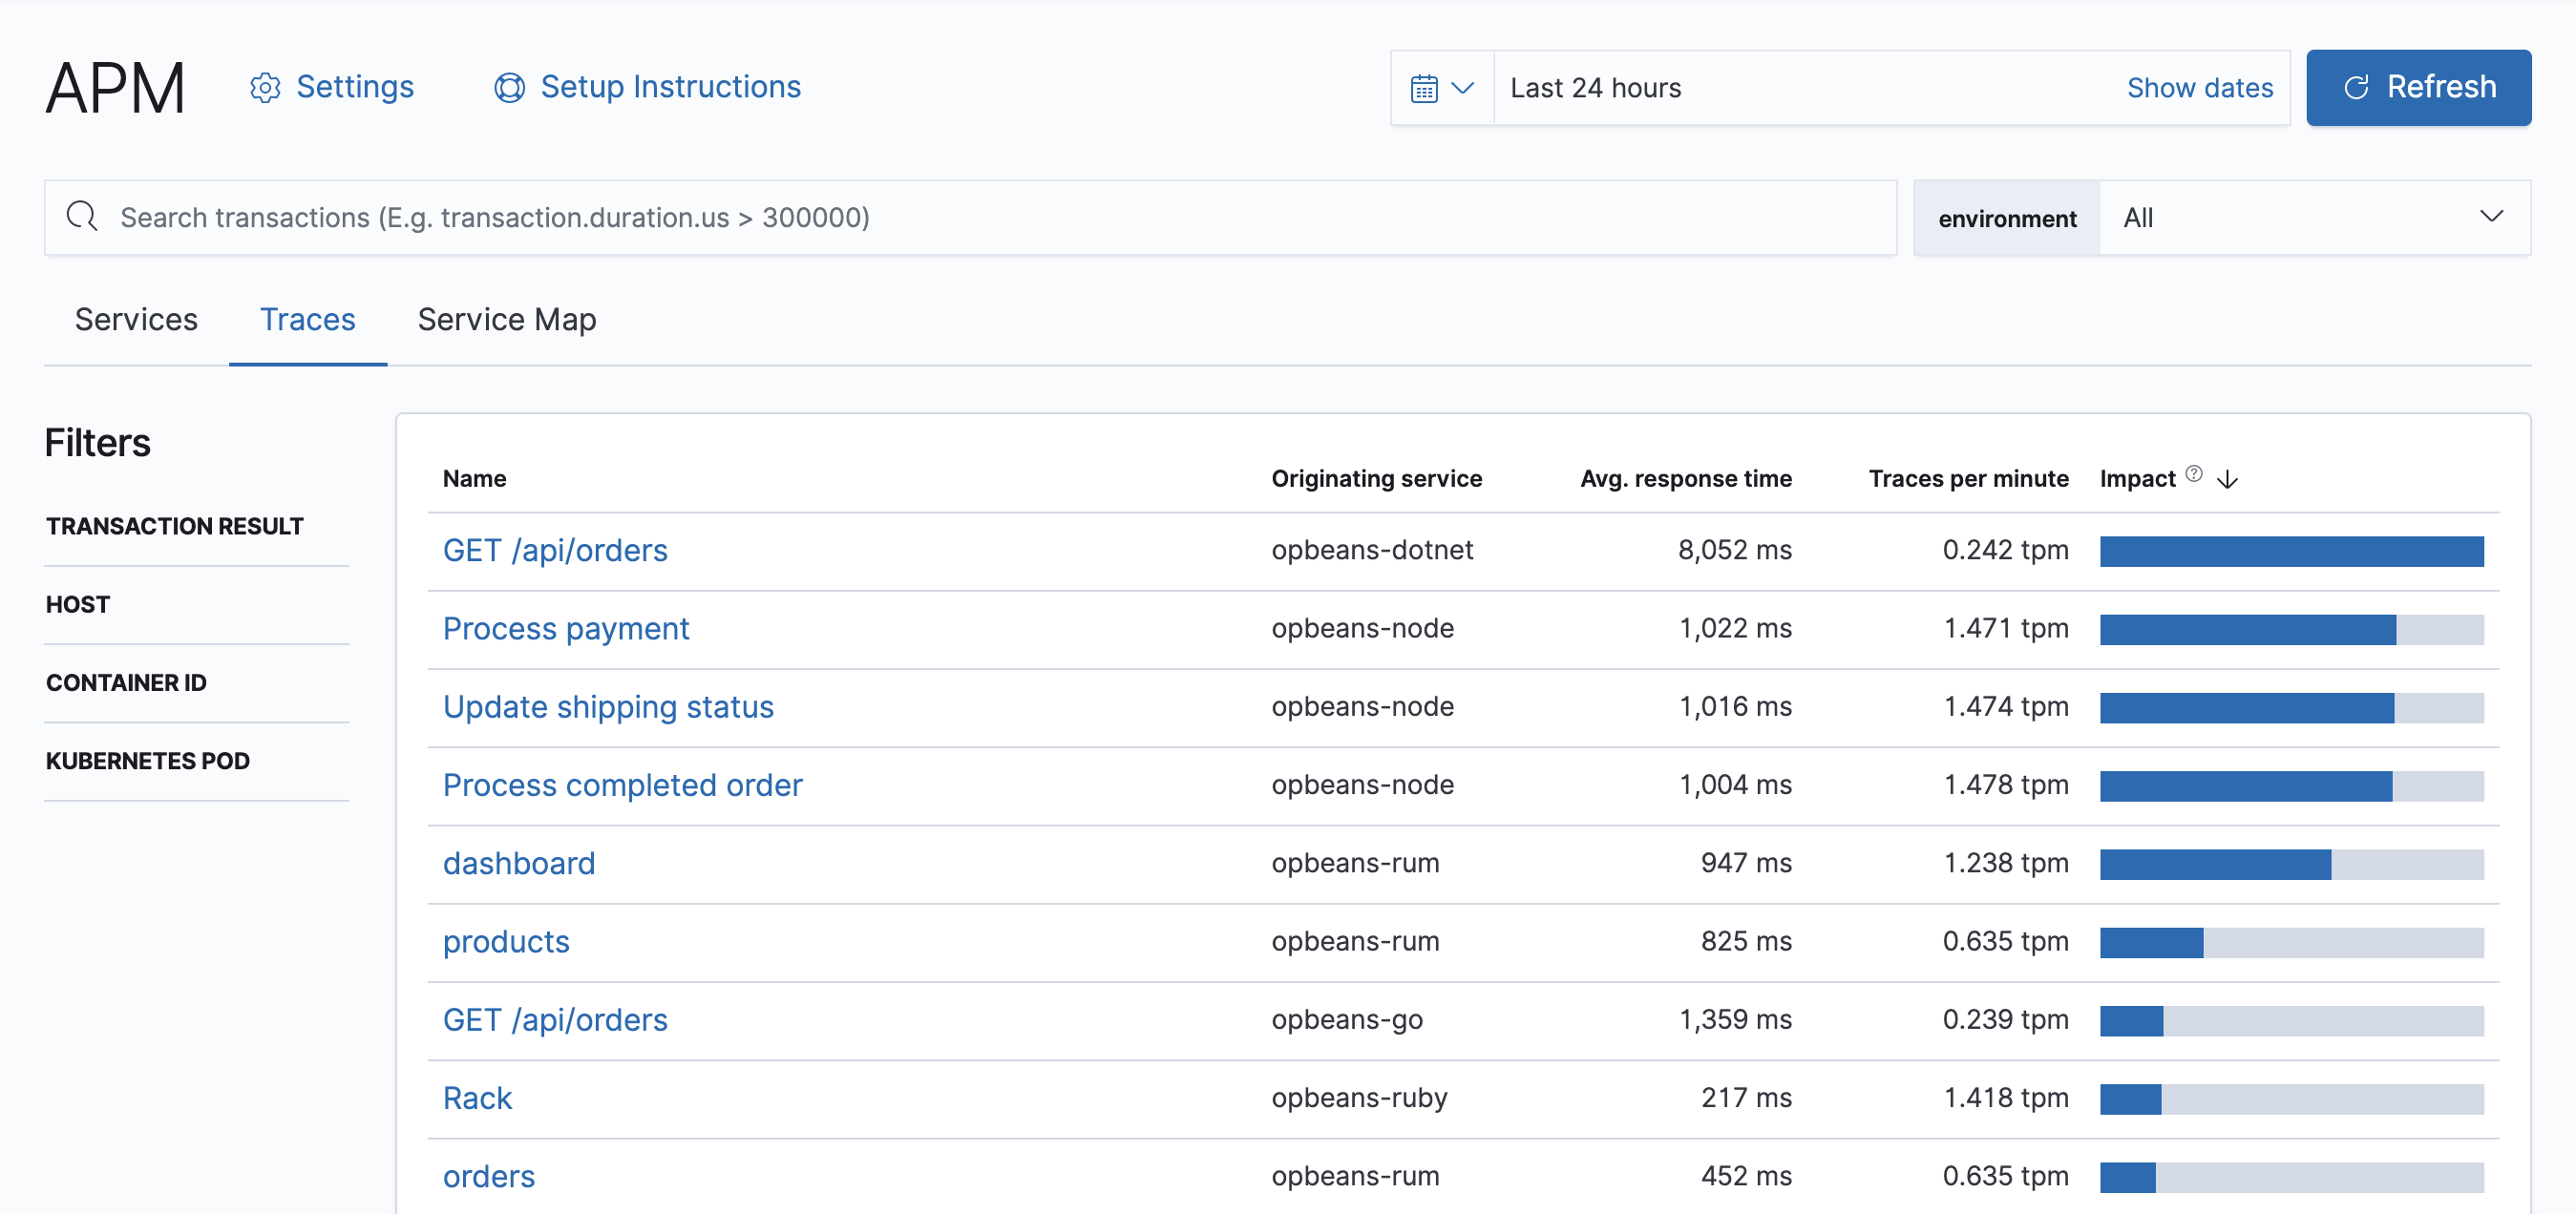
The Traces overview displays the entry transaction for all traces in your application. If you’re using Distributed tracing, this view is key to finding the critical paths within your application. Transactions with the same name are grouped together and only shown once in this table.
By default, transactions are sorted by Impact. Impact helps show the most used and slowest endpoints in your service—in other words, it’s the collective amount of pain a specific endpoint is causing your users. If there’s a particular endpoint you’re worried about, you can click on it to view the transaction details.
Distributed tracing
editElastic APM supports distributed tracing. Distributed tracing is a key feature of modern application performance monitoring as application architectures are shifting from monolithic to more distributed, service-based architectures.
Distributed tracing allows APM users to automatically trace requests all the way through the service architecture, and visualize those traces in one single view in the APM app. This is accomplished by tracing all of the requests, from the initial web request to your front-end service, to queries made to your back-end services. This makes finding possible bottlenecks throughout your application much easier and faster.
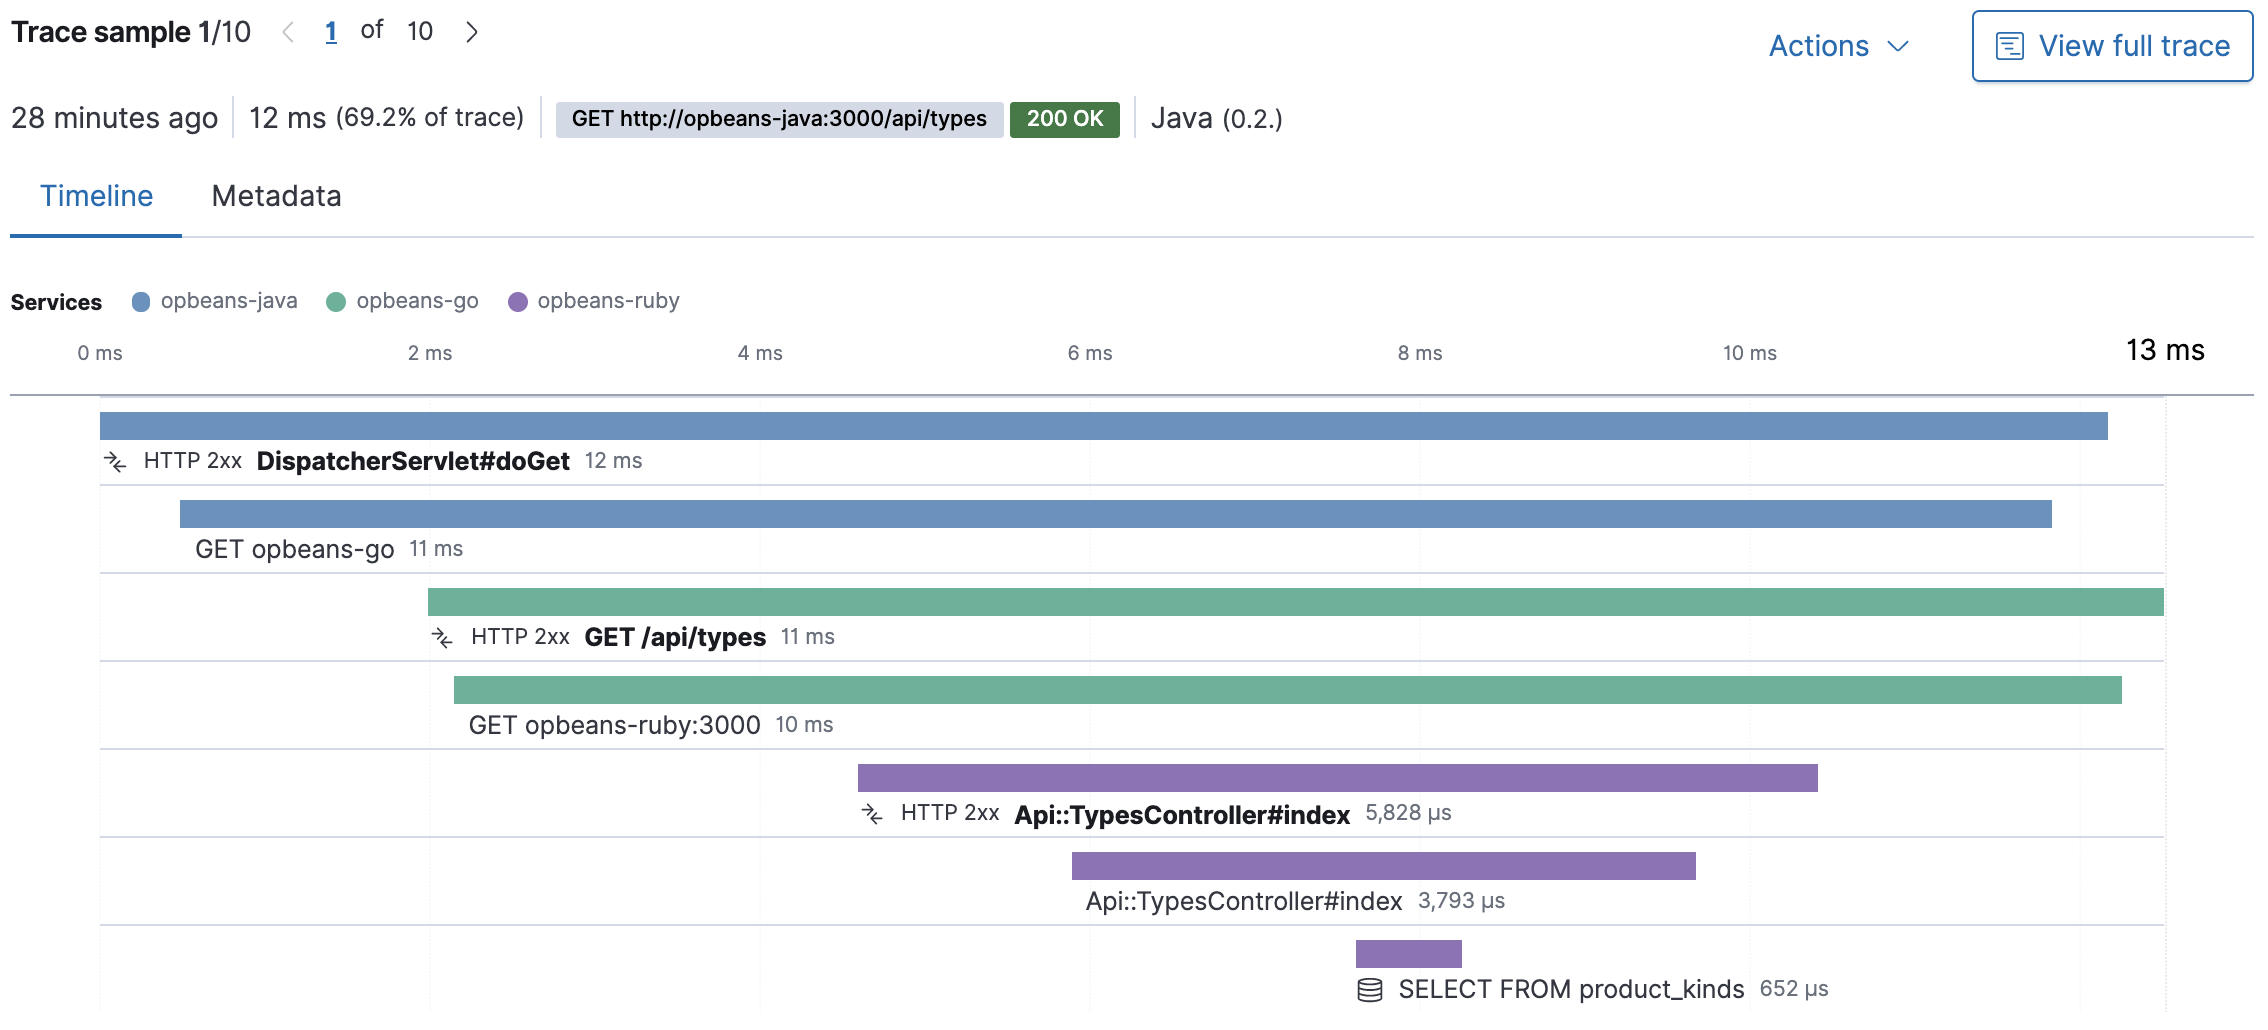
By definition, a distributed trace includes more than one transaction. You can use the span timeline visualization to view a waterfall display of all of the transactions from individual services that are connected in a trace.
Distributed tracing is supported by all APM agents, and there’s no additional configuration needed.