PagerDuty action
editPagerDuty action
editThe PagerDuty action type uses the v2 Events API to trigger, acknowledge, and resolve PagerDuty alerts.
PagerDuty + Elastic integration benefits
editBy integrating PagerDuty with alerts, you can:
- Route your alerts to the right PagerDuty responder within your team, based on your structure, escalation policies, and workflows.
- Automatically generate incidents of different types and severity based on each alert’s context.
- Tailor the incident data to match your needs by easily passing the alerting context from Kibana to PagerDuty.
How it works
editKibana allows you to create alerts to notify you of a significant move in your dataset. You can create alerts for all your Observability, Security, and Elastic Stack use cases. Alerts will trigger a new incident on the corresponding PagerDuty service.
Requirements
editIn the kibana.yml configuration file, you must add the saved objects encryption setting.
This is required to encrypt parameters that must be secured, for example PagerDuty’s integration key.
If you have security enabled:
- You must have application privileges to access Metrics, APM, Uptime, or SIEM.
- If you are using a self-managed deployment with security, you must have Transport Security Layer (TLS) enabled for communication between Elasticsearch and Kibana. Alerts uses API keys to secure background alert checks and actions, and API keys require TLS on the HTTP interface.
Although not a requirement, to harden the integrations security you might want to review the Actions settings that are available to you.
Support
editIf you need help with this integration, get in touch with the Kibana team by visiting support.elastic.co or by using the Ask Elastic option in the Kibana Help menu. You can also select the Kibana category at discuss.elastic.co.
Integration with PagerDuty walkthrough
edit- From the Configuration menu, select Services.
-
Add an integration to a service:
- If you are adding your integration to an existing service, click the name of the service you want to add the integration to. Then, select the Integrations tab and click the New Integration button.
- If you are creating a new service for your integration, go to Configuring Services and Integrations and follow the steps outlined in the Create a New Service section, selecting Elastic as the Integration Type in step 4. Continue with the In Elastic section once you have finished these steps.
- Enter an Integration Name in the format Elastic-service-name (for example, Elastic-Alerting or Kibana-APM-Alerting) and select Elastic from the Integration Type menu.
-
Click Add Integration to save your new integration.
You will be redirected to the Integrations tab for your service. An Integration Key is generated on this screen.
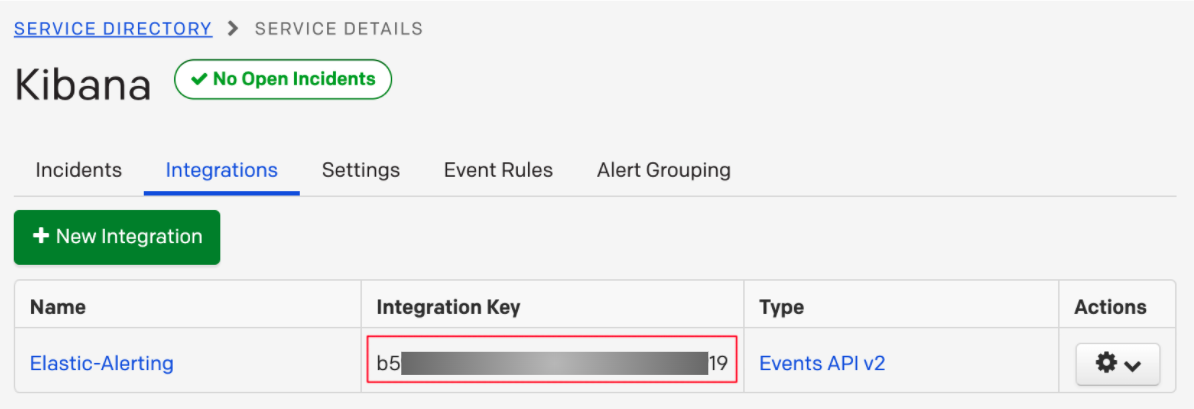
- Save this key, as you will use it when you configure the integration with Elastic in the next section.
-
Create a PagerDuty Connector in Kibana. You can:
- Create a connector as part of creating an alert by selecting PagerDuty in the Actions section of the alert configuration and selecting Add new.
- Alternatively, create a connector by navigating to Management from the Kibana navbar and selecting Alerts and Actions. Then, select the Connectors tab, click the Create connector button, and select the PagerDuty option.
-
Configure the connector by giving it a name and entering the Integration Key, optionally entering a custom API URL.
See In PagerDuty for how to obtain the endpoint and key information from PagerDuty and Connector configuration for more details.
- Save the Connector.
- Create an alert using Management > Alerts and Actions or the application of your choice.
-
Set up an action using your PagerDuty connector, by determining:
- The action’s type: Trigger, Resolve, or Acknowledge.
- The event’s severity: Info, warning, error, or critical.
- An array of different fields, including the timestamp, group, class, component, and your dedup key. Depending on your custom needs, assign them variables from the alerting context. To see the available context variables, click on the Add alert variable icon next to each corresponding field. For more details on these parameters, see the Actions Configuration and the PagerDuty API v2 documentation.
How to uninstall
editTo remove a PagerDuty connector from an alert, simply remove it from the Actions section of that alert, using the remove (x) icon. This will disable the integration for the particular alert.
To delete the connector entirely, go to Management > Alerts and Actions. Select the Connectors tab, and then click on the delete icon. This is an irreversible action and impacts all alerts that use this connector.
Connector configuration
editPagerDuty connectors have the following configuration properties:
- Name
- The name of the connector. The name is used to identify a connector in the management UI connector listing, or in the connector list when configuring an action.
- API URL
-
An optional PagerDuty event URL. Defaults to
https://events.pagerduty.com/v2/enqueue. If you are using thexpack.actions.whitelistedHostssetting, make sure the hostname is whitelisted. - Integration Key
- A 32 character PagerDuty Integration Key for an integration on a service, also referred to as the routing key.
Action configuration
editPagerDuty actions have the following properties:
- Severity
-
The perceived severity of on the affected system. This can be one of
Critical,Error,WarningorInfo(default). - Event action
-
One of
Trigger(default),Resolve, orAcknowledge. See event action for more details. - Dedup Key
-
All actions sharing this key will be associated with the same PagerDuty alert. This value is used to correlate trigger and resolution. This value is optional, and if unset defaults to
action:<action saved object id>. The maximum length is 255 characters. See alert deduplication for details. - Timestamp
- An optional ISO-8601 format date-time, indicating the time the event was detected or generated.
- Component
-
An optional value indicating the component of the source machine that is responsible for the event, for example
mysqloreth0. - Group
-
An optional value indicating the logical grouping of components of a service, for example
app-stack. - Source
- An optional value indicating the affected system, preferably a hostname or fully qualified domain name. Defaults to the Kibana saved object id of the action.
- Summary
-
An optional text summary of the event, defaults to
No summary provided. The maximum length is 1024 characters. - Class
-
An optional value indicating the class/type of the event, for example
ping failureorcpu load.
For more details on these properties, see PagerDuty v2 event parameters.