Alert types
editAlert types
editKibana supplies alerts types in two ways: some are built into Kibana, while domain-specific alert types are registered by Kibana apps such as APM, Metrics, and Uptime.
This section covers built-in alert types. For domain-specific alert types, refer to the documentation for that app.
Currently Kibana provides one built-in alert type: the Index threshold type.
Index threshold
editThe index threshold alert type is designed to run an Elasticsearch query over indices, aggregating field values from documents, comparing them to threshold values, and scheduling actions to run when the thresholds are met.
Creating the alert
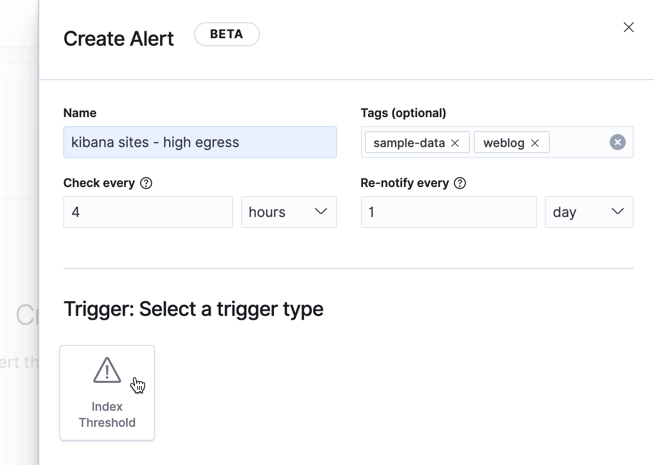
editAn index threshold alert can be created from the Create button in the alert management UI. Fill in the general alert details, then select Index Threshold.
Defining the conditions
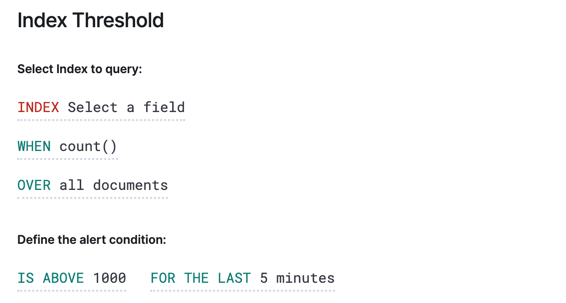
editThe index threshold has 5 clauses that define the condition to detect.
- Index
- This clause requires an index or index pattern and a time field that will be used for the time window.
- When
-
This clause specifies how the value to be compared to the threshold is calculated. The value is calculated by aggregating a numeric field a the time window. The aggregation options are:
count,average,sum,min, andmax. When usingcountthe document count is used, and an aggregation field is not necessary. - Over/Grouped Over
- This clause lets you configure whether the aggregation is applied over all documents, or should be split into groups using a grouping field. If grouping is used, an alert instance will be created for each group when it exceeds the threshold. To limit the number of instances on high cardinality fields, you must specify the number of groups to check against the threshold. Only the top groups are checked.
- Threshold
-
This clause defines a threshold value and a comparison operator (one of
is above,is above or equals,is below,is below or equals, oris between). The result of the aggregation is compared to this threshold. - Time window
- This clause determines how far back to search for documents, using the time field set in the index clause. Generally this value should be to a value higher than the check every value in the general alert details, to avoid gaps in detection.
If data is available and all clauses have been defined, a preview chart will render the threshold value and display a line chart showing the value for the last 30 intervals. This can provide an indication of recent values and their proximity to the threshold, and help you tune the clauses.
Example
editIn this section, you will use the Kibana weblog sample dataset to setup and tune the conditions on an index threshold alert. For this example, we want to detect when any of our top three sites have served more than 420,000 bytes over a 24 hour period.
From the alert management UI, create a new alert, and fill in the general alert details. This alert will be checked every 4 hours, and will not execute actions more than once per day. Choose the index threshold alert type.
Click on each clause to open a control that helps you set the value:
Index clause
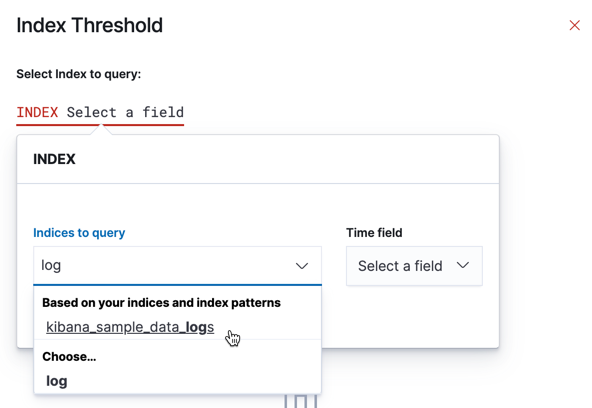
editThe index clause control will list and allow you to search for available indices. Choose kibana_sample_data_logs
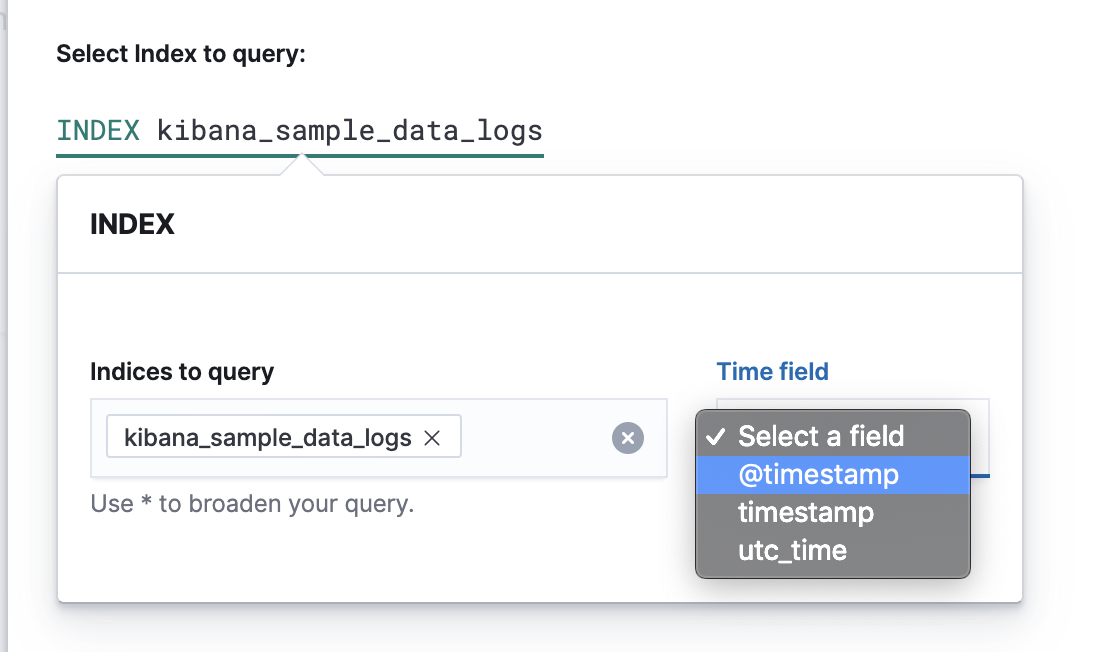
Once an index is selected, the list of time fields for that index will be available to select. Choose @timestamp.
When clause
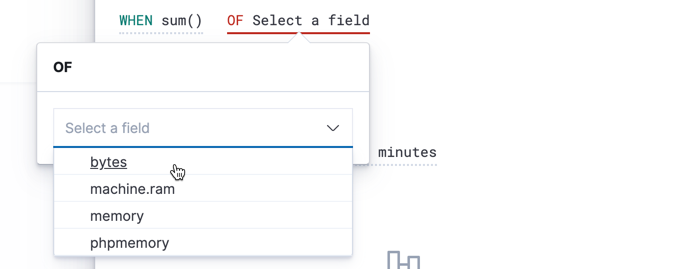
editWe want to detect the number of bytes served during the time window, so we select sum as the aggregation, and bytes as the field to aggregate.
Over/Grouped over clause
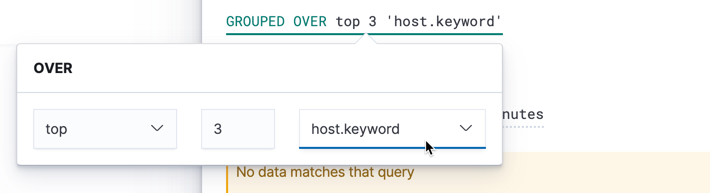
editWe want to alert on the three sites that have the most traffic, so we’ll group the sum of bytes by the host.keyword field and take the top 3 values.
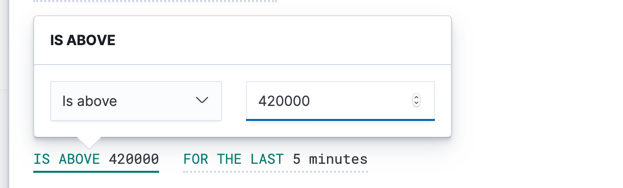
Threshold clause
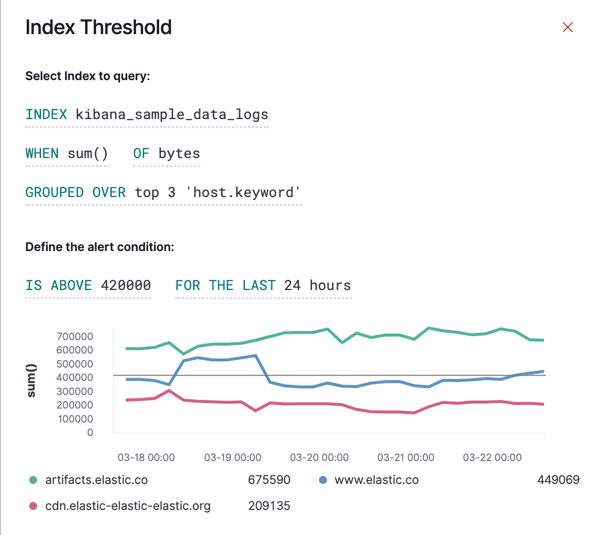
editWe want to alert when any site exceeds 420,000 bytes over a 24 hour period, so we’ll set the threshold to 420,000 and use the is above comparison.
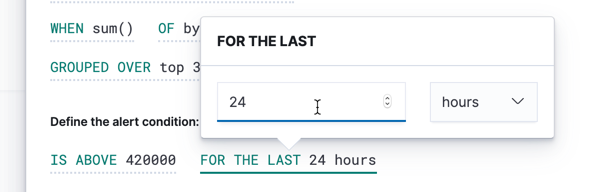
Time window clause
editFinally, set the time window to 24 hours to complete the alert configuration.
The preview chart will render showing the 24 hour sum of bytes at 4 hours intervals (the check every interval) for the past 120 hours (the last 30 intervals).
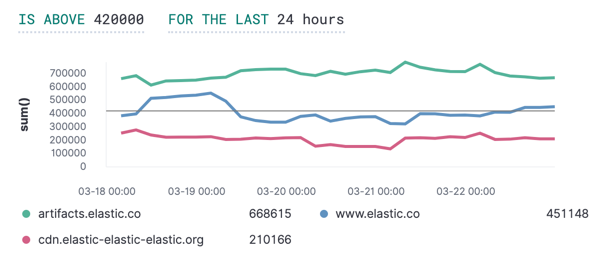
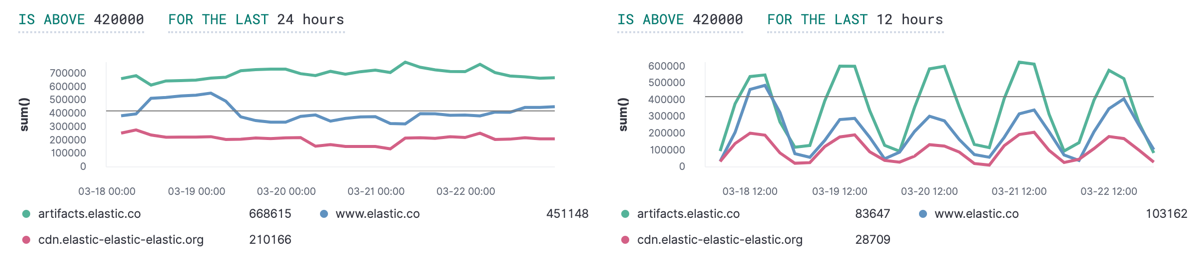
Comparing time windows
editYou can interactively change the time window and observe the effect it has on the chart. Compare a 24 window to a 12 hour window. Notice the variability in the sum of bytes, due to different traffic levels during the day compared to at night. This variability would result in noisy alerts, so the 24 hour window is better. The preview chart can help you find the right values for your alert.