Maps
editMaps
editTo tell a story and answer questions about your geographical data, you can create several types of interactive maps with Visualize.
Visualize supports the following maps:
- Coordinate — Display latitude and longitude coordinates that are associated to the specified bucket aggregation.
- Region — Display colored boundary vector shapes using a gradient. Darker colors indicate larger values, and lighter colors indicate smaller values.
The maps in Visualize have been replaced with Elastic Maps, which offers more functionality.
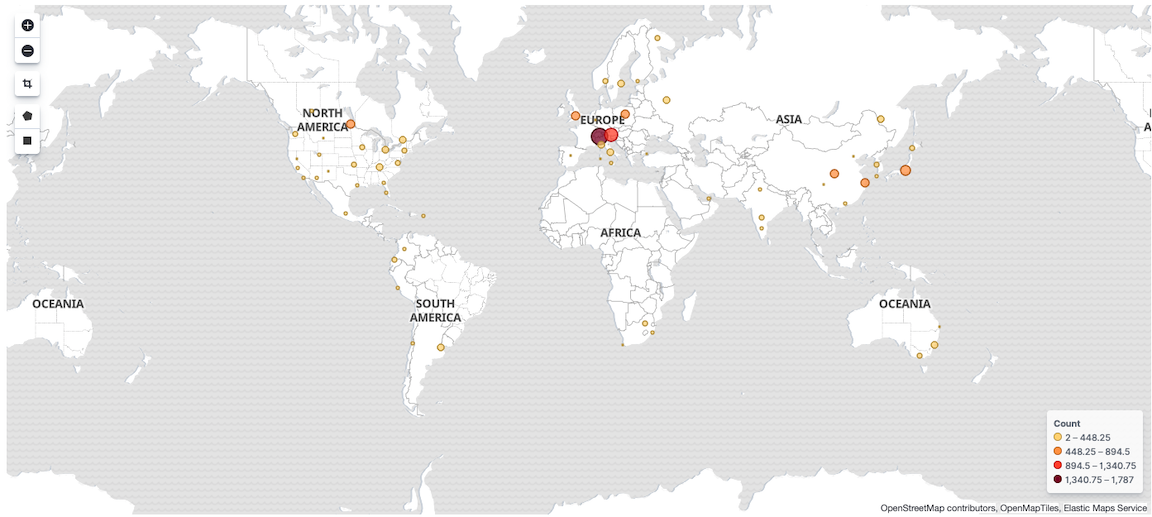
Coordinate map
editUse a coordinate map when your data set includes latitude and longitude values. For example, use a coordinate map to see the varying popularity of destination airports using the sample flight data.
Build a coordinate map
editConfigure the kibana.yml settings and add the aggregations.
-
Configure the following
kibana.ymlsettings:-
Set
xpack.maps.showMapVisualizationTypestotrue. - To use a tile service provider for coordinate maps other than Elastic Maps Service, configure the tilemap settings.
-
Set
-
To display your data on the coordinate map, use the following aggregations:
-
Specify the geohash bucket aggregation options:
-
Precision slider — Determines the granularity of the results displayed on the map. To show the Precision slider, deselect Change precision on map zoom. For information on the area specified by each precision level, refer to geohash grid.
Higher precisions increase memory usage for the browser that displays Kibana and the underlying Elasticsearch cluster.
-
Place markers off grid (use geocentroid) — When you selected, the markers are placed in the center of all documents in the bucket, and a more accurate visualization is created. When deselected, the markers are placed in the center of the geohash grid cell.
When you have multiple values in the geo_point, the coordinate map is unable to accurately calculate the geo_centroid.
-
Navigate the coordinate map
editTo navigate the coordinate map, use the navigation options.
- To move the map center, click and hold anywhere on the map and move the cursor.
-
To change the zoom level, click Zoom In or Zoom out
 .
.
-
To automatically crop the map boundaries to the
geohash buckets that have at least one result, click Fit Data Bounds
 .
.
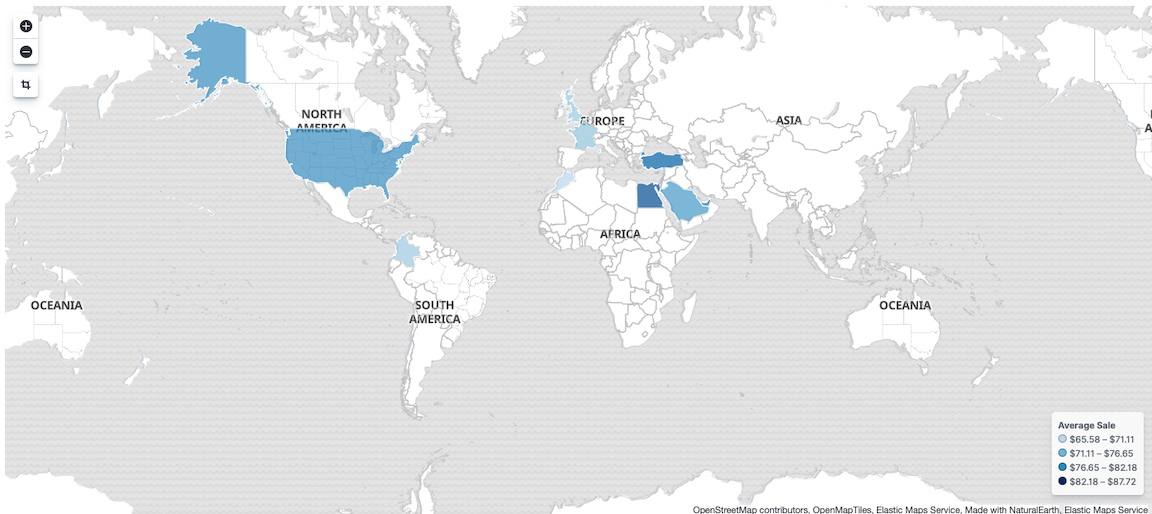
Region map
editUse region maps when you want to show statistical data on a geographic area, such as a county, country, province, or state. For example, use a region map if you want to see the average sales for each country with the sample eCommerce order data.
Build a region map
editConfigure the kibana.yml settings and add the aggregations.
-
In
kibana.yml, setxpack.maps.showMapVisualizationTypestotrue. -
To display your data on the region map, use the following aggregations:
Navigate the region map
editTo navigate the region map, use the navigation options.
-
To change the zoom level, click Zoom In or Zoom out .
-
To automatically crop the map boundaries, click Fit Data Bounds .