Dashboard
editDashboard
editA Kibana dashboard is a collection of visualizations, searches, and maps, typically in real-time. Dashboards provide at-a-glance insights into your data and enable you to drill down into details.
To start working with dashboards, click Dashboard in the side navigation. With Dashboard, you can:
Read only access
editIf you see the read-only icon in the application header, then you don’t have sufficient privileges to create and save dashboards. The buttons to create and edit dashboards are not visible. For more information, see Granting access to Kibana.
Interact with dashboards
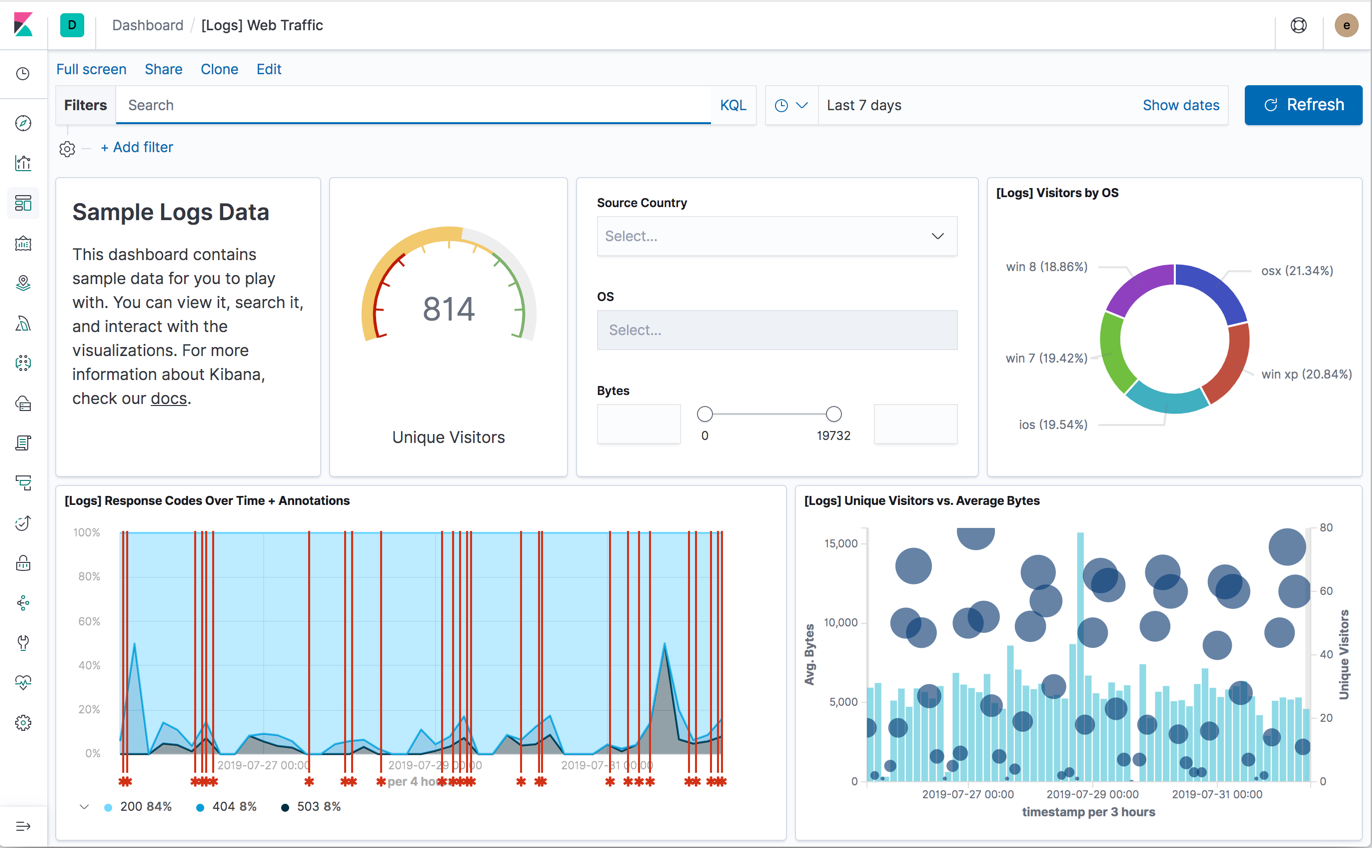
editWhen you open Dashboard, you’re presented an overview of your dashboards. If you don’t have any dashboards, you can add sample data sets, which include pre-built dashboards.
Once you open a dashboard, you can filter the data by entering a search query, changing the time filter, or clicking in the visualizations, searches, and maps. If a dashboard element has a stored query, both queries are applied.