Create a dashboard
editCreate a dashboard
editTo create a dashboard, you must have data indexed into Elasticsearch, an index pattern to retrieve the data from Elasticsearch, and visualizations, saved searches, or maps. If these don’t exist, you’re prompted to add them as you create the dashboard.
For an end-to-end example, see Building your own dashboard.
- Open Dashboard.
- Click Create new dashboard.
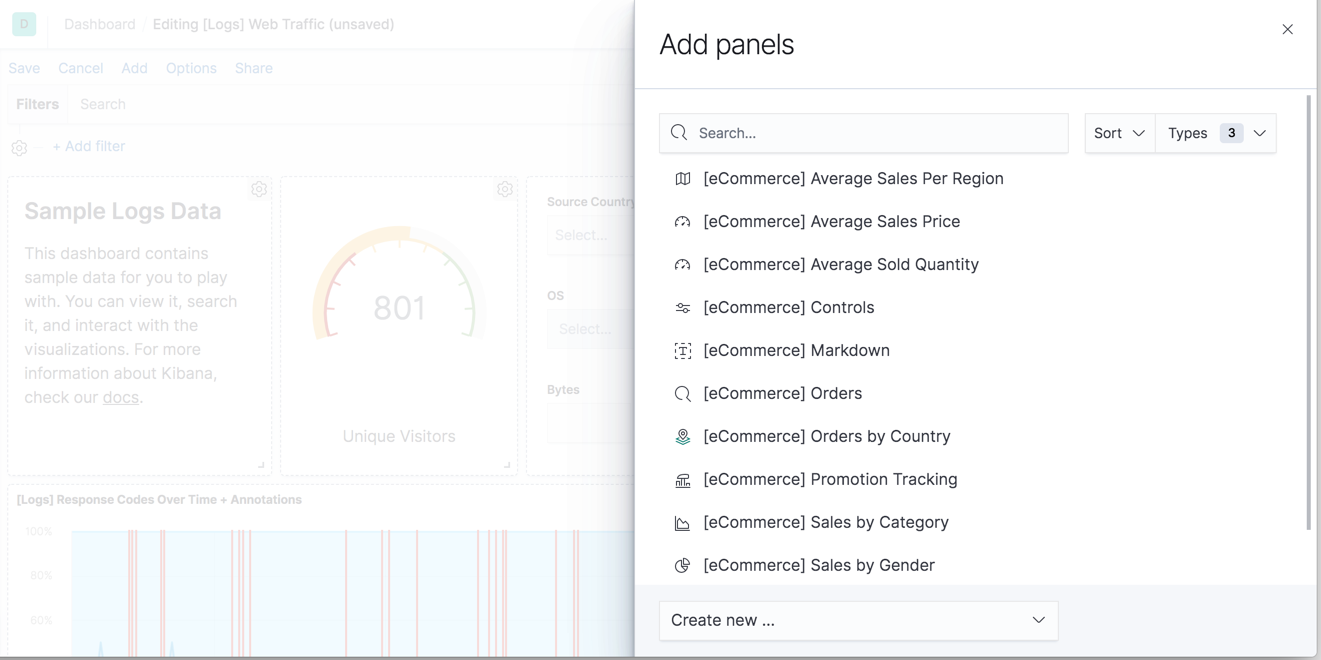
- Click Add.
-
Use Add panels to add elements to the dashboard.
The visualizations, saved searches, and maps are stored in panels that you can move and resize. A menu in the upper right of the panel has options for customizing the panel. You can add elements from multiple indices, and the same element can appear in multiple dashboards.
- When you’re finished adding and arranging the panels, Save the dashboard.
Arrange dashboard elements
editIn Edit mode, you can move, resize, customize, and delete panels to suit your needs.
- To move a panel, click and hold the panel header and drag to the new location.
- To resize a panel, click the resize control on the lower right and drag to the new dimensions.
- To toggle the use of margins and panel titles, use the Options menu.
- To delete a panel, open the panel menu and select Delete from dashboard. Deleting a panel from a dashboard does not delete the saved visualization or search.
Customize time ranges
editYou can configure each visualization, saved search, and map on your dashboard for a specific time range. For example, you might want one visualization to show the monthly trend for CPU usage and another to show the current CPU usage.
From the panel menu, select Customize time range to expose a time filter dedicated to that panel. Panels that are not restricted by a specific time range are controlled by the global time filter.
Share a dashboard
editWhen you’ve finished your dashboard, you can share it with your teammates. From the Share menu, you can:
- Embed the code in a web page. Users must have Kibana access to view an embedded dashboard.
- Share a direct link to a Kibana dashboard
- Generate a PDF report
- Generate a PNG report
You can create a link to a dashboard by title by doing this:
${domain}/${basepath?}/app/kibana#/dashboards?title=${yourdashboardtitle}
When sharing a link to a dashboard snapshot, use the Short URL. Snapshot URLs are long and can be problematic for Internet Explorer and other tools. To create a short URL, you must have write access to Kibana.
Import and export dashboards
editTo import and export dashboards, go to Management > Saved Objects. For details, see Managing saved objects.
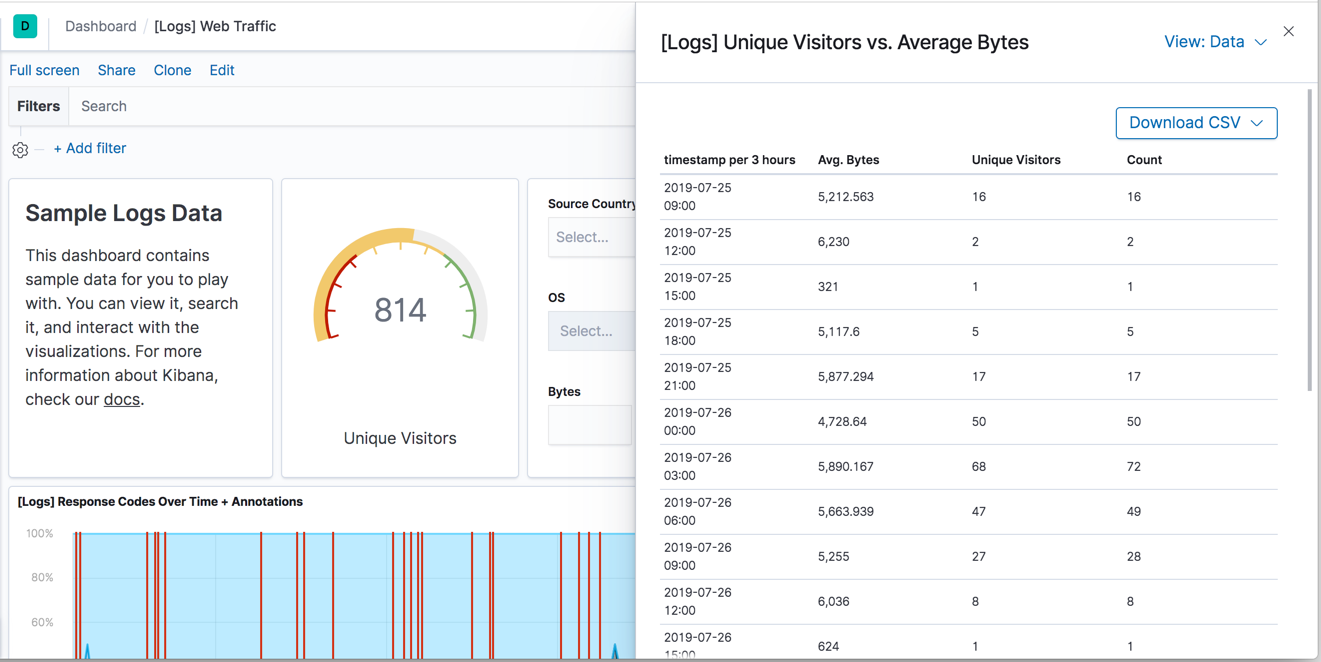
Inspect and edit elements
editMany dashboard elements allow you to drill down into the data and requests behind the element. Open the menu in the upper right of the panel and select Inspect. The views you see depend on the element that you inspect.
To open an element for editing, put the dashboard in Edit mode, and then select Edit from the panel menu. The changes you make appear in every dashboard that uses the element.