Using rolled up data in a visualization
editUsing rolled up data in a visualization
editThis functionality is in beta and is subject to change. The design and code is less mature than official GA features and is being provided as-is with no warranties. Beta features are not subject to the support SLA of official GA features.
You can visualize your rolled up data in a variety of charts, tables, maps, and more. Most visualizations support rolled up data, with the exception of Timelion and Vega visualizations.
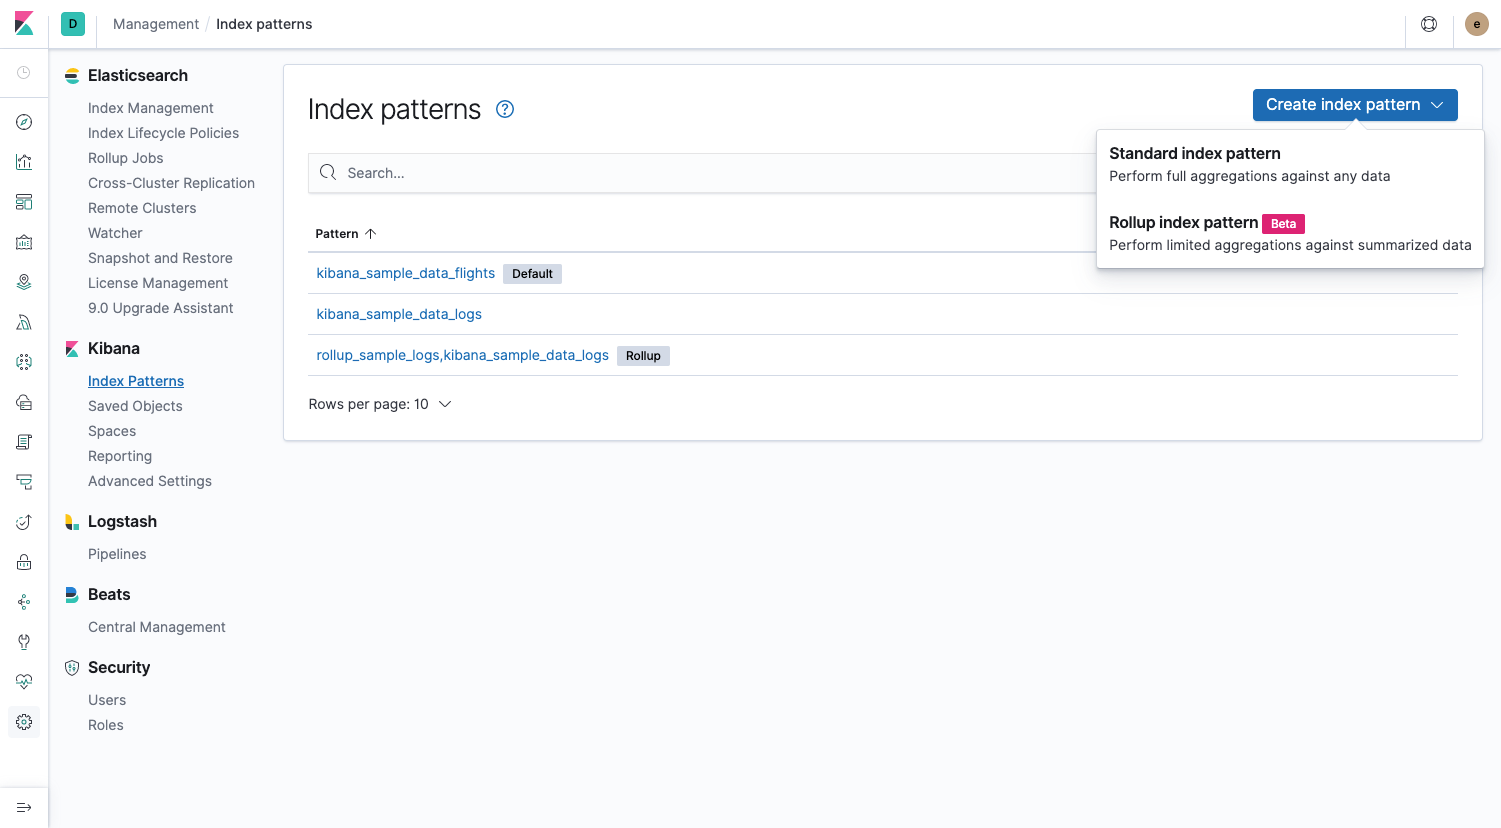
To get started, go to Management > Kibana > Index patterns. If a rollup index is detected in the cluster, Create index pattern includes an item for creating a rollup index pattern.
You can match an index pattern to only rolled up data, or mix both rolled up and raw data to visualize all data together. An index pattern can match only one rolled up index, not multiple. There is no restriction on the number of standard indices that an index pattern can match. When matching multiple indices, use a comma to separate the names, with no space after the comma.
Keep the following in mind when creating a visualization from rolled up data:
- The data in a rollup index only has summarized metrics for specific fields. You can’t search any other field from the original raw data.
- Data is summarized into time buckets that might be split into sub buckets for numeric field values or terms. You can ask for a time aggregation that takes several time buckets and combines them to lower granularity. For example, if the rollup job was aggregated by hours, you can ask for buckets of days.
The following visualization of rolled up data shows the date histogram interval multiple and the limited metrics aggregations.
![][Rollups in visualizations](images/management_rollups_visualization.png)
Dashboards can have a mixture of rollup visualizations and regular visualizations, as shown in the following figure. Note that not all queries and filters support rollups.
![][Rollups in dashboards](images/management_rolled_dashboard.png)