Canvas tutorial
editCanvas tutorial
editTo get up and running with Canvas, use the following tutorial where you’ll create a display for monitoring sales at an eCommerce store.
Before you begin
editFor this tutorial, you’ll need to add the Sample eCommerce orders data.
Create and personalize your workpad
editYour first step to working with Canvas is to create a workpad.
- Open Canvas.
- Click Create workpad.
-
To add a Name for your workpad, use the editor on the right. For example,
My Canvas Workpad.
Customize your workpad with images
editTo customize your workpad to look the way you want, add your own images.
-
Click Add element, then click Image.
The default Elastic logo image appears on your page.
- To replace the Elastic logo with your own image, select the image, then use the editor on the right.
- To move the image, click and drag it to your preferred location.
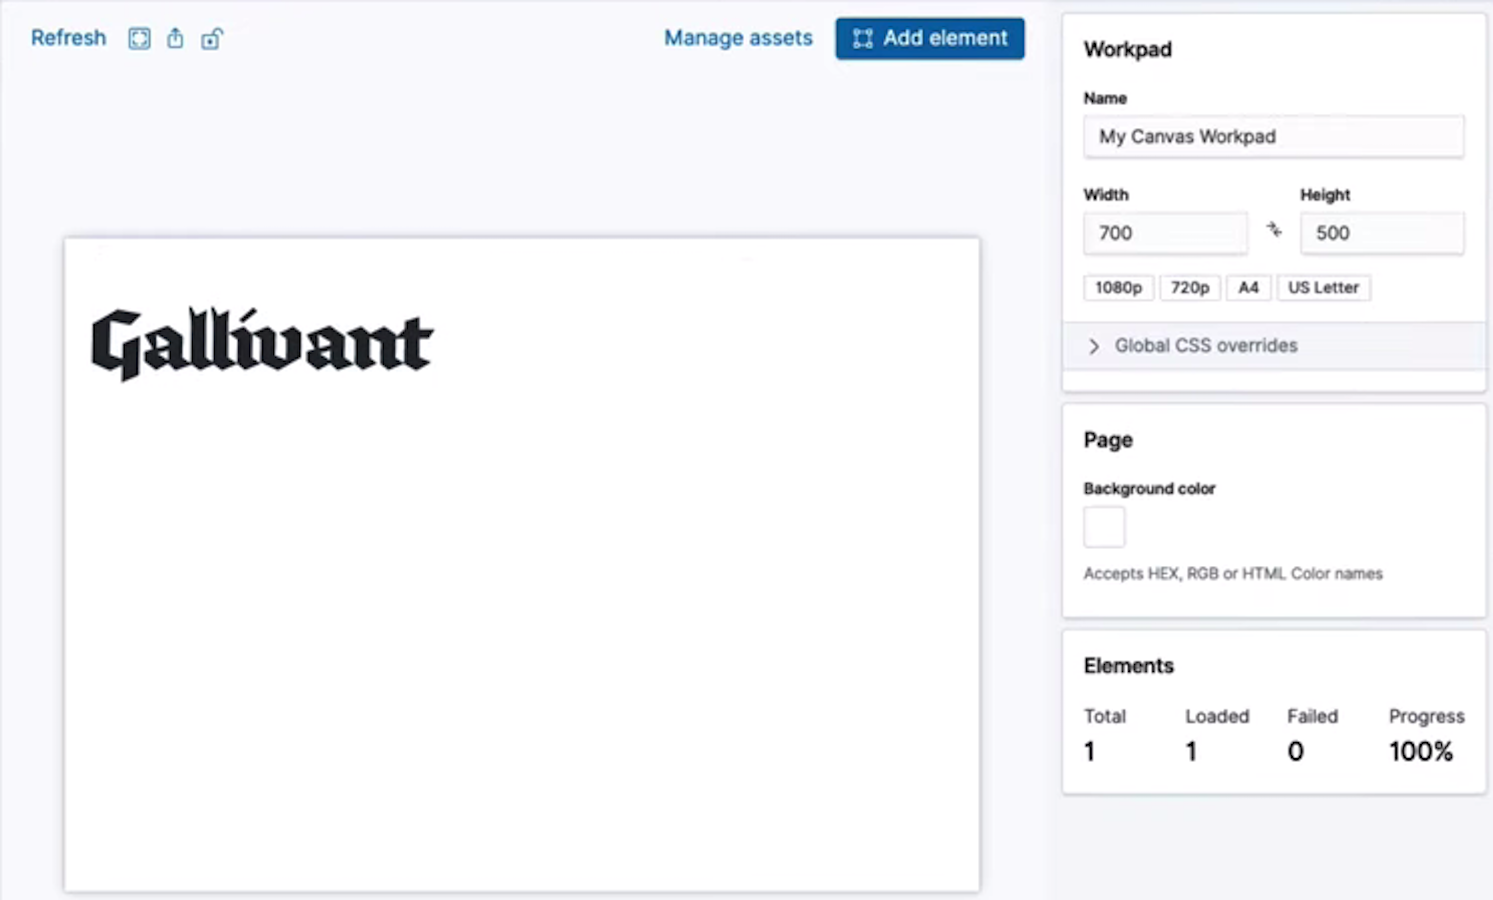
You’ll notice that the image is tagged as an asset, which allows you to reuse the image from Manage assets.
Customize your data with metrics
editCustomize your data by connecting it to the Sample eCommerce orders data.
-
Click Add element, then click Metric.
By default, the Metric element is connected to a demo data source, which enables you to experiment with the element before you connect it to your own data source.
-
To connect the element to your own data source, make sure that the element is selected, then click Data.
- Click Change your data source, then click Elasticsearch SQL.
-
In the Elasticsearch SQL query field, enter the following query:
SELECT sum(taxless_total_price) AS sum_total_price FROM "kibana_sample_data_ecommerce"The query selects the total price field and sets it to the sum_total_price field. These fields are pulled from the kibana_sample_data_ecommerce index that you installed.
-
To verify that the data is correct, click Preview. If you like what you see, click Save.
At this point, the element displays an error.
-
Specify how to process and display the data.
- Click Display
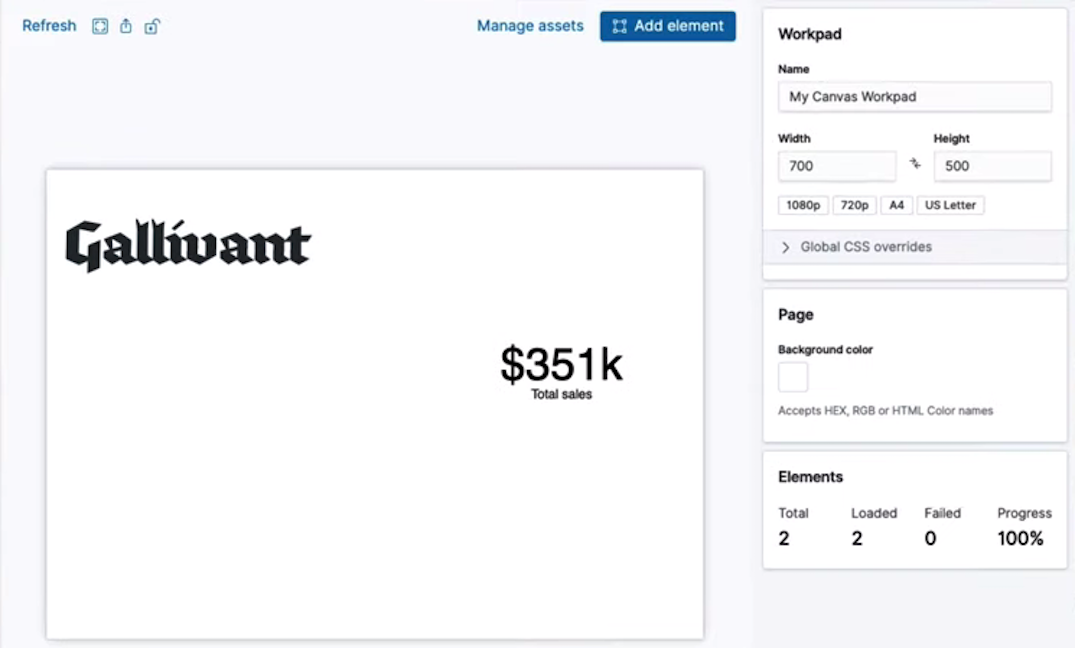
- Under Number, select Value from the function drop-down list, then select sum_total_price from the column drop-down list.
-
Change the Label to
Total sales.You’ll notice that the error is gone, but the number could use some formatting.
-
To format the number, use the Canvas expression language.
-
In the lower right corner, click Expression editor.
You’re now looking at the raw data syntax that Canvas uses to display the element.
-
Look for
math "sum_total_price", then add| formatNumber "$0a". - To update the number, click Run.
-
Show off your data with charts
editTo show what your data can do, add charts, graphs, progress monitors, and more to your workpad.
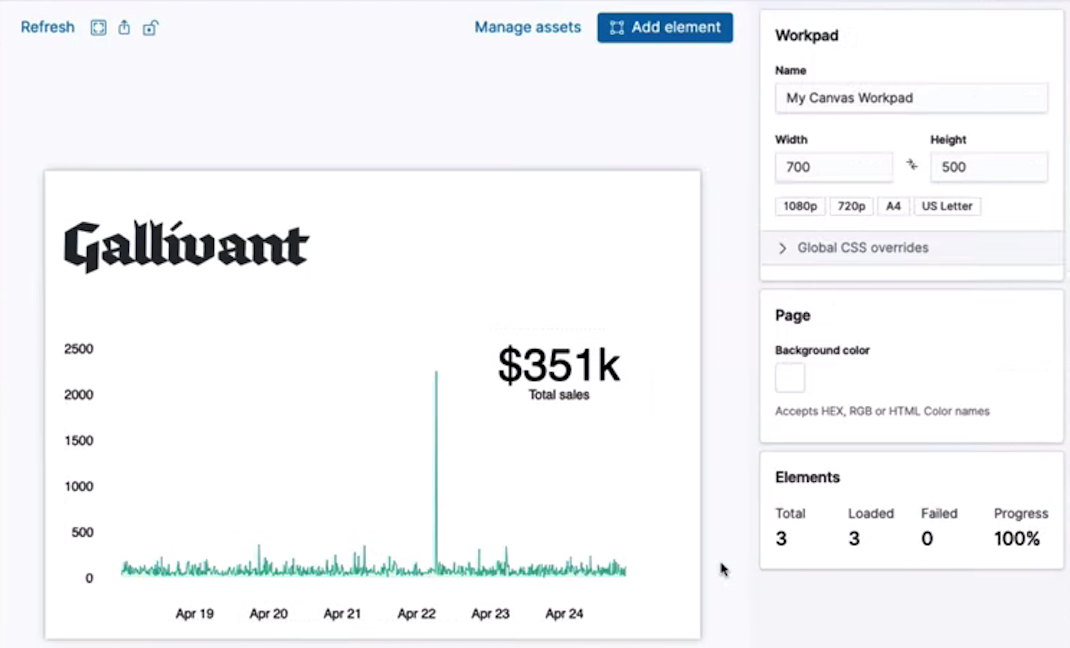
- Click Add element, then click Area chart.
-
To connect the element to your own data source, make sure that the element is selected, then click Data.
- Click Change your data source, then click Elasticsearch SQL.
-
To obtain the taxless total price by date, enter the following into the Elasticsearch SQL query field:
SELECT order_date, taxless_total_price FROM "kibana_sample_data_ecommerce" ORDER BY order_dateAlthough you used the Elasticsearch SQL data source for the metric and area chart elements, each element can display a different data source. Pages and workpads often contain multiple data sources.
- To verify that the data is correct, click Preview. If you like what you see, click Save.
-
Specify how to display the data.
- Click Display
- From the X-axis drop-down lists, select Value, then select order_date.
- From the Y-axis drop-down lists, select Value, then select taxless_total_price.
Show how your data changes over time
editTo focus your data on a specific time range, add a time filter to your workpad.
- Click Add element, then click Time filter.
-
Specify how to display the data.
- Click Display
-
To use the date time field from the sample data, enter
order_datein the Column field, then click Set.
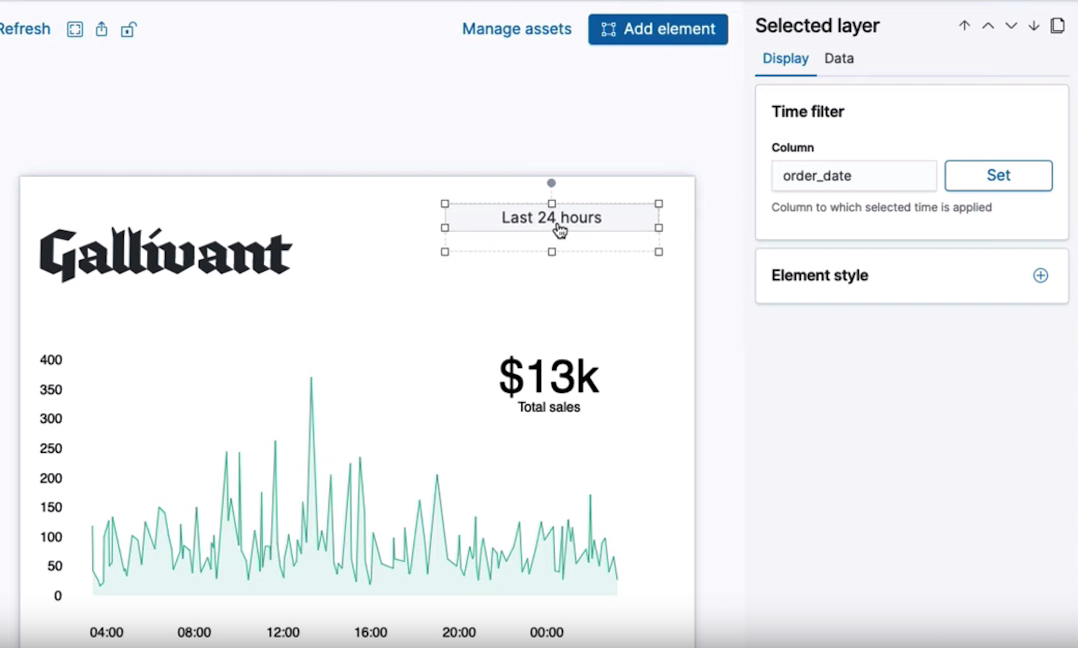
To see how the data changes, set the time filter to Last 7 days. As you change the time filter options, the metrics dynamically update.
Your workpad is now complete! Use the icons in the upper left corner to:
- Display your workpad in fullscreen mode
- Download your workpad as a PDF report or JSON object
- Configure the refresh rate for your data
- Share your workpad
Next steps
editNow that you know the Canvas basics, you’re ready to explore on your own.
Here are some things to try:
- Play with the sample Canvas workpads.
- Learn more about Workpads.
- Learn more about Elements.
- Deep dive into the expression language and functions that drive Canvas.