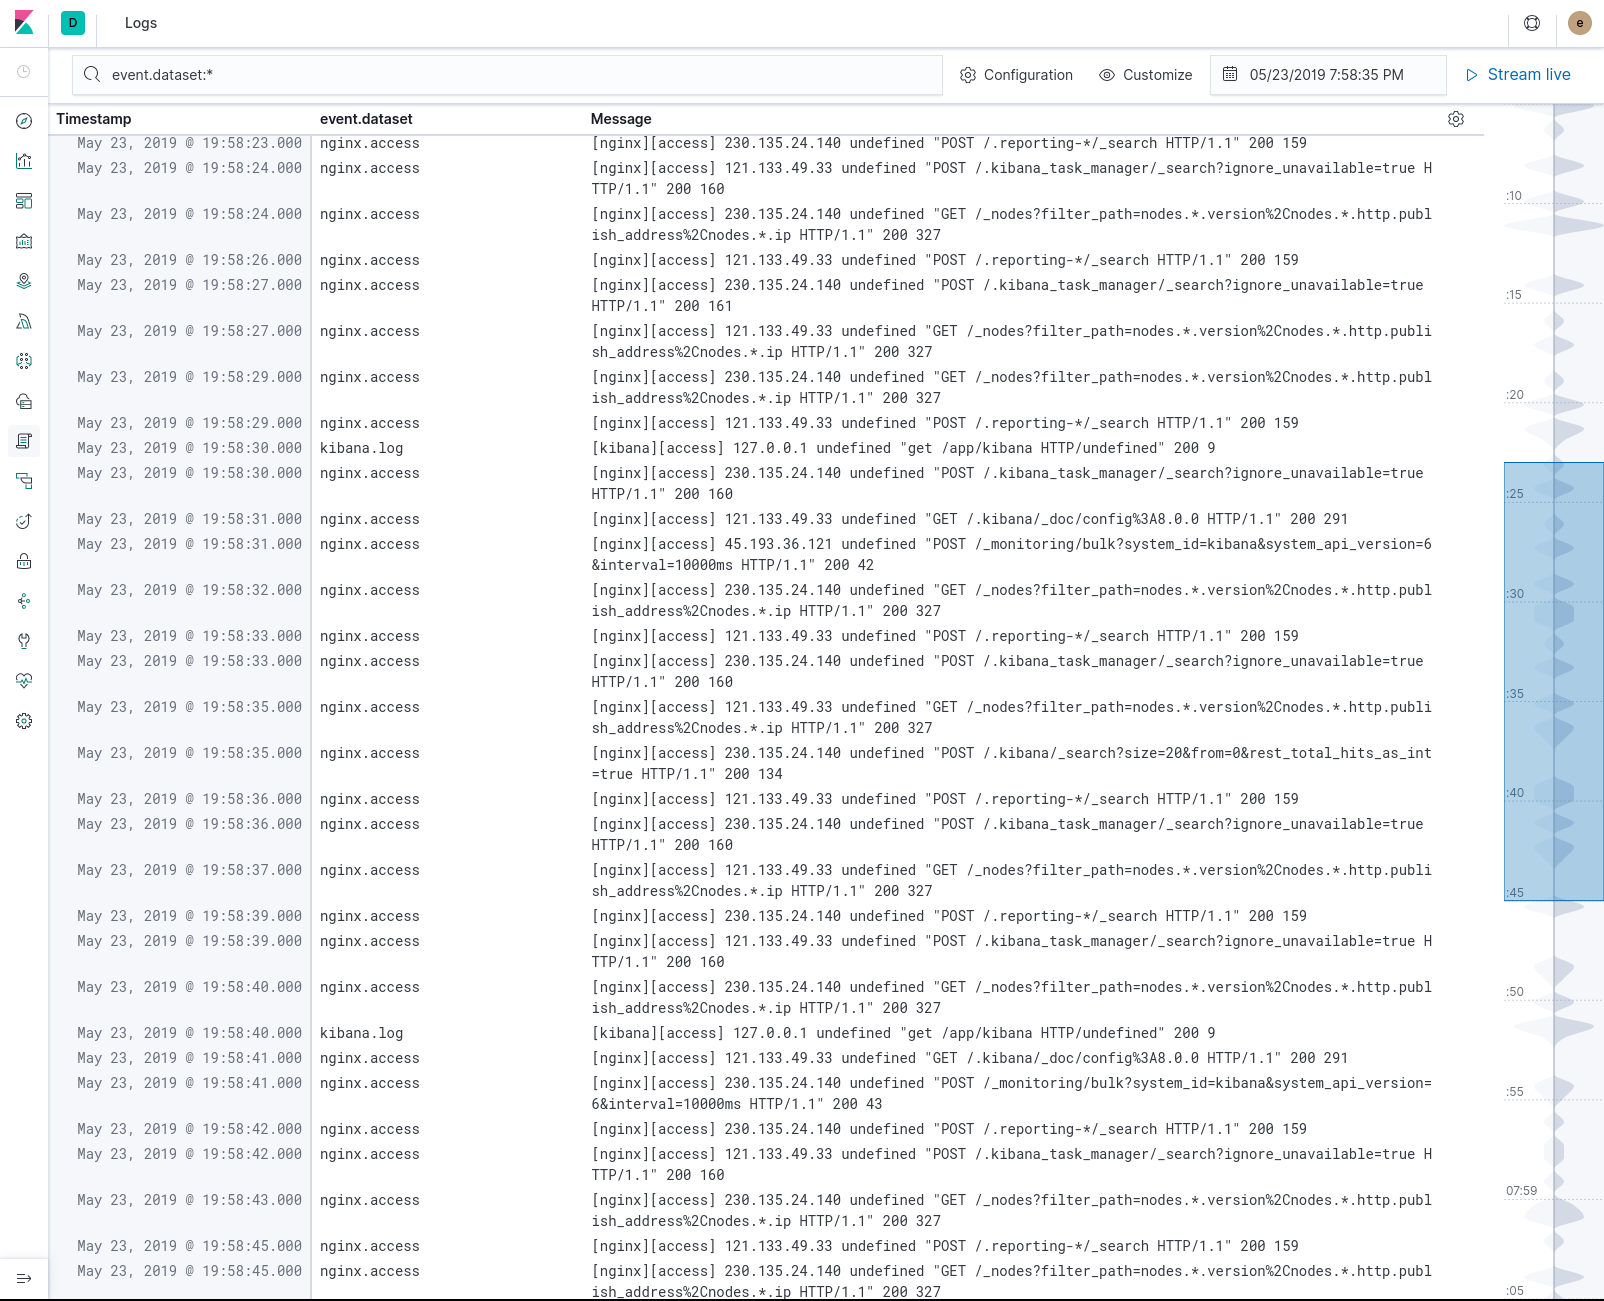
Using the Logs UI
editUsing the Logs UI
editCustomize the Logs UI to focus on the data you want to see and control how you see it.
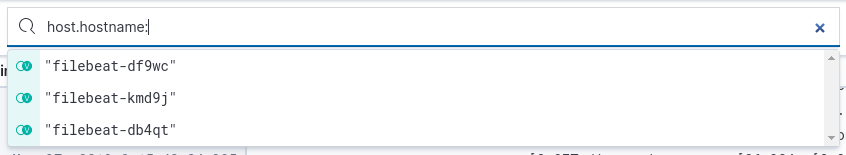
Use the power of Search
editThe Search bar is always available. Use it to perform adhoc and structured searches by taking advantage of the Kibana Query Language with autocompletion suggestions.
Adapt to your log source
editUsing a custom index pattern to store the log entries, want to limit the entries presented in a space or change the fields displayed in the columns? Use configure source to change the index pattern and other settings.

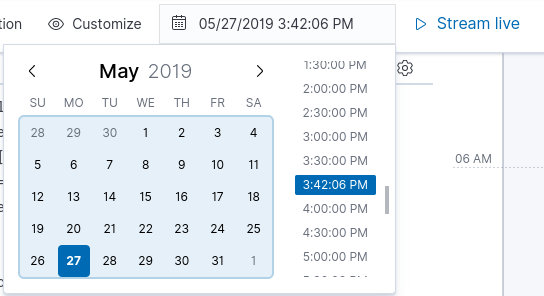
Jump to a specific time period
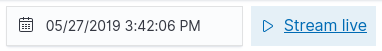
editUse the time selector to focus on a specific timeframe.
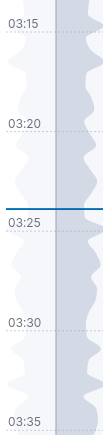
To quickly jump to a nearby point in time, click on the timeline to the right.
Customize your view
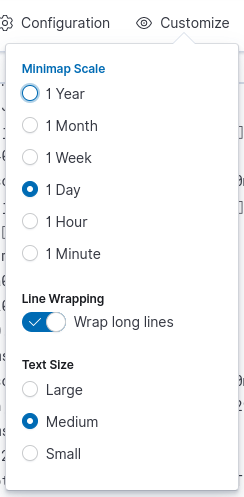
editUse Customize to adjust your console view and to set the time scale of the log data.
-
Text size. Select
Small,Medium, orLarge. - Wrap long lines. Enable or disable line wrap.
- Minimap Scale. Set the scale to year, month, week, day, hour, or minute.
Stream or pause logs
editYou can stream data for live log tailing, or pause streaming to focus on historical log data.

When you are streaming logs, the most recent log appears at the bottom on the console.
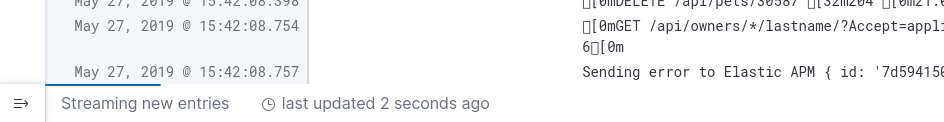
Historical data offers infinite scrolling.