Configuring the Logs UI
editConfiguring the Logs UI
editThe filebeat-* index pattern is used to query data by default. If your logs
are located in a different set of indices, use a different timestamp field, or
contain parsed fields which you want to expose as individual columns, you can
adjust the source configuration via the user interface or the Kibana
configuration file.
Logs and Infrastructure share a common data source definition in each space. Changes in one of them can influence the data displayed in the other.
Configure source
editConfigure source can be accessed via
![]() in the toolbar.
in the toolbar.
This opens the source configuration fly-out dialog with multiple tabs, where you can inspect and adjust various index settings and log column configuration.
If Spaces are enabled in your Kibana instance, any configuration changes performed via Configure source are specific to that space. You can therefore easily make different subsets of the data available by creating multiple spaces with different data source configurations.
Read only access
editWhen you have insufficient privileges to change the source configuration, the following indicator in Kibana will be displayed, and the buttons to change the source configuration won’t be visible. For more information, see Granting access to Kibana.
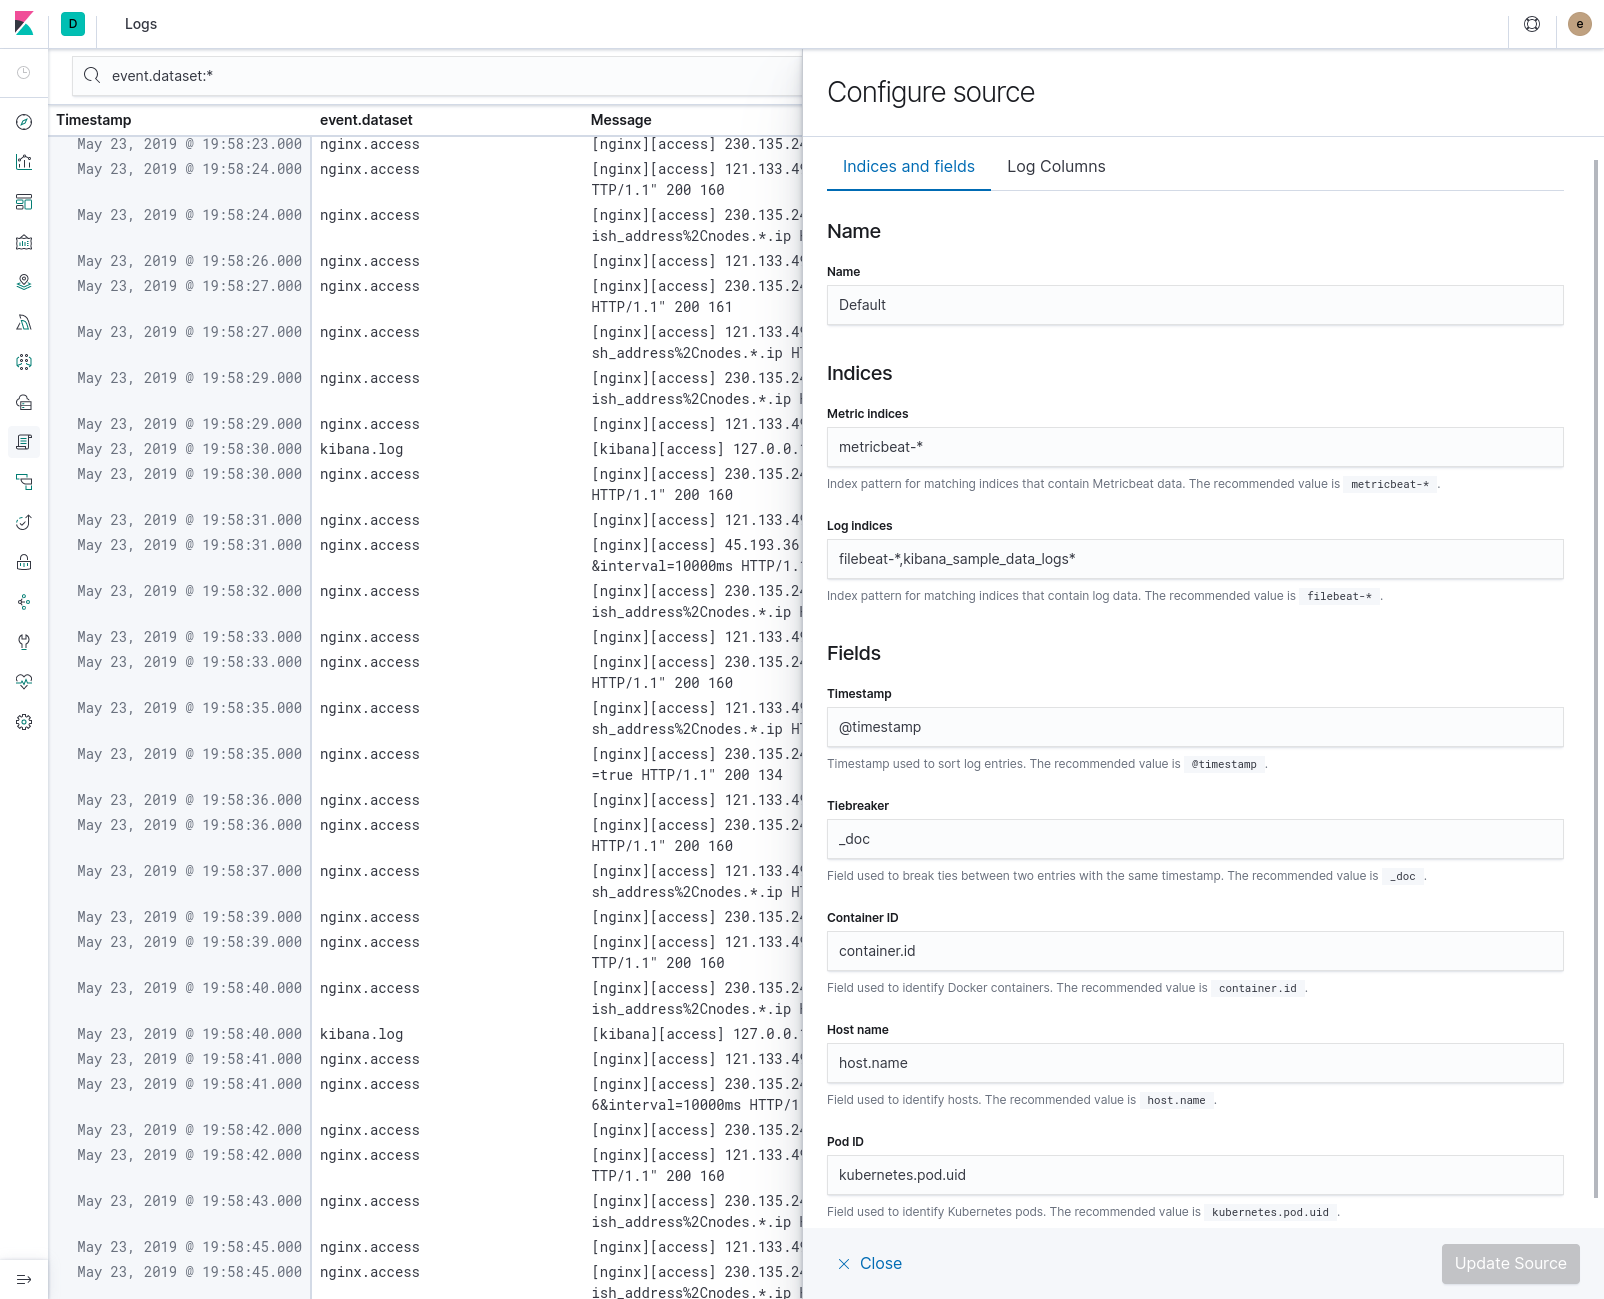
Indices and fields configuration
editThe Indices and fields tab provides access to the following configuration items:
- Name: The name of the source configuration.
- Indices: The patterns of the Elasticsearch indices to read metrics and logs from.
- Fields: The names of particular fields in the indices that need to be known to the Infrastructure and Logs UIs in order to query and interpret the data correctly.
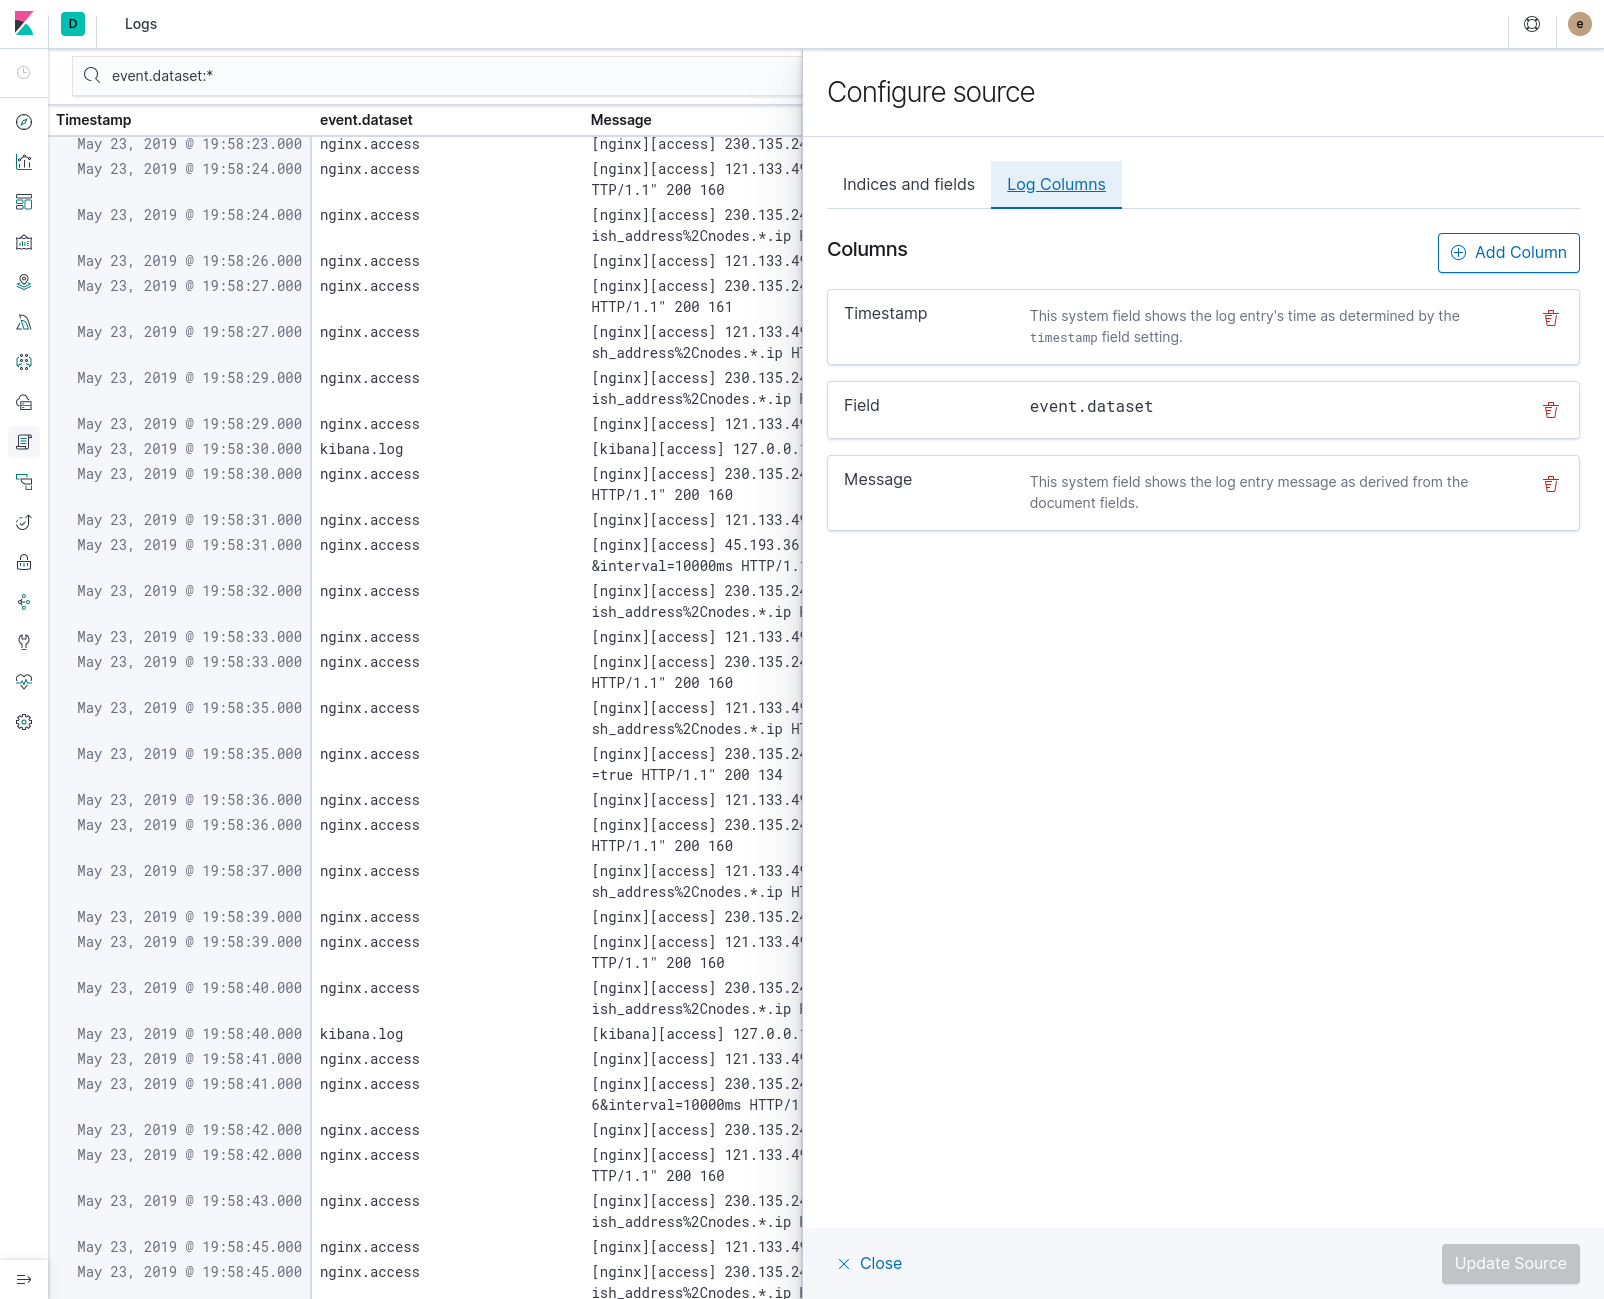
Log columns configuration
editThe Log columns tab enables you to change the set of columns that are displayed in the Logs UI. By default the following columns are shown:
-
Timestamp: The log entry’s timestamp as defined in the
timestampfield. - events.dataset: The event dataset as indicated by this Elastic Common Schema (ECS) field.
-
Message: The message extracted from the document. The exact content of that
field depends on the type of log message. If no special type is detected, the
Elastic Common Schema (ECS) field
messageis used.
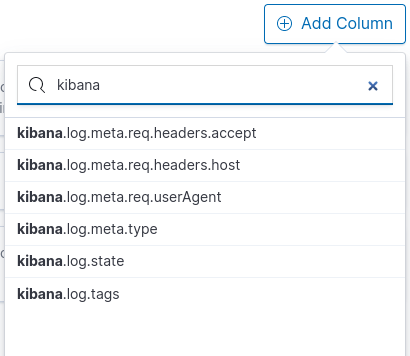
To add a new column, click
 above the list. This will cause a popover to be shown in which you can filter a
list of the available fields and select one for inclusion:
above the list. This will cause a popover to be shown in which you can filter a
list of the available fields and select one for inclusion:
To remove a column, click
 in the respective entry. The list must contain at least one column to apply the
changes.
in the respective entry. The list must contain at least one column to apply the
changes.
Configuration file
editThe settings in the configuration file are used as a fallback when no other
configuration for that space has been defined. They are located in the
configuration namespace xpack.infra.sources.default. See
Logs UI settings for a complete list of the possible entries.