Osquery
editOsquery
editOsquery is an open source tool that lets you query operating systems like a database, providing you with visibility into your infrastructure and operating systems. Using basic SQL commands, you can ask questions about devices, such as servers, Docker containers, and computers running Linux, macOS, or Windows. The extensive schema helps with a variety of use cases, including vulnerability detection, compliance monitoring, incident investigations, and more.
With Osquery in Kibana, you can:
- Run live queries for one or more agents
- Schedule query packs to capture changes to OS state over time
- View a history of past queries and their results
- Save queries and build a library of queries for specific use cases
Osquery is powered by the Osquery Manager integration. For information on how to set up Osquery Manager, refer to Manage the integration.
Required privileges
editTo use Osquery Manager, you must be assigned to a role with the following privileges:
-
Readprivileges for thelogs-osquery_manager.result*index. -
Kibana privileges for Osquery Manager. The
Allprivilege enables you to run, schedule, and save queries.Readenables you to view live and scheduled query results, but you cannot run live queries or edit.
Run live queries
editTo inspect hosts, run a query against one or more agents or policies, then view the results.
- Open the main menu, and then click Osquery.
- In the Live queries view, click New live query.
- Select one or more agents or groups to query. Start typing in the search field, and you’ll get suggestions for agents by name, ID, platform, and policy.
-
Enter a query or select a query from your saved queries.
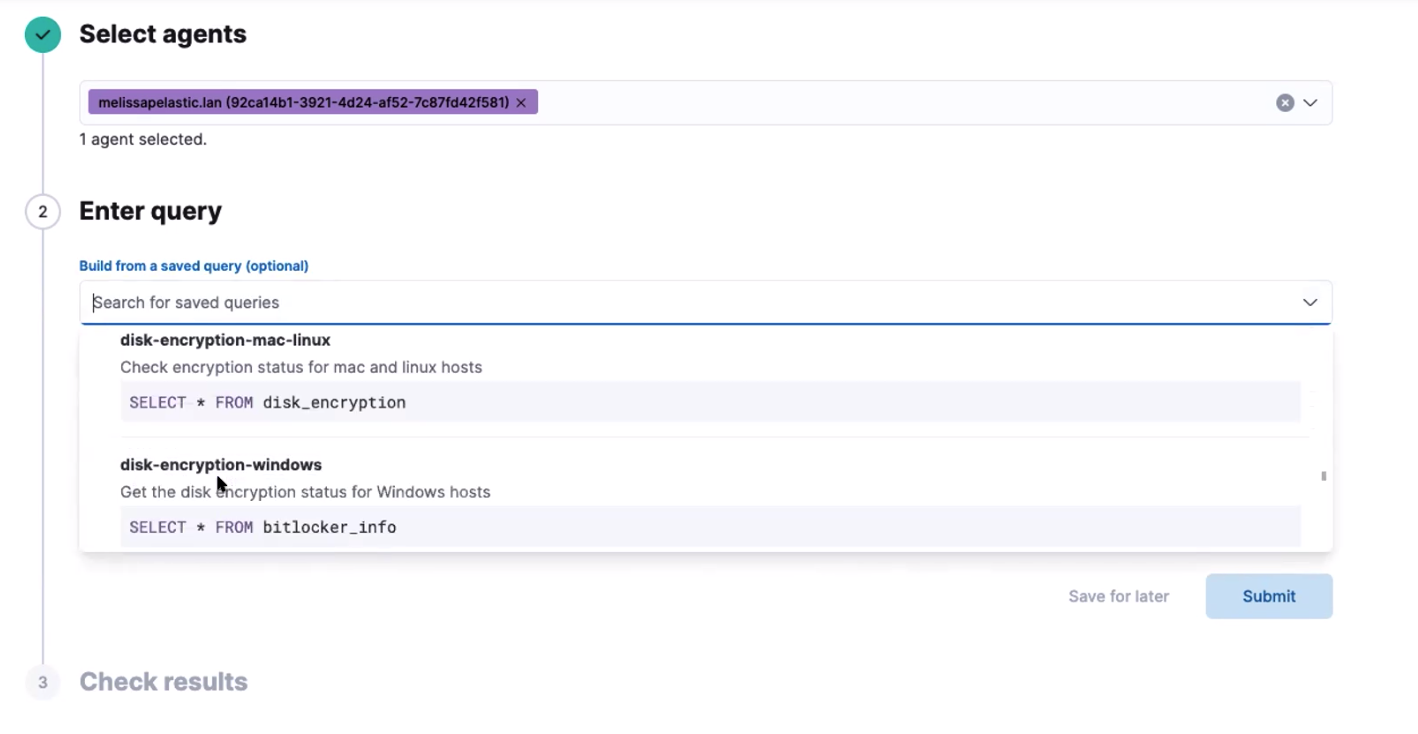
- (Optional) Expand the Advanced section to view or set mapped ECS fields included in the results from the live query.
- Click Submit.
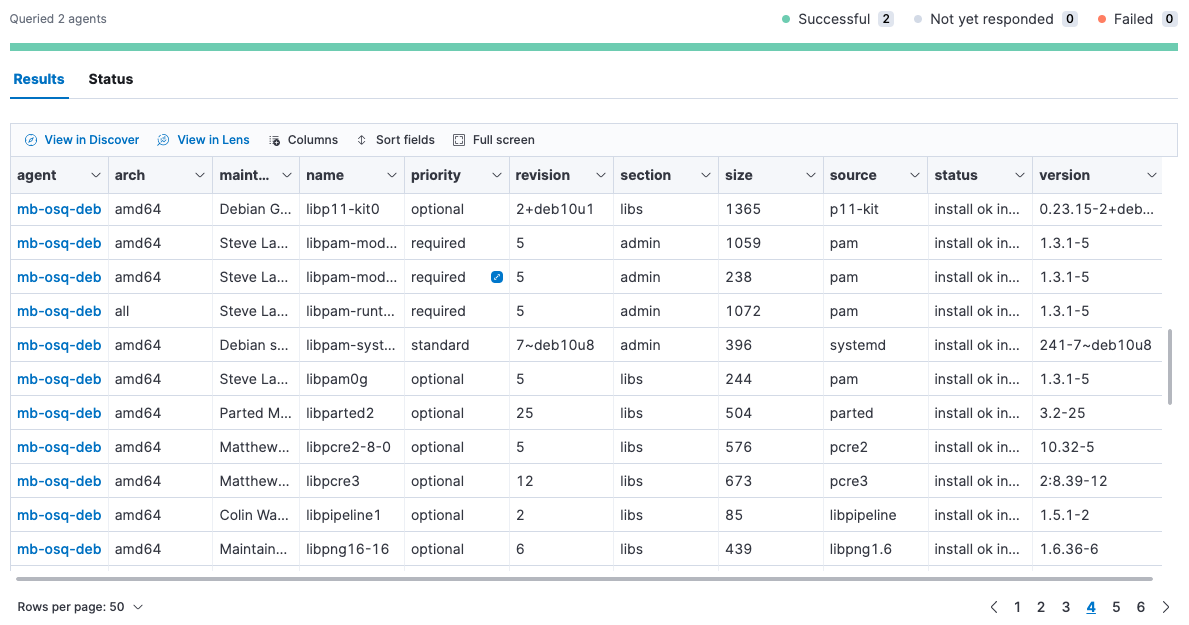
- Review the results in a table, or navigate to Discover to dive deeper into the response, or to the drag-and-drop Lens editor to create visualizations.
- To view more information about the request, such as failures, open the Status tab.
- To save the query for future use, click Save for later and define the ID, description, and other details.
View or rerun previous live queries
editFrom the Live queries history section on the Live queries tab:
Schedule queries with packs
editCreate packs to organize sets of queries. For example, you might create one pack that checks for IT compliance-type issues, and another pack that monitors for evidence of malware. You can schedule packs to run for one or more agent policies. When scheduled, queries in the pack are run at the set intervals for all agents in those policies. Scheduling packs is optional.
- Open the Packs tab.
- Click Add pack to create a new pack, or click the name of an existing pack, then Edit to add queries to an existing pack.
-
Provide the following fields:
- The name of the pack.
- A short description of the pack.
- The agent policies where this pack should run. If no agent policies are set, then the pack is not scheduled.
-
Add queries to schedule:
- To add a query to the pack, click Add query, and then either add a saved query or enter a new query. Each query must include a unique query ID and the interval at which it should run. Optionally, set the minimum Osquery version and platform, or map ECS fields. When you add a saved query to a pack, this adds a copy of the query. A connection is not maintained between saved queries and packs.
-
To upload queries from a
.confquery pack, drag the pack to the drop zone under the query table. To explore the community packs that Osquery publishes, click Example packs.
- Click Save pack. The queries run when the policy receives the update.
View status of scheduled packs
edit- Open the Packs tab.
-
Click a pack name to view the status.
Details include the last time each query ran, how many results were returned, and the number of agents the query ran against. If there are errors, expand the row to view the details.
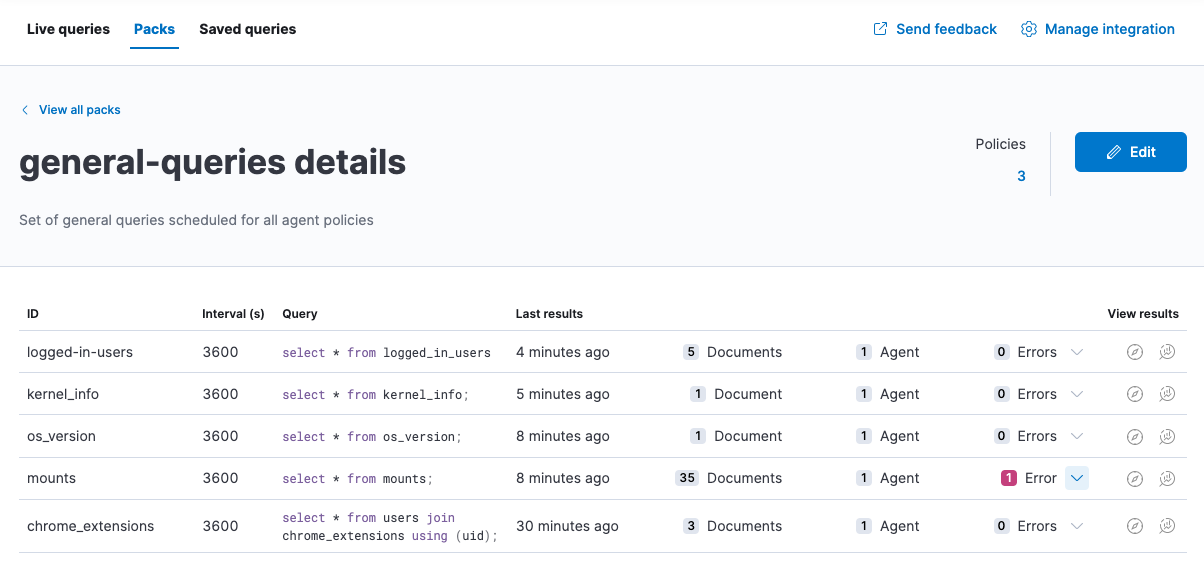
- View scheduled query results in Discover or the drag-and-drop Lens editor.
Save queries
editYou can save queries in two ways:
- After running a live query, click the Save for later link.
- From the Saved queries tab, click the Add saved query button.
Once you save a query, you can only edit it from the Saved queries tab.
To add or edit saved queries from the Saved queries tab:
- Go to Saved queries, and then click Add saved query or the edit icon.
-
Provide the following fields:
- The unique identifier.
- A brief description.
- The SQL query.
- The ECS fields to populate when the query is run. These fields are also copied in when you add this query to a pack.
-
The defaults to set when you add the query to a pack.
- The frequency to run the query.
- The minimum version of Osquery required to run the query.
- The operating system required to run the query. For information about supported platforms per table, refer to the Osquery schema.
-
Click Test configuration to test the query and any mapped fields:
-
From the Test query panel, select agents or groups to test the query, then click Submit to run a live query. Result columns with the
 icon are mapped. Hover over the icon to see the mapped ECS field.
-
From the Test query panel, select agents or groups to test the query, then click Submit to run a live query. Result columns with the
- Click Save or Update.
Map result fields to ECS
editWhen you save queries or add queries to a pack, you can optionally map Osquery results or static values to fields in
the Elastic Common Schema (ECS).
This standardizes your Osquery data for use across detections, machine learning,
and any other areas that rely on ECS-compliant data.
When the query is run, the results include the original osquery.<fields>
and the mapped ECS fields. For example, if you update a query to map osquery.name to user.name, the query results include both fields.
-
Edit saved queries or queries in a pack to map fields:
- For Saved queries: Open the Saved queries tab, and then click the edit icon for the query that you want to map.
- For packs: Open the Packs tab, edit a pack, and then click the edit icon for the query that you want to map.
- In the ECS mapping section, select an ECS field to map.
-
In the Value column, use the dropdown on the left to choose what type of value to map to the ECS field:
- Osquery value: Select an Osquery field. The fields available are based on the SQL query entered, and only include fields that the query returns. When the query runs, the ECS field is set dynamically to the value of the Osquery field selected.
-
Static value: Enter a static value. When the query runs, the ECS field is set to the value entered. For example, static fields can be used to apply
tagsor your preferredevent.categoryto the query results.
- Map more fields, as needed. To remove any mapped rows, click the delete icon.
- Save your changes.
- Some ECS fields are restricted and cannot be mapped. These are not available in the ECS dropdown.
- Some ECS fields are restricted to a set of allowed values, like event.category. Use the ECS Field Reference for help when mapping fields.
- Osquery date fields have a variety of data types (including integer, text, or bigint). When mapping an Osquery date field to an ECS date field, you might need to use SQL operators in the query to get an Elasticsearch-compatible date type.
Extended tables for Kubernetes queries
editIn addition to the Osquery schema, the Elastic-provided version of Osquery also includes the following tables to support Kubernetes containers. These can be queried with live or scheduled queries.
-
host_users -
host_groups -
host_processes
When querying these tables, the expectation is that the /etc/passwd, /etc/group, and /proc are available in the container under /hostfs as:
/hostfs/etc/passwd, /hostfs/etc/group, and /hostfs/proc. For information about the fields available in these tables, see the
exported fields reference.
Osquery status
editA query can have the following status:
Successful |
The query successfully completed. |
Failed |
The query encountered a problem, such as an issue with the query or the agent was disconnected, and might have failed. |
Not yet responded |
The query has not been sent to the agent. |
Expired |
The action request timed out. The agent may be offline. |
If an agent is offline, the request status remains pending as Kibana retries the request. By default, a query request times out after five minutes. The time out applies to the time it takes to deliver the action request to an agent to run a query. If the action completes after the timeout period, the results are still returned.
Osquery results
editWhen you run live or scheduled queries, the results are automatically stored in an Elasticsearch index, so that you can search, analyze, and visualize this data in Kibana. For a list of the Osquery fields that can be returned in query results, refer to exported fields. Query results can also include ECS fields, if the query has a defined ECS mapping.
Osquery responses include the following information:
-
Everything prefaced with
osquery.is part of the query response. These fields are not mapped to ECS by default. -
Results include some ECS fields by default, such as
host.*andagent.*, which provide information about the host that was queried. -
For live queries, the
action_data.queryis the query that was sent. -
For scheduled queries in a pack, the
action_idhas the formatpack_<pack-name>_<query-ID>. You can use this information to look up the query that was run. - By default, all query results are snapshot logs that represent a point in time with a set of results, with no differentials.
-
Osquery data is stored in the
logs-osquery_manager.result-<namespace>datastream, and the result row data is under theosqueryproperty in the document.
Manage the integration
editSystem requirements
edit- Fleet is enabled on your cluster, and one or more Elastic Agents is enrolled.
- The Osquery Manager integration has been added and configured for an agent policy through Fleet. This integration supports x64 architecture on Windows, MacOS, and Linux platforms, and ARM64 architecture on Linux.
The original Filebeat Osquery module and the Osquery integration collect logs from self-managed Osquery deployments. The Osquery Manager integration manages Osquery deployments and supports running and scheduling queries from Kibana.
Customize Osquery sub-feature privileges
editDepending on your subscription level, you can further customize the sub-feature privileges for Osquery Manager. These include options to grant specific access for running live queries, running saved queries, saving queries, and scheduling packs. For example, you can create roles for users who can only run live or saved queries, but who cannot save or schedule queries. This is useful for teams who need in-depth and detailed control.
Customize Osquery configuration
edit[preview] This functionality is in technical preview and may be changed or removed in a future release. Elastic will work to fix any issues, but features in technical preview are not subject to the support SLA of official GA features. By default, all Osquery Manager integrations share the same osquery configuration. However, you can customize how Osquery is configured by editing the Osquery Manager integration for each agent policy you want to adjust. The custom configuration is then applied to all agents in the policy. This powerful feature allows you to configure File Integrity Monitoring, Process auditing, and others.
- Take caution when editing this configuration. The changes you make are distributed to all agents in the policy.
-
Take caution when editing
packsusing the Advanced Osquery config field. Any changes you make topacksfrom this field are not reflected in the UI on the Osquery Packs page in Kibana, however, these changes are deployed to agents in the policy. While this allows you to use advanced Osquery functionality like pack discovery queries, you do lose the ability to manage packs defined this way from the Osquery Packs page.
- From the Kibana main menu, click Fleet, then the Agent policies tab.
- Click the name of the agent policy where you want to adjust the Osquery configuration. The configuration changes you make only apply to the policy you select.
- Click the name of the Osquery Manager integration, or add the integration first if the agent policy does not yet have it.
- From the Edit Osquery Manager integration page, expand the Advanced section.
-
Edit the Osquery config JSON field to apply your preferred Osquery configuration. Note the following:
-
The field may already have content if you have scheduled packs for this agent policy. To keep these packs scheduled, do not remove the
packssection. - Refer to the Osquery documentation for configuration options.
- Some fields are protected and cannot be set. A warning is displayed with details about which fields should be removed.
-
(Optional) To load a full configuration file, drag and drop an Osquery
.conffile into the area at the bottom of the page.
-
The field may already have content if you have scheduled packs for this agent policy. To keep these packs scheduled, do not remove the
-
Click Save integration to apply the custom configuration to all agents in the policy.
As an example, the following configuration disables two tables.
{
   "options":{
      "disable_tables":"curl,process_envs"
   }
}
Upgrade Osquery versions
editThe Osquery version available on an Elastic Agent is associated to the version of Osquery Beat on the Agent. To get the latest version of Osquery Beat, upgrade your Elastic Agent.
Debug issues
editIf you encounter issues with Osquery Manager, find the relevant logs for Elastic Agent and Osquerybeat in the agent directory. Refer to the Fleet Installation layout to find the log file location for your OS.
../data/elastic-agent-*/logs/elastic-agent-json.log-*
../data/elastic-agent-*/logs/default/osquerybeat-json.log
To get more details in the logs, change the agent logging level to debug:
- Open the main menu, and then select Fleet.
- Select the agent that you want to debug.
-
On the Logs tab, change the Agent logging level to debug, and then click Apply changes.
agent.logging.levelis updated infleet.yml, and the logging level is changed todebug.