Osquery
editOsquery
editOsquery is an open source tool that lets you query operating systems, like a database, providing you with visibility into your infrastructure and operating systems. Using basic SQL commands, you can ask questions about devices, such as servers, Docker containers, and computers running Linux, macOS, or Windows. The extensive schema helps with a variety of use cases, including vulnerability detection, compliance monitoring, incident investigations, and more.
With Osquery, you can:
- Run live queries for one or more agents
- Schedule queries to capture changes to OS state over time
- View a history of past queries and their results
- Save queries and build a library of queries for specific use cases
Osquery results are stored in Elasticsearch, so that you can search, analyze, and visualize Osquery data in Kibana.
Osquery is powered by the Osquery Manager integration. For information on how to set up Osquery Manager, refer to Manage the integration.
Required privileges
editTo use Osquery Manager, you must be assigned to a role with the following privileges:
-
Readprivileges for thelogs-osquery_manager.result*index. -
Kibana privileges for Osquery Manager. The
Allprivilege enables you to run, schedule, and save queries.Readenables you to view live and scheduled query results, but you cannot run live queries or edit.
Run live queries
editTo inspect a host or test queries you want to schedule, run a query against one or more agents or policies, and view the results.
- Open the main menu, and then click Osquery.
- In the Live queries view, click New live query.
- Select one or more agents or groups to query. Start typing in the search field, and you’ll get suggestions for agents by name, ID, platform, and policy.
-
Enter a query or select a query from your saved queries.
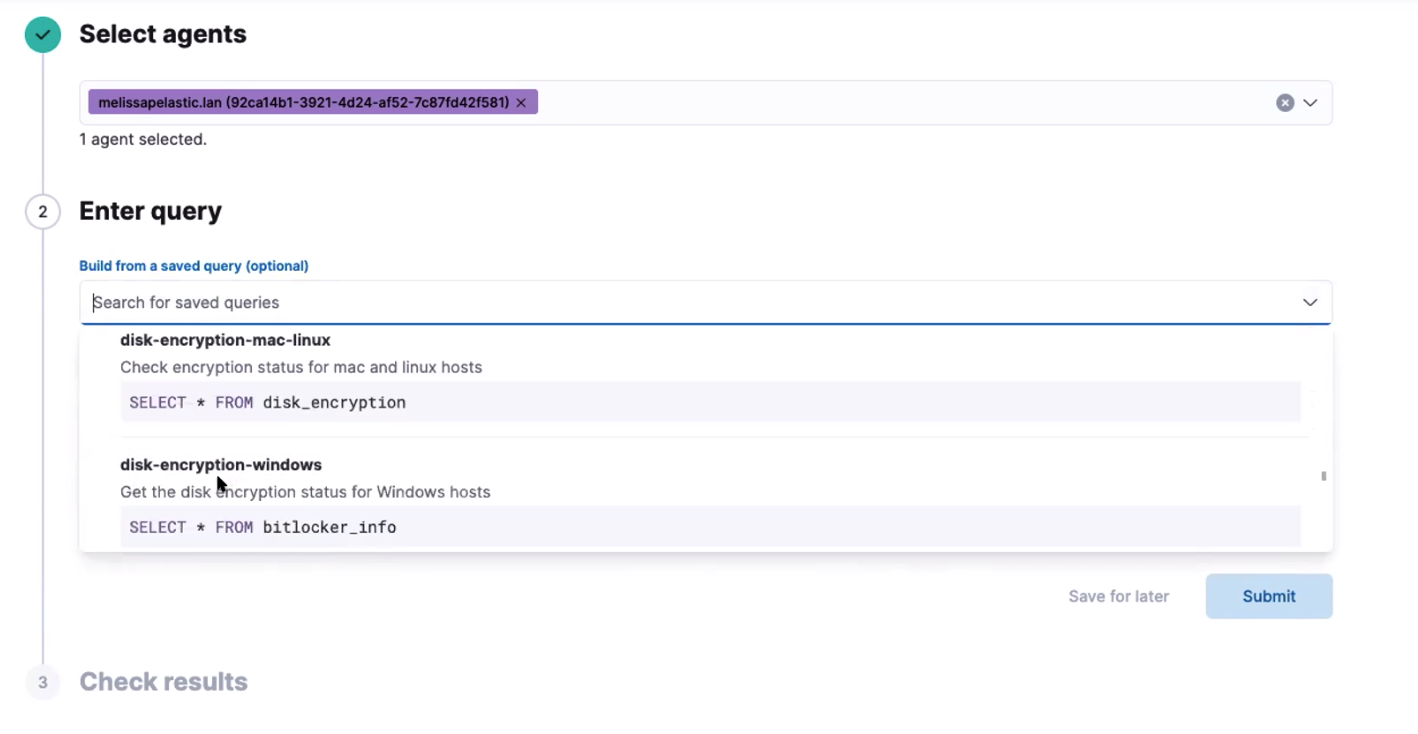
- Click Submit.
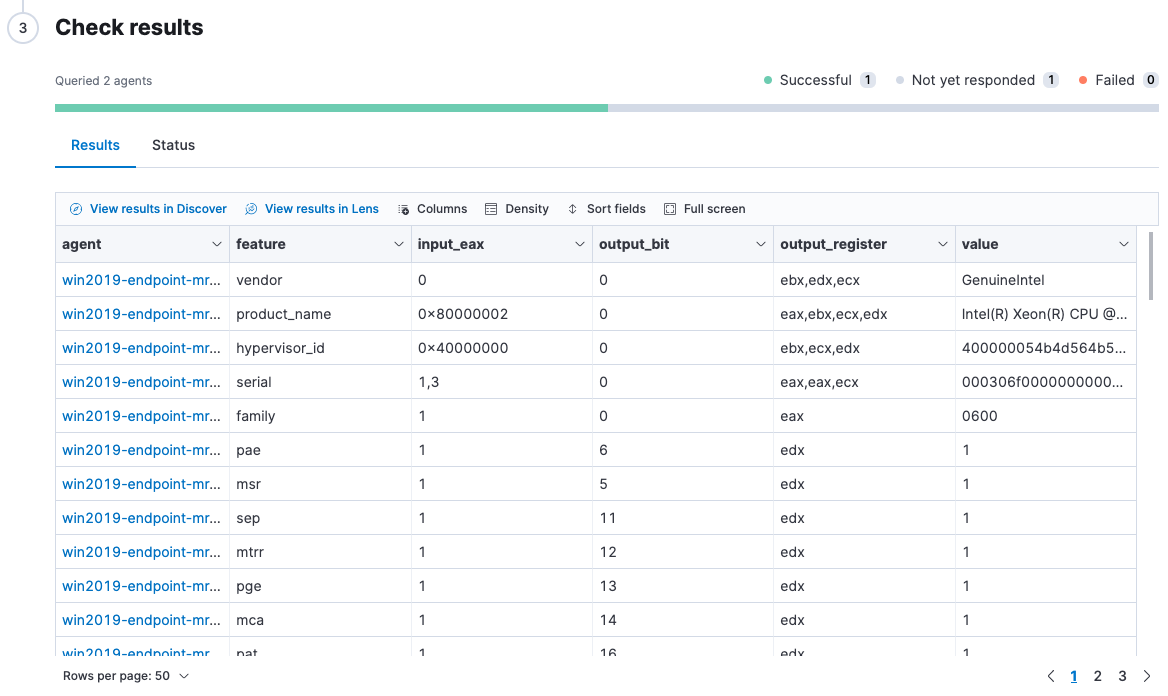
- Review the results in a table, or navigate to Discover to dive deeper into the response, or to the drag-and-drop Lens editor to create visualizations.
- To view more information about the request, such as failures, open the Status tab.
- To optionally save the query for future use, click Save for later and define the ID, description, and other details.
To view a history of the past queries you have run, open the Live queries history.
Schedule queries
editGroup and schedule queries to run on a specified interval, in seconds. For example, you might create a group that checks for IT compliance-type issues, and another group that monitors for evidence of malware.
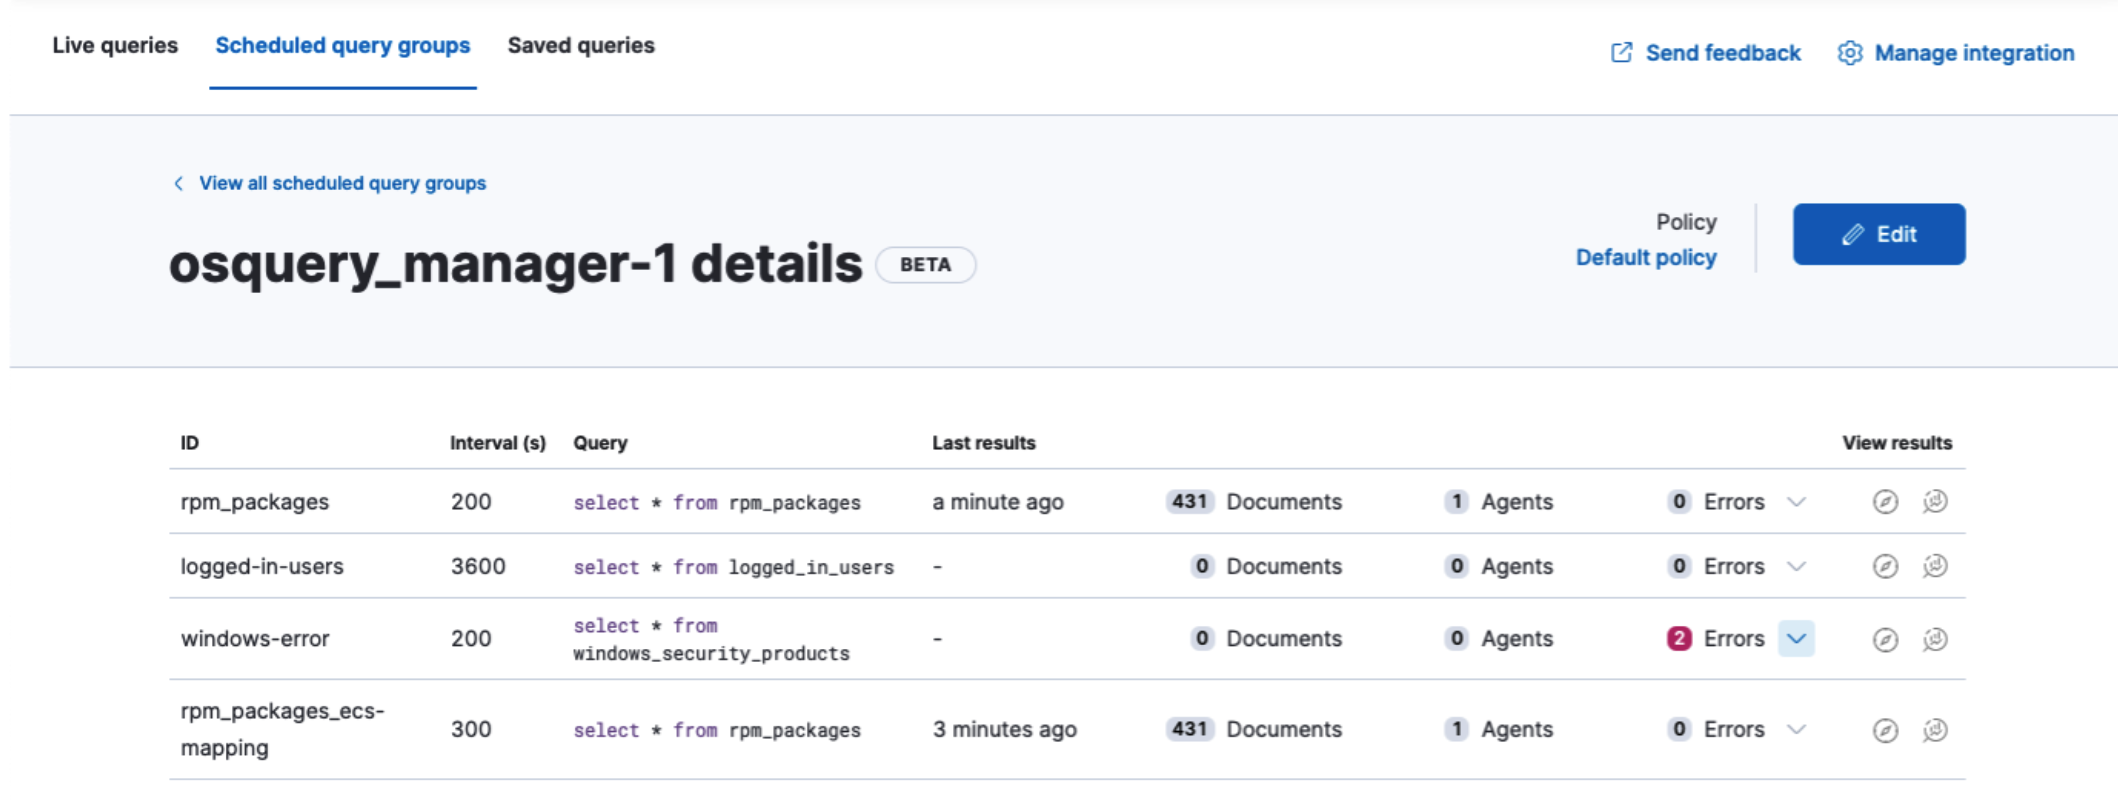
- Open the Scheduled query groups tab.
-
Click a group name to view the details.
Details include the last time each query ran, how many results were returned, and the number of agents the query ran against. If there are errors, expand the row to view the details.
-
To make changes, click Edit.
- To add a query to the group, click Add query, and then enter the query ID and interval. Optionally, set the minimum Osquery version and platform, or map ECS fields.
- To upload queries from a .conf query pack, drag the pack to the drop zone under the query table. To explore the community packs that Osquery publishes, click Example packs.
- Click Save query. The queries run when the policy receives the update.
- View scheduled history results in Discover> or the drag-and-drop <<lens,Lens editor.
Map Osquery fields to ECS fields
editWhen you schedule queries, you can optionally map query results to fields in
the Elastic Common Schema (ECS),
which standardizes your Osquery data for use across detections, machine learning,
and any other areas that rely on ECS-compliant data.
The query results include the original osquery.<field>
and the mapped ECS field. For example, if you update a query to map osquery.name to user.name, the query results include both fields.
- Edit a scheduled query group, and then click the edit icon for the query that you want to map.
-
In ECS mapping, select the Osquery result fields you want to map to ECS fields.
The fields available in the Osquery.results column are based on the SQL query entered, and only include fields that the query returns.
When mapping fields:
- To add a new row for additional fields to map, click the plus icon.
- To remove any mapped rows, click the trash icon.
- To save changes to the query, click Save.
- To save changes to the group, click Save query.
Edit saved queries
editAdd or edit saved queries to the Saved queries tab.
- Go to the saved queries, then click Add saved query or the edit icon.
-
Provide the following fields:
- The unique identifier.
- A brief description.
- The SQL query.
-
The defaults for the scheduled query group, which is included when you add the query to a scheduled query group.
- The frequency to run the query.
- The minimum version of Osquery required to run the query.
- The operating system required to run the query. For information about supported platforms per table, click OSquery schema in the Edit query flyout.
- Click Save query.
Osquery status
editA query can have the following status:
Successful |
The query successfully completed. |
Failed |
The query encountered a problem, such as an issue with the query or the agent was disconnected, and might have failed. |
Not yet responded |
The query has not been sent to the agent. |
Expired |
The action request timed out. The agent may be offline. |
If an agent is offline, the request status remains pending as Kibana retries the request. By default, a query request times out after five minutes. The time out applies to the time it takes to deliver the action request to an agent to run a query. If the action completes after the timeout period, the results are still returned.
Osquery results
editFor the fields that can be returned in Osquery results, refer to exported fields. Scheduled Osquery results can also include ECS fields, if the query has a defined ECS mapping.
Osquery responses include the following information:
-
Everything prefaced with
osquery.is part of the query response. These fields are not mapped to ECS. -
By default, the
host.*andagent.*fields are mapped to ECS. -
The
action_data.queryhas the query that was sent. - All query results are snapshot logs that represent a point in time with a set of results, with no differentials. Differential logs are unsupported.
-
Osquery data is stored in the
logs-osquery_manager.result-defaultdatastream, and the result row data is under theosqueryproperty in the document.
The following example shows a successful Osquery result:
{
  "_index": ".ds-logs-osquery_manager.result-default-2021.04.12-2021.04.12-000001",
  "_id": "R3ZwxngBKwN-X8eyQbxy",
  "_version": 1,
  "_score": null,
  "fields": {
    "osquery.seconds": [
      "7"
    ],
    "action_data.id": [
      "72d3ec71-7635-461e-a15d-f728819ae27f"
    ],
    "osquery.seconds.number": [
      7
    ],
    "osquery.hours.number": [
      6
    ],
    "host.hostname": [
      "MacBook-Pro.local"
    ],
    "type": [
      "MacBook-Pro.local"
    ],
    "host.mac": [
      "ad:de:48:00:12:22",
      "a6:83:e7:cb:91:ee"
    ],
    "osquery.total_seconds.number": [
      1060627
    ],
    "host.os.build": [
      "20D91"
    ],
    "host.ip": [
      "192.168.31.171",
      "fe80::b5b1:39ff:faa1:3b39"
    ],
    "agent.type": [
      "osquerybeat"
    ],
    "action_data.query": [
      "select * from uptime;"
    ],
    "osquery.minutes": [
      "37"
    ],
    "action_id": [
      "5099c02d-bd6d-4b88-af90-d80dcdc945df"
    ],
    "host.os.version": [
      "10.16"
    ],
    "host.os.kernel": [
      "20.3.0"
    ],
    "host.os.name": [
      "Mac OS X"
    ],
    "agent.name": [
      "MacBook-Pro.local"
    ],
    "host.name": [
      "MacBook-Pro.local"
    ],
    "osquery.total_seconds": [
      "1060627"
    ],
    "host.id": [
      "155D977D-8EA8-5BDE-94A2-D78A7B545198"
    ],
    "osquery.hours": [
      "6"
    ],
    "osquery.days": [
      "12"
    ],
    "host.os.type": [
      "macos"
    ],
    "osquery.days.number": [
      12
    ],
    "host.architecture": [
      "x86_64"
    ],
    "@timestamp": [
      "2021-04-12T14:15:45.060Z"
    ],
    "agent.id": [
      "196a0086-a612-48b1-930a-300565b3efaf"
    ],
    "host.os.platform": [
      "darwin"
    ],
    "ecs.version": [
      "1.8.0"
    ],
    "agent.ephemeral_id": [
      "5cb88e34-50fe-4c13-b81c-d2b7187505ea"
    ],
    "agent.version": [
      "7.13.0"
    ],
    "host.os.family": [
      "darwin"
    ],
    "osquery.minutes.number": [
      37
    ]
  }
}
The following is an example of an error response for an undefined action query:
{
  "_index": ".ds-.fleet-actions-results-2021.04.10-000001",
  "_id": "qm7mvHgBKwN-X8eyYB1x",
  "_version": 1,
  "_score": null,
  "fields": {
    "completed_at": [
      "2021-04-10T17:48:32.268Z"
    ],
    "error.keyword": [
      "action undefined"
    ],
    "@timestamp": [
      "2021-04-10T17:48:32.000Z"
    ],
    "action_data.query": [
      "select * from uptime;"
    ],
    "action_data.id": [
      "2c95bb2c-8ab6-4e8c-ac01-a1abb693ea00"
    ],
    "agent_id": [
      "c21b4c9c-6f36-49f0-8b60-08490fc619ce"
    ],
    "action_id": [
      "53454d3b-c8cd-4a50-b5b4-f85da17b4be2"
    ],
    "started_at": [
      "2021-04-10T17:48:32.267Z"
    ],
    "error": [
      "action undefined"
    ]
  }
}
Manage the integration
editSystem requirements
edit- Fleet is enabled on your cluster, and one or more Elastic Agents is enrolled.
- The Osquery Manager integration has been added and configured for an agent policy through Fleet. This integration supports x64 architecture on Windows, MacOS, and Linux platforms, and ARM64 architecture on Linux.
The original Filebeat Osquery module and the Osquery Log Collection integration collect logs from self-managed Osquery deployments. The Osquery Manager integration manages Osquery deployments and supports running and scheduling queries from Kibana.
Customize Osquery sub-feature privileges
editDepending on your subscription level, you can further customize the sub-feature privileges for Osquery Manager. These include options to grant specific access for running live queries, running saved queries, saving queries, and scheduling queries. For example, you can create roles for users who can only run live or saved queries, but who cannot save or schedule queries. This is useful for teams who need in-depth and detailed control.
Upgrade Osquery versions
editThe Osquery version available on an Elastic Agent is associated to the version of Osquery Beat on the Agent. To get the latest version of Osquery Beat, upgrade your Elastic Agent.
Debug issues
editIf you encounter issues with Osquery Manager, find the relevant logs for the Elastic Agent and Osquerybeat in the installed agent directory, then adjust the agent path for your setup.
The relevant logs look similar to the following example paths:
`/data/elastic-agent-054e22/logs/elastic-agent-json.log-*`
`/data/elastic-agent-054e22/logs/default/osquerybeat-json.log`
To get more details in the logs, change the agent logging level to debug:
- Open the main menu, and then select Fleet.
- Select the agent that you want to debug.
-
On the Logs tab, change the Agent logging level to debug, and then click Apply changes.
agent.logging.levelis updated infleet.yml, and the logging level is changed todebug.