Alerts and rules
editAlerts and rules
editThe APM app allows you to define rules to detect complex conditions within your APM data and trigger built-in actions when those conditions are met.
The following rules are supported:
- Latency anomaly rule: Alert when latency of a service is abnormal
- Transaction error rate threshold rule: Alert when the service’s transaction error rate is above the defined threshold
- Error count threshold rule: Alert when the number of errors in a service exceeds a defined threshold
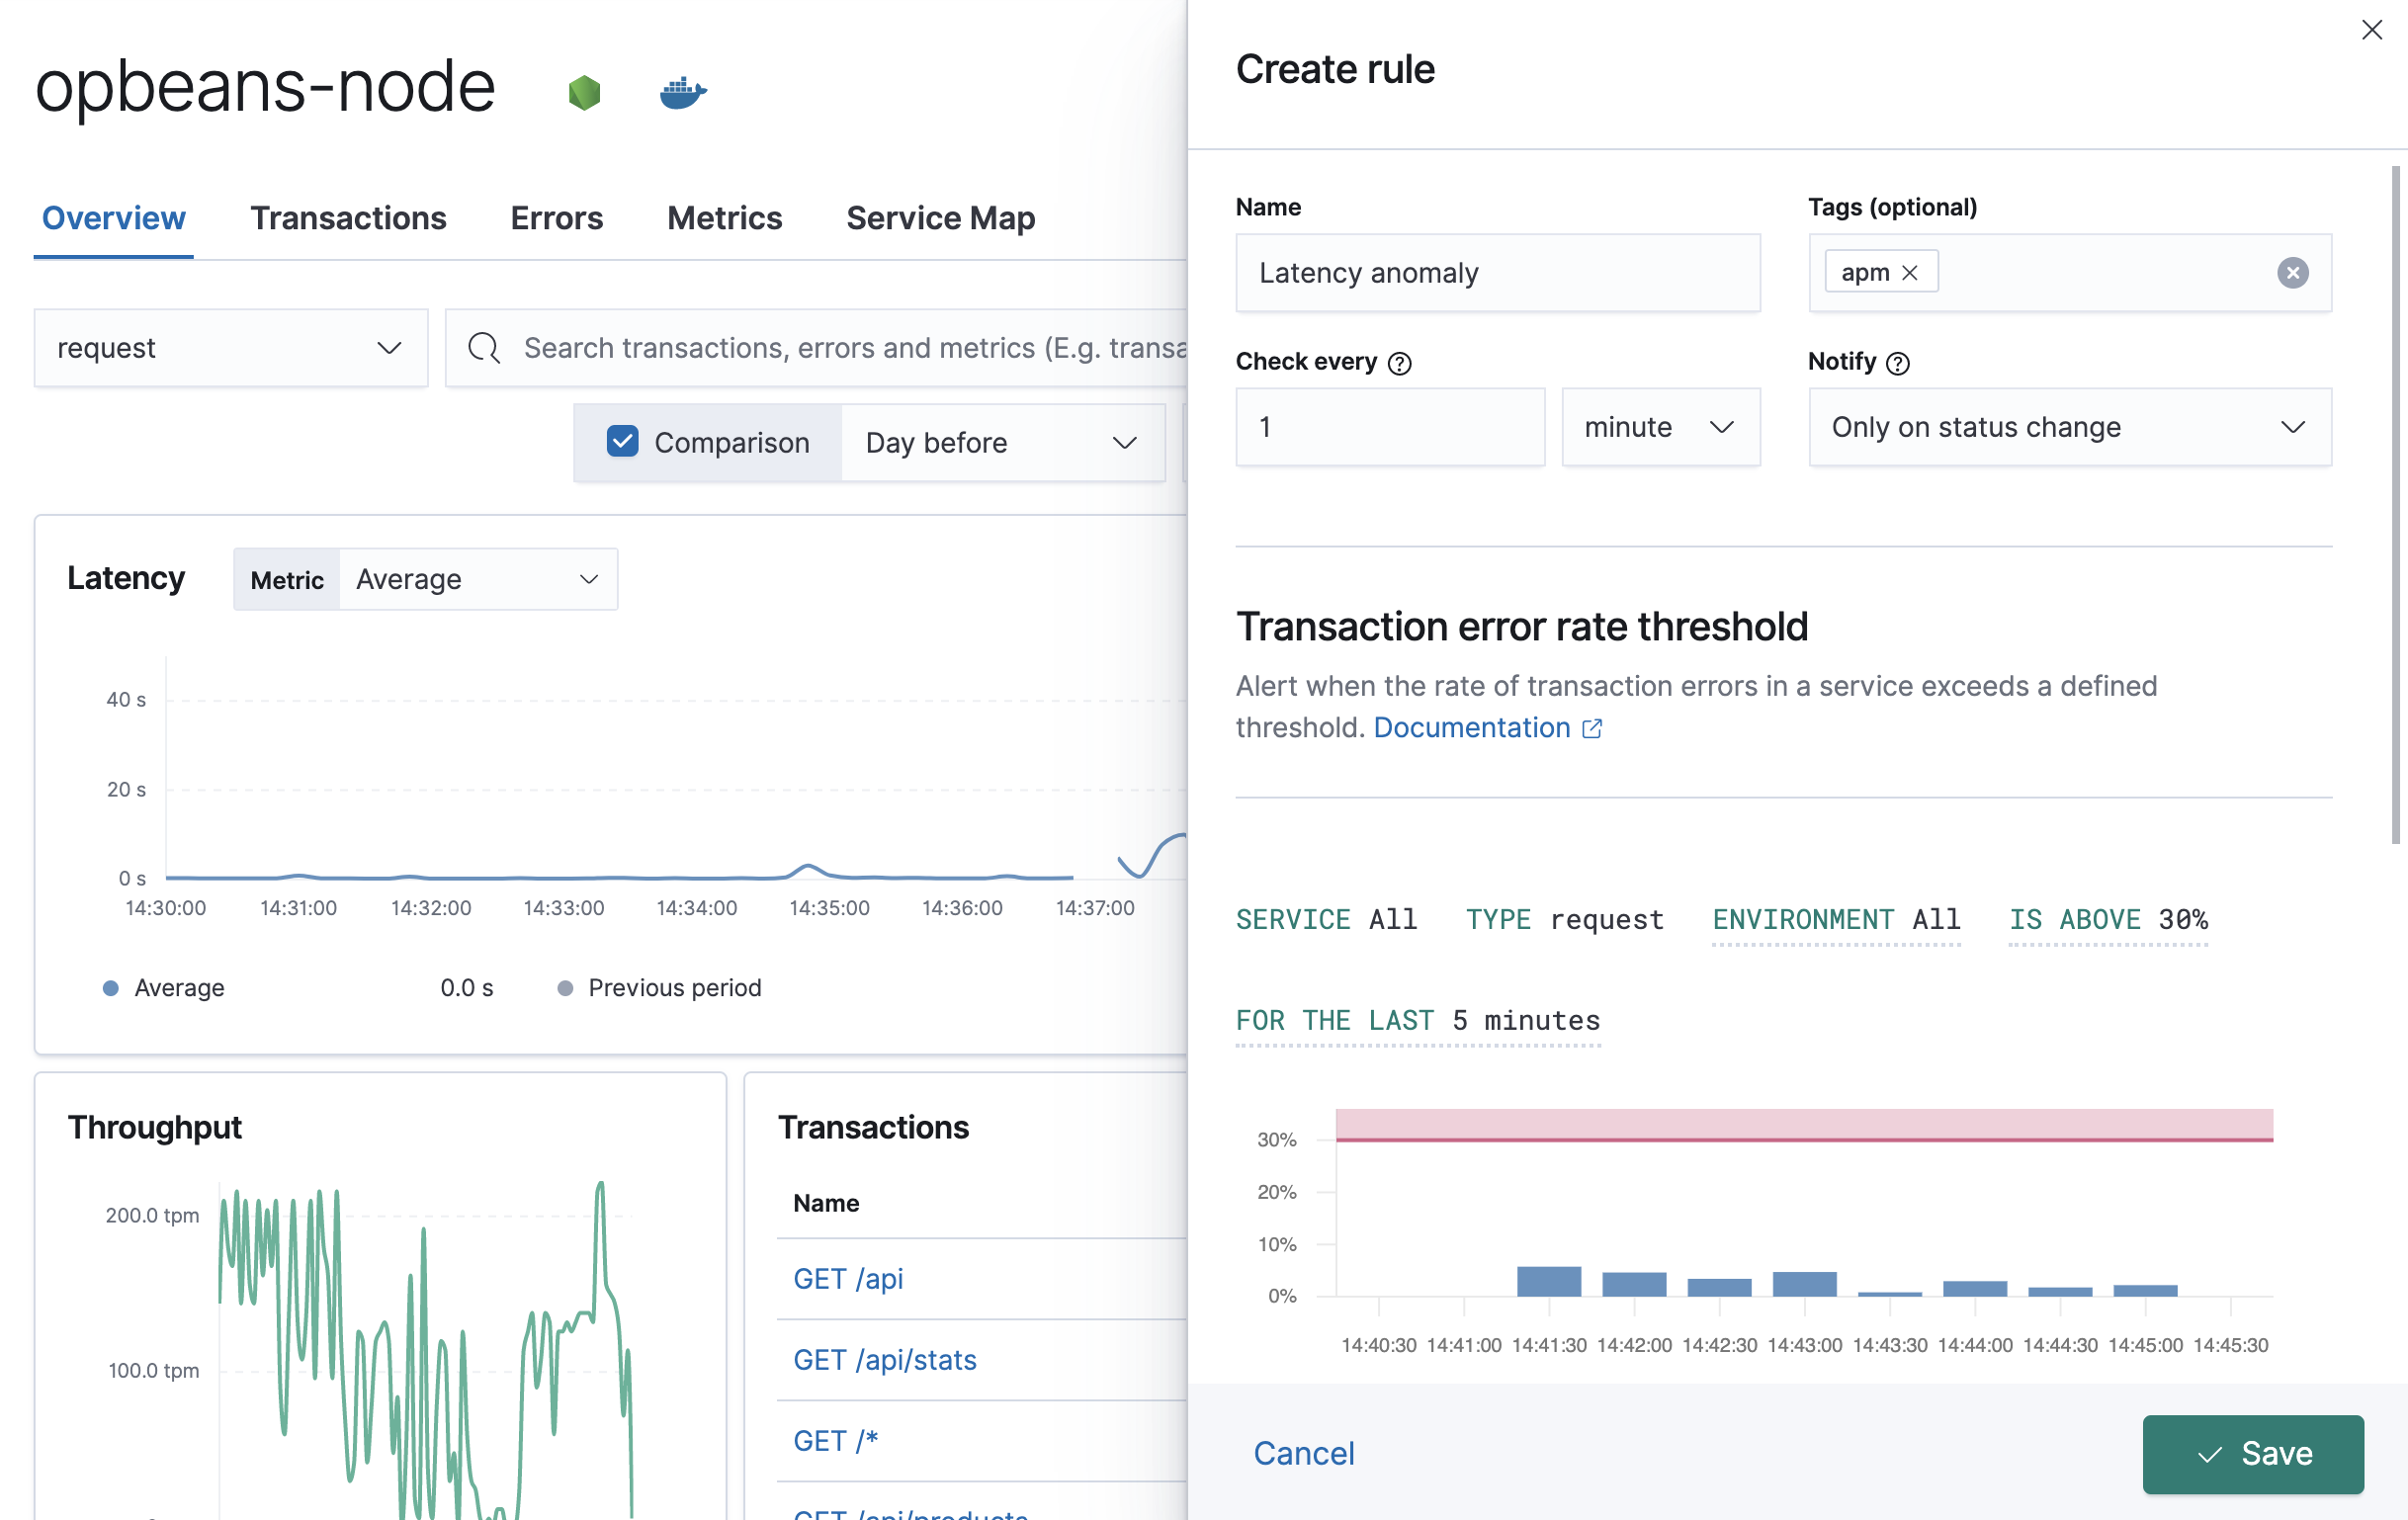
For a complete walkthrough of the Create rule flyout panel, including detailed information on each configurable property, see Kibana’s create and edit rules.
Below, we’ll walk through the creation of two APM rules.
Example: create a latency anomaly rule
editLatency anomaly rules trigger when the latency of a service is abnormal. This guide will create an alert for all services based on the following criteria:
- Environment: production
- Severity level: critical
- Run every five minutes
- Send an alert to a Slack channel only when the rule status changes
From any page in the APM app, select Alerts and rules > Latency > Create anomaly rule. Change the name of the alert, but do not edit the tags.
Based on the criteria above, define the following rule details:
-
Check every -
5 minutes - Notify - "Only on status change"
-
Environment -
all -
Has anomaly with severity -
critical
Next, add a connector. Multiple connectors can be selected, but in this example we’re interested in Slack. Select Slack > Create a connector. Enter a name for the connector, and paste your Slack webhook URL. See Slack’s webhook documentation if you need to create one.
A default message is provided as a starting point for your alert.
You can use the Mustache template syntax, i.e., {{variable}}
to pass additional alert values at the time a condition is detected to an action.
A list of available variables can be accessed by selecting the
add variable button  .
.
Click Save. The rule has been created and is now active!
Example: create an error count threshold alert
editThe error count threshold alert triggers when the number of errors in a service exceeds a defined threshold. This guide will create an alert for all services based on the following criteria:
- All environments
- Error rate is above 25 for the last minute
- Check every 1 minute, and alert every time the rule is active
- Send the alert via email to the site reliability team
From any page in the APM app, select Alerts and rules > Error count > Create threshold rule. Change the name of the alert, but do not edit the tags.
Based on the criteria above, define the following rule details:
-
Check every -
1 minute - Notify - "Every time alert is active"
-
Environment -
all -
Is above -
25 errors -
For the last -
1 minute
Select the Email connector and click Create a connector. Fill out the required details: sender, host, port, etc., and click save.
A default message is provided as a starting point for your alert.
You can use the Mustache template syntax, i.e., {{variable}}
to pass additional alert values at the time a condition is detected to an action.
A list of available variables can be accessed by selecting the
add variable button .
Click Save. The alert has been created and is now active!
Manage alerts and rules
editFrom the APM app, select Alerts and rules > Manage rules to be taken to the Kibana Rules and Connectors page. From this page, you can disable, mute, and delete APM alerts.
More information
editSee alerting and actions for more information.
If you are using an on-premise Elastic Stack deployment with security, communication between Elasticsearch and Kibana must have TLS configured. More information is in the alerting prerequisites.