Ingest Node Pipelines
editIngest Node Pipelines
editIngest Node Pipelines enables you to create and manage Elasticsearch pipelines that perform common transformations and enrichments on your data. For example, you might remove a field, rename an existing field, or set a new field.
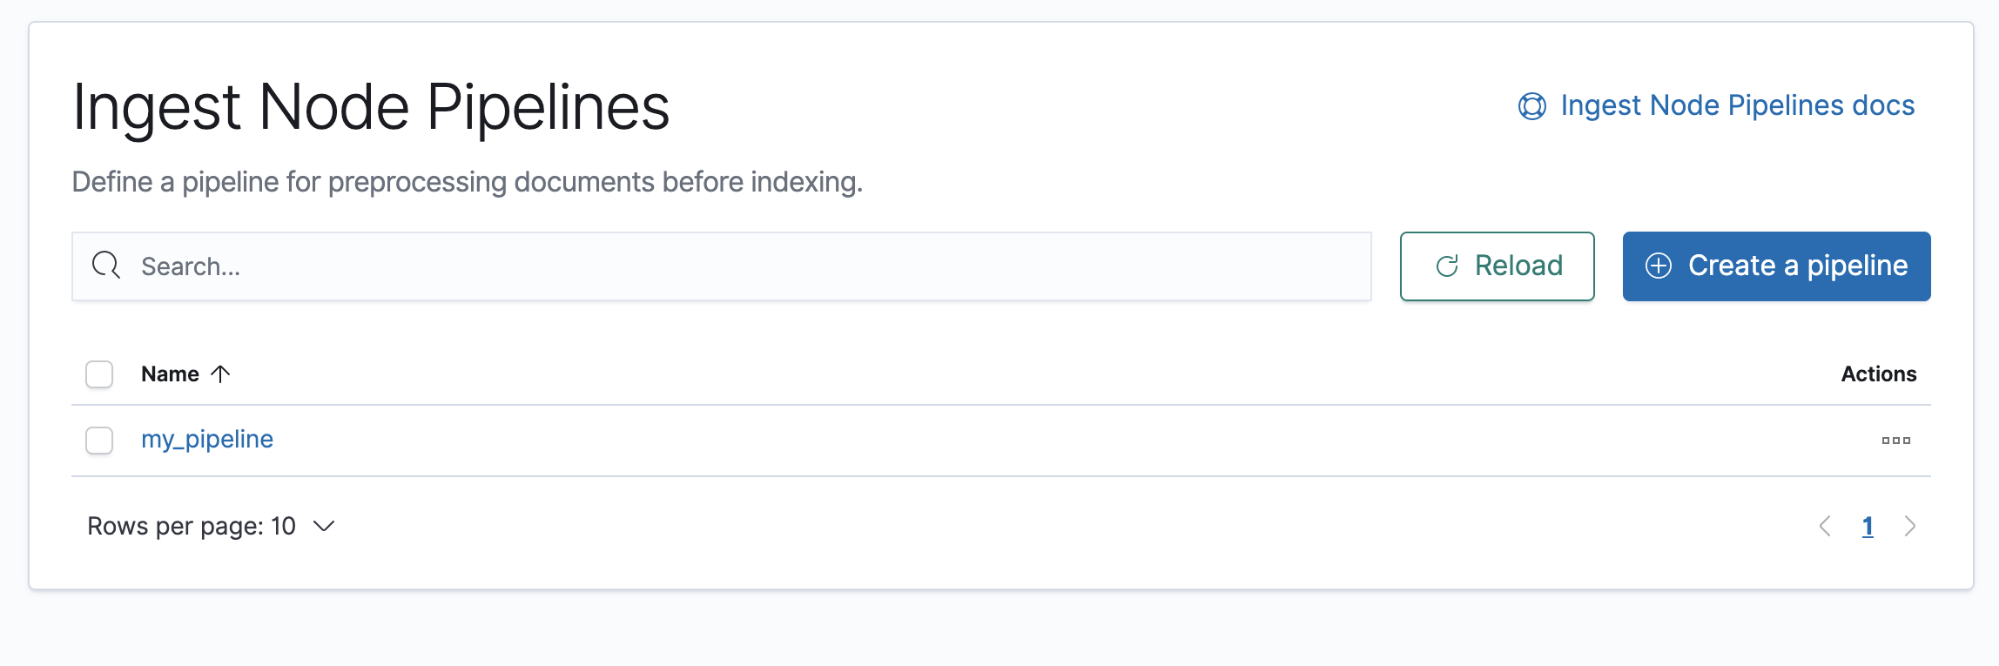
To begin, open the main menu, then click Stack Management > Ingest Node Pipelines. With Ingest Node Pipelines, you can:
- View a list of your pipelines and drill down into details.
- Create a pipeline that defines a series of tasks, known as processors.
- Test a pipeline before feeding it with real data to ensure the pipeline works as expected.
- Delete a pipeline that is no longer needed.
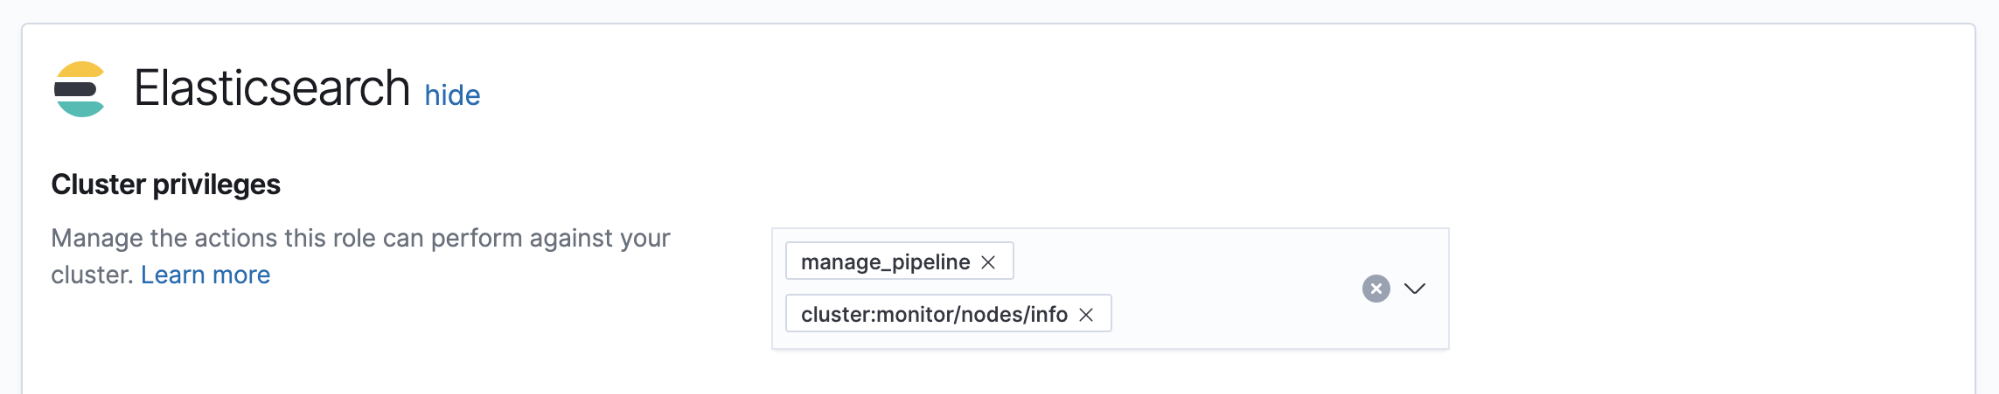
Required permissions
editThe minimum required permissions to access Ingest Node Pipelines are
the manage_pipeline and cluster:monitor/nodes/info cluster privileges.
To add privileges, open the main menu, then click Stack Management > Roles.
Manage pipelines
editFrom the list view, you can to drill down into the details of a pipeline. To edit, clone, or delete a pipeline, use the Actions menu.
If you don’t have any pipelines, you can create one using the Create pipeline form. You’ll define processors to transform documents in a specific way. To handle exceptions, you can optionally define failure processors to execute immediately after a failed processor. Before creating the pipeline, you can verify it provides the expected output.
Example: Create a pipeline
editIn this example, you’ll create a pipeline to handle server logs in the Common Log Format. The log looks similar to this:
212.87.37.154 - - [05/May/2020:16:21:15 +0000] \"GET /favicon.ico HTTP/1.1\"
200 3638 \"-\" \"Mozilla/5.0 (Macintosh; Intel Mac OS X 10_11_6)
AppleWebKit/537.36 (KHTML, like Gecko) Chrome/52.0.2743.116 Safari/537.36\"
The log contains an IP address, timestamp, and user agent. You want to give these three items their own field in Elasticsearch for fast search and visualization. You also want to know where the request is coming from.
- In Ingest Node Pipelines, click Create a pipeline.
- Provide a name and description for the pipeline.
-
Add a grok processor to parse the log message:
- Click Add a processor and select the Grok processor type.
-
Set the field input to
messageand enter the following grok pattern:%{IPORHOST:clientip} %{USER:ident} %{USER:auth} \[%{HTTPDATE:timestamp}\] "%{WORD:verb} %{DATA:request} HTTP/%{NUMBER:httpversion}" %{NUMBER:response:int} (?:-|%{NUMBER:bytes:int}) %{QS:referrer} %{QS:agent} - Click Update to save the processor.
-
Add processors to map the date, IP, and user agent fields.
-
Map the appropriate field to each processor type:
-
Date:
timestamp -
GeoIP:
clientip -
User agent:
agent
For the Date processor, you also need to specify the date format you want to use:
dd/MMM/YYYY:HH:mm:ss Z.Your form should look similar to this:
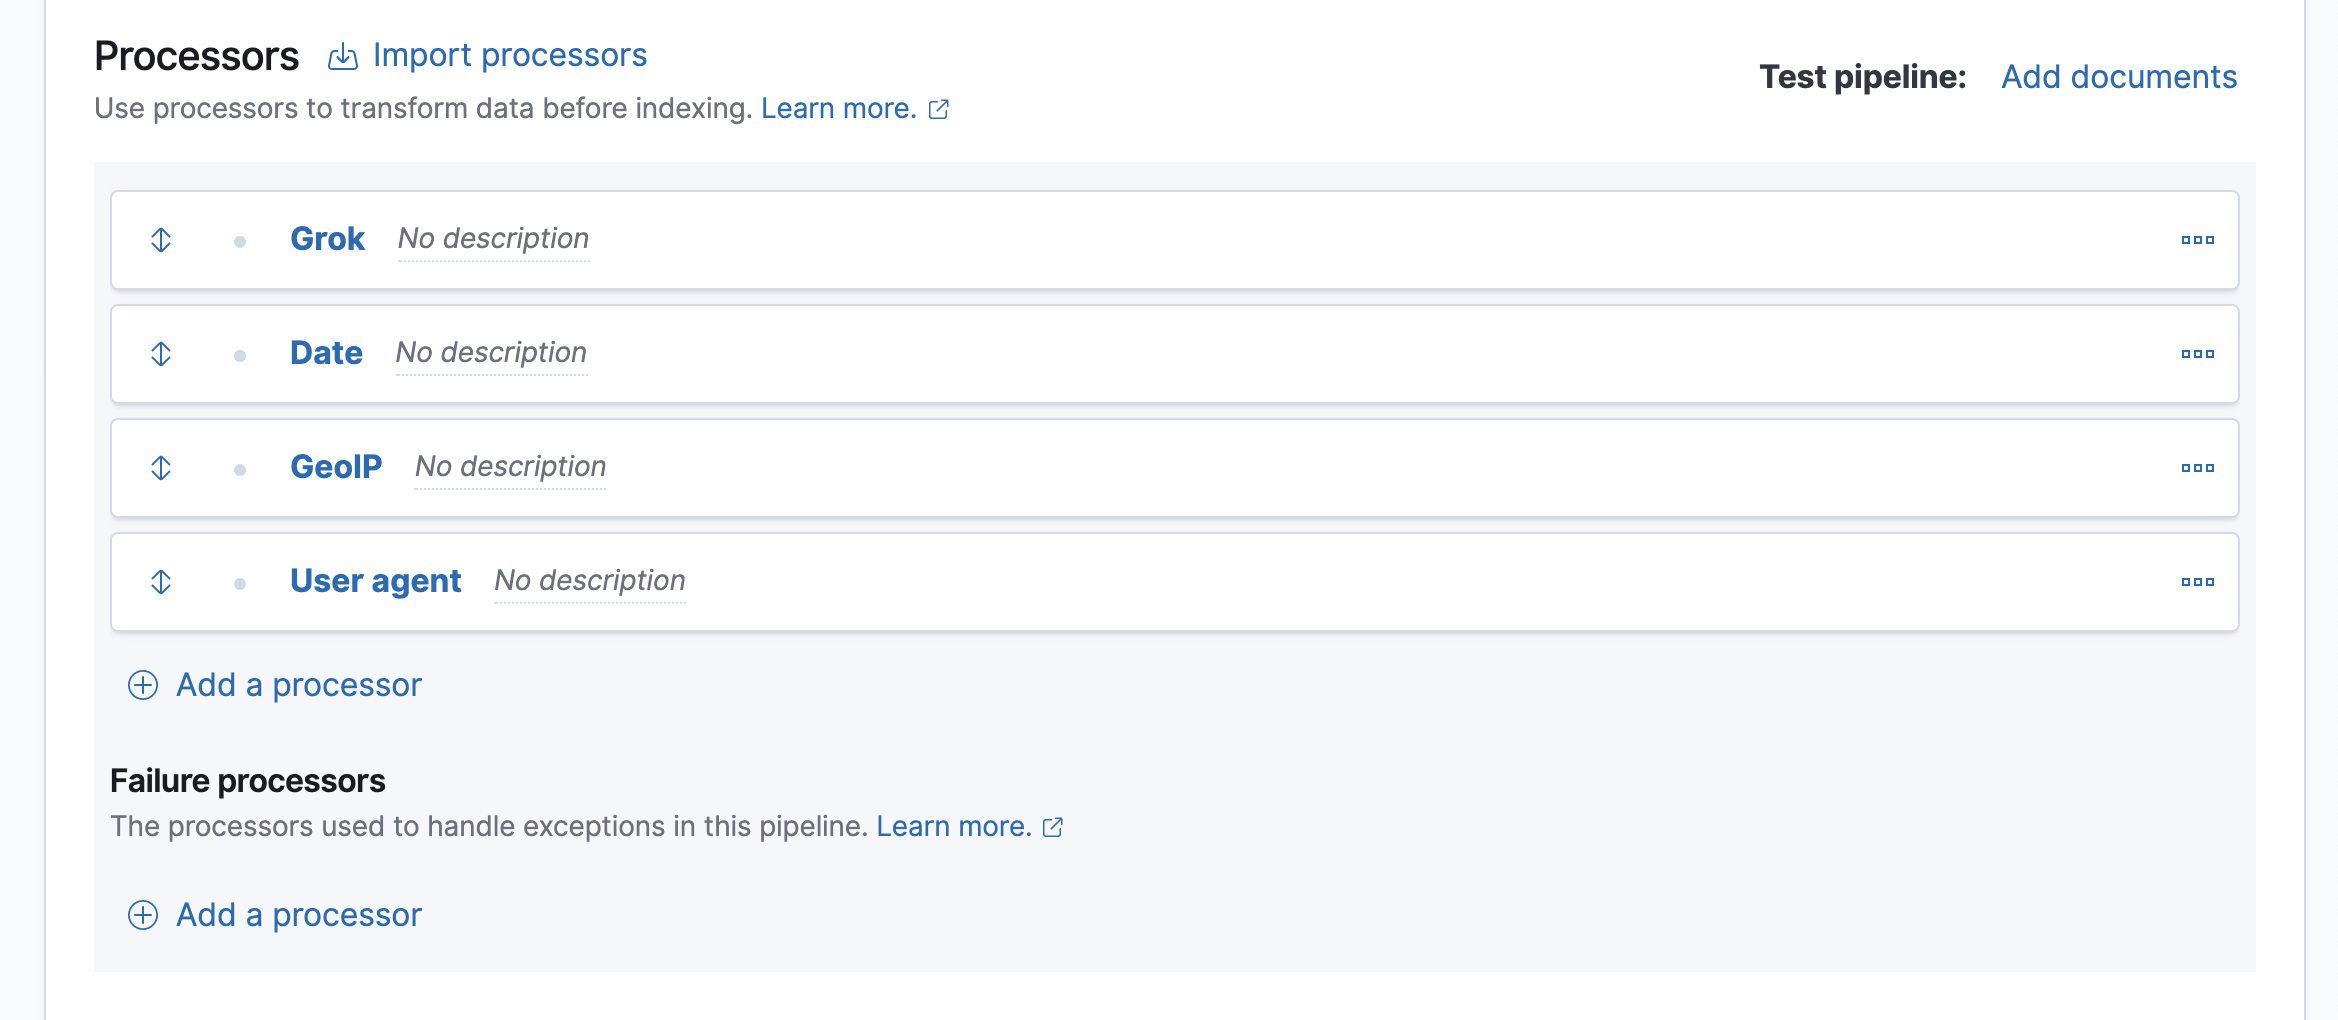
Alternatively, you can click the Import processors link and define the processors as JSON:
{
  "processors": [
    {
      "grok": {
        "field": "message",
        "patterns": ["%{IPORHOST:clientip} %{USER:ident} %{USER:auth} \\[%{HTTPDATE:timestamp}\\] \"%{WORD:verb} %{DATA:request} HTTP/%{NUMBER:httpversion}\" %{NUMBER:response:int} (?:-|%{NUMBER:bytes:int}) %{QS:referrer} %{QS:agent}"]
      }
    },
    {
      "date": {
        "field": "timestamp",
        "formats": [ "dd/MMM/YYYY:HH:mm:ss Z" ]
      }
    },
    {
      "geoip": {
        "field": "clientip"
      }
    },
    {
      "user_agent": {
        "field": "agent"
      }
    }
  ]
}
The four processors will run sequentially: grok, date, geoip, and user_agent. You can reorder processors using the arrow icon next to each processor.
-
Date:
-
- To test the pipeline to verify that it produces the expected results, click Add documents.
-
In the Documents tab, provide a sample document for testing:
[ { "_source": { "message": "212.87.37.154 - - [05/May/2020:16:21:15 +0000] \"GET /favicon.ico HTTP/1.1\" 200 3638 \"-\" \"Mozilla/5.0 (Macintosh; Intel Mac OS X 10_11_6) AppleWebKit/537.36 (KHTML, like Gecko) Chrome/52.0.2743.116 Safari/537.36\"" } } ] -
Click Run the pipeline and check if the pipeline worked as expected.
You can also view the verbose output and refresh the output from this view.
-
If everything looks correct, close the panel, and then click Create pipeline.
At this point, you’re ready to use the Elasticsearch index API to load the logs data.
-
In the Kibana Console, index a document with the pipeline you created.
PUT my-index/_doc/1?pipeline=access_logs { "message": "212.87.37.154 - - [05/May/2020:16:21:15 +0000] \"GET /favicon.ico HTTP/1.1\" 200 3638 \"-\" \"Mozilla/5.0 (Macintosh; Intel Mac OS X 10_11_6) AppleWebKit/537.36 (KHTML, like Gecko) Chrome/52.0.2743.116 Safari/537.36\"" } -
To verify, run:
GET my-index/_doc/1