Viewing Monitoring Data in Kibana
editViewing Monitoring Data in Kibana
editYou can enable X-Pack monitoring in Elasticsearch, Logstash, Kibana, and Beats. By default, the monitoring agents on Elasticsearch index data within the same cluster.
If you have a dedicated monitoring cluster, the information is accessible even if the Elasticsearch cluster you’re monitoring is not. You can send data from multiple clusters to the same monitoring cluster and view them all through the same instance of Kibana. For more information, see
To view and analyze the health and performance of Elasticsearch, Logstash, Kibana, and Beats:
- Configure monitoring in Elasticsearch. If you want to use a separate monitoring cluster, see Monitoring in a production environment.
- Configure monitoring in Kibana.
- Configure monitoring in Logstash.
- Configure monitoring in Auditbeat, Filebeat, Heartbeat, Metricbeat, Packetbeat, and Winlogbeat.
-
Open Kibana in your web browser and log in. If you are running Kibana
locally, go to
http://localhost:5601/. To access Kibana and view the monitoring dashboards, you must log in as a user who has thekibana_userandmonitoring_userroles. -
In the side navigation, click Monitoring. The first time you open Kibana monitoring, data collection is disabled. You will be prompted to turn on data collection.
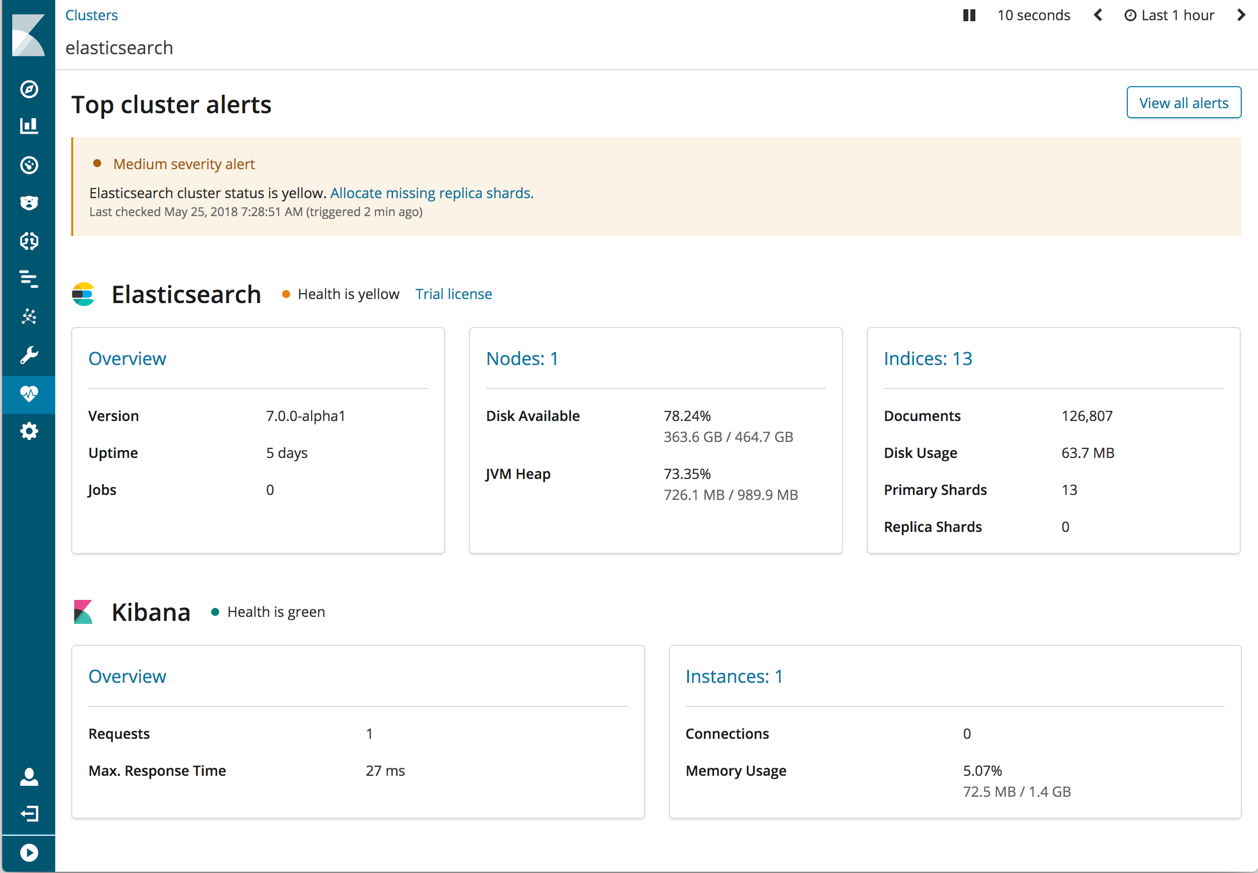
If you have permission to turn on data collection and there is data in the cluster, Kibana displays the monitoring dashboards. You’ll see cluster alerts that require your attention and a summary of the available monitoring metrics for Elasticsearch, Logstash, Kibana, and Beats. To view additional information, click the Overview, Nodes, Indices, or Instances links.
If Kibana can’t activate monitoring, here are some things to do:
- If you don’t have permission to activate monitoring, contact your system administrator.
- If Kibana can’t find monitoring data, set the time filter to “Last 1 hour”. When monitoring data appears in your cluster, the page automatically refreshes with the monitoring summary.
-
Check your
xpack.monitoring.elasticsearch.urlsetting. See Monitoring Settings in Kibana.
Watcher must be enabled to view cluster alerts. If you have a Basic license, Top Cluster Alerts are not displayed.