WARNING: Version 5.5 of Kibana has passed its EOL date.
This documentation is no longer being maintained and may be removed. If you are running this version, we strongly advise you to upgrade. For the latest information, see the current release documentation.
Monitoring Settings in Kibana
editMonitoring Settings in Kibana
editMonitoring is enabled by default when you install X-Pack. You can adjust
how monitoring data is displayed in the Monitoring UI by configuring
xpack.monitoring settings in kibana.yml.
To control how data is collected from your Elasticsearch nodes, you configure
xpack.monitoring.collection
settings in elasticsearch.yml. To control how monitoring data is collected
from Logstash, you configure
xpack.monitoring settings in logstash.yml.
For more information, see Monitoring the Elastic Stack.
Monitoring UI Settings
editYou can set the following xpack.monitoring settings in kibana.yml to adjust
how the Monitoring UI displays monitoring data. However, the defaults work best
in most circumstances. For more information about configuring Kibana, see
Setting Kibana Server Properties.
-
xpack.monitoring.enabled -
Set to
falseto disable the X-Pack monitoring UI. -
xpack.monitoring.elasticsearch.url -
The location of the Elasticsearch instance(s) where your monitoring data is
stored. By default, this is the same as the
elasticsearch.url. This setting enables you to use a single Kibana instance to search and visualize data in your production cluster as well as monitor data sent to a dedicated monitoring cluster. -
xpack.monitoring.kibana.collection.enabled -
Whether or not to enable data collection from the Kibana NodeJS server for
Kibana Dashboards to be featured in the Monitoring UI. Defaults to
true. -
xpack.monitoring.kibana.collection.interval -
Number of milliseconds to wait in between data sampling for Kibana’s NodeJS
server for the metrics that are displayed in the Kibana dashboards. Defaults to
10000(10 seconds). -
xpack.monitoring.max_bucket_size -
The number of term buckets to return out of the overall terms list when
performing terms aggregations to retrieve index and node metrics. For more
information about the
sizeparameter, see Terms Aggregation. Defaults to 10000. -
xpack.monitoring.min_interval_seconds -
The minimum number of seconds that a time bucket in a chart can represent.
Defaults to 10. If you modify the
xpack.monitoring.collection.intervalinelasticsearch.yml, set this option to the same value. -
xpack.monitoring.node_resolver -
The node resolver controls how nodes are considered unique. This can be set to either
uuid,transport_address, orname.uuidcontrols uniqueness based on the node’s persistent ID.transport_addresscontrols uniqueness based on the node’s published hostname/IP and port.namecontrols uniqueness based on the node’snode.namesetting. Defaults touuid. [5.5] Deprecated in 5.5. -
xpack.monitoring.report_stats -
Whether or not to send cluster statistics to Elastic. Reporting your cluster statistics
helps us improve your user experience. Set to
falseto disable statistics reporting from any browser connected to the Kibana instance. You can also opt-out through Kibana’s Advanced Settings. Defaults totrue. -
xpack.monitoring.ui.enabled -
Set to
falseto hide the Monitoring UI in Kibana. The Monitoring back-end continues to run as an agent for sending Kibana stats to the Monitoring cluster. Defaults totrue.
Monitoring UI Container Settings
editThe Monitoring UI exposes the Cgroup statistics that we collect for you to make better decisions about your container performance, rather than guessing based on the overall machine performance. If you are not running your applications in a container, then Cgroup statistics will not be useful.
-
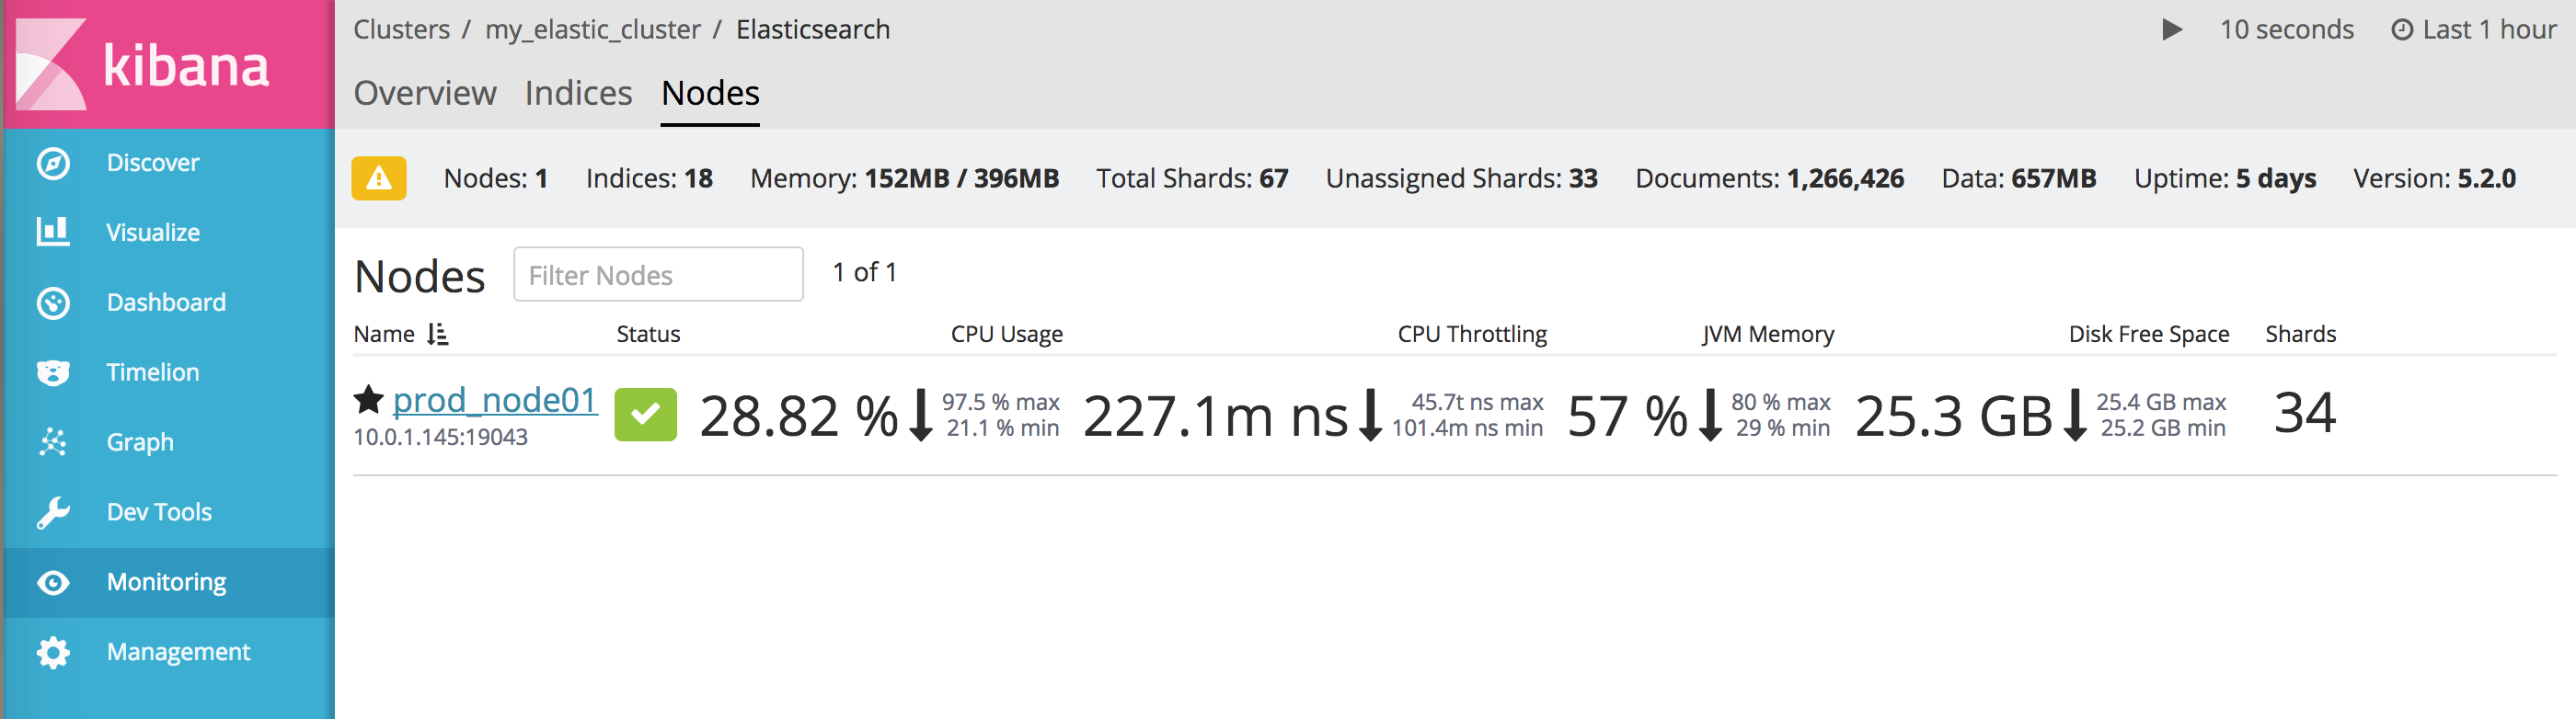
xpack.monitoring.ui.container.elasticsearch.enabled -
For Elasticsearch clusters that are running in containers, this setting changes the Node Listing to display the CPU Utilization based on the reported Cgroup statistics. This will also add the calculated Cgroup CPU Utilization to the Node Overview page instead of the overall operating system’s CPU Utilization. Defaults to
false.