Overview
editOverview
editYou can use the infrastructure monitoring capabilities of the Elastic Stack to monitor your infrastructure in real time and check the health of your servers, containers, and services.
The Infrastructure app in Kibana brings together data from a variety of sources, including logs and metrics, making it easier for you to identify and resolve infrastructure issues quickly.
Infrastructure monitoring components
edit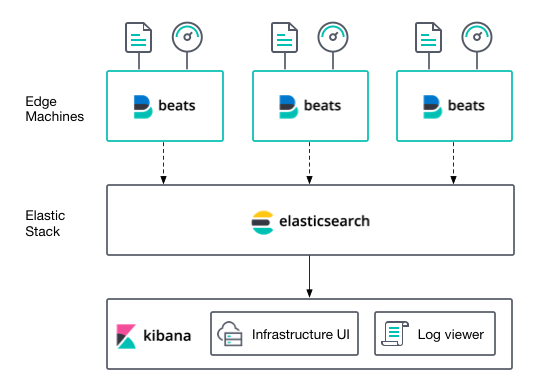
Infrastructure monitoring requires the following Elastic Stack components.
Elasticsearch is a real-time, distributed storage, search, and analytics engine. Elasticsearch excels at indexing streams of semi-structured data, such as logs or metrics.
Beats are open source data shippers that you install as agents on your servers to send operational data to Elasticsearch.
Kibana is an open source analytics and visualization platform designed to work with Elasticsearch. You use Kibana to search, view, and interact with data stored in Elasticsearch. You can easily perform advanced data analysis and visualize your data in a variety of charts, tables, and maps.
The Infrastructure app in Kibana provides a dedicated user interface for visualizing the health of your servers, containers, and services in your infrastructure.
The Logs app in Kibana provides a compact, customizable display for viewing and analyzing real-time and historic log data.