Configure SSL/TLS for the Logstash output
editConfigure SSL/TLS for the Logstash output
editThis functionality is in beta and is subject to change. The design and code is less mature than official GA features and is being provided as-is with no warranties. Beta features are not subject to the support SLA of official GA features.
To send data from Elastic Agent to Logstash securely, you need to configure Transport Layer Security (TLS). Using TLS ensures that your Elastic Agents send encrypted data to trusted Logstash servers, and that your Logstash servers receive data from trusted Elastic Agent clients.
Prerequisites
edit- Make sure your subscription level supports output to Logstash.
- On Windows, add port 8220 for Fleet Server and 5044 for Logstash to the inbound port rules in Windows Advanced Firewall.
- If you are connecting to a self-managed Elasticsearch cluster, you need the CA certificate that was used to sign the certificates for the HTTP layer of Elasticsearch cluster. For more information, refer to the Elasticsearch security docs.
Generate custom certificates and private keys
editYou can use whatever process you typically use to generate PEM-formatted
certificates. The examples shown here use the certutil tool provided by Elasticsearch.
The certutil tool is not available on Elastic Cloud, but you can still use it
to generate certificates for Elastic Agent to Logstash connections. Just
download an Elasticsearch package,
extract it to a local directory, and run the elasticsearch-certutil command.
There’s no need to start Elasticsearch!
-
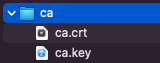
Generate a certificate authority (CA). Skip this step if you want to use an existing CA.
./bin/elasticsearch-certutil ca --pem
This command creates a zip file that contains the CA certificate and key you’ll use to sign the certificates. Extract the zip file:
-
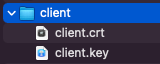
Generate a client SSL certificate signed by your CA. For example:
./bin/elasticsearch-certutil cert \
  --name client \
  --ca-cert /path/to/ca/ca.crt \
  --ca-key /path/to/ca/ca.key \
  --dns your.host.name.here \
  --ip 192.0.2.1 \
  --pem
Where
dnsandipspecify the valid host names and IP addresses where the generated certificates are valid.Extract the zip file:
-
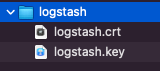
Generate a Logstash SSL certificate signed by your CA. For example:
./bin/elasticsearch-certutil cert \
  --name logstash \
  --ca-cert /path/to/ca/ca.crt \
  --ca-key /path/to/ca/ca.key \
  --dns your.host.name.here \
  --ip 192.0.2.1 \
  --pem
Extract the zip file:
-
Convert the Logstash key to pkcs8. For example, on Linux run:
openssl pkcs8 -inform PEM -in logstash.key -topk8 -nocrypt -outform PEM -out logstash.pkcs8.key
Store these files in a secure location.
Configure the Logstash pipeline
editIf you’ve already created the Logstash elastic-agent-pipeline.conf pipeline
and added it to pipelines.yml, skip to the example configurations and modify
your pipeline configuration as needed.
In your Logstash configuration directory, open the pipelines.yml file and
add the following configuration. Replace the path to your file.
- pipeline.id: elastic-agent-pipeline
  path.config: "/etc/path/to/elastic-agent-pipeline.conf"
In the elastic-agent-pipeline.conf file, add the pipeline configuration. Note
that the configuration needed for Elasticsearch Service on Elastic Cloud is different from
self-managed Elasticsearch clusters. If you copied the configuration shown in Fleet,
adjust it as needed.
Elasticsearch Service example:
input {
  elastic_agent {
    port => 5044
    ssl => true
    ssl_certificate_authorities => ["/path/to/ca.crt"]
    ssl_certificate => "/path/to/logstash.crt"
    ssl_key => "/path/to/logstash.pkcs8.key"
    ssl_verify_mode => "force_peer"
  }
}

output {
  elasticsearch {
    cloud_id => "xxxx:xxxxxxxxxxxxxxxxxxxxxxxxxxxxx="
    api_key => "xxxx:xxxx"
    data_stream => true
    ssl => true
  }
}
|
Use the |
|
|
In Fleet, you can generate this API key when you add a Logstash output. |
|
|
Elasticsearch Service uses standard publicly trusted certificates, so there’s no need specify other SSL settings here. |
Self-managed Elasticsearch cluster example:
input {
  elastic_agent {
    port => 5044
    ssl => true
    ssl_certificate_authorities => ["/path/to/ca.crt"]
    ssl_certificate => "/path/to/logstash.crt"
    ssl_key => "/path/to/logstash.pkcs8.key"
    ssl_verify_mode => "force_peer"
  }
}

output {
  elasticsearch {
    hosts => "https://xxxx:9200"
    api_key => "xxxx:xxxx"
    data_stream => true
    ssl => true
    cacert => "/path/to/http_ca.crt"
  }
}
To learn more about the Logstash configuration, refer to:
When you’re done configuring the pipeline, restart Logstash:
bin/logstash
Add a Logstash output to Fleet
editThis section describes how to add a Logstash output and configure SSL settings in Fleet. If you’re running Elastic Agent standalone, refer to the Logstash output configuration docs.
- In Kibana, go to Fleet > Settings.
- Under Outputs, click Add output. If you’ve been following the Logstash steps in Fleet, you might already be on this page.
- Specify a name for the output.
- For Type, select Logstash.
-
Under Logstash hosts, specify the host and port your agents will use to
connect to Logstash. Use the format
host:port. -
In the Server SSL certificate authorities field, paste in the entire
contents of the
ca.crtfile you generated earlier. -
In the Client SSL certificate field, paste in the entire contents of the
client.crtfile you generated earlier. -
In the Client SSL certificate key field, paste in the entire contents of the
client.keyfile you generated earlier.
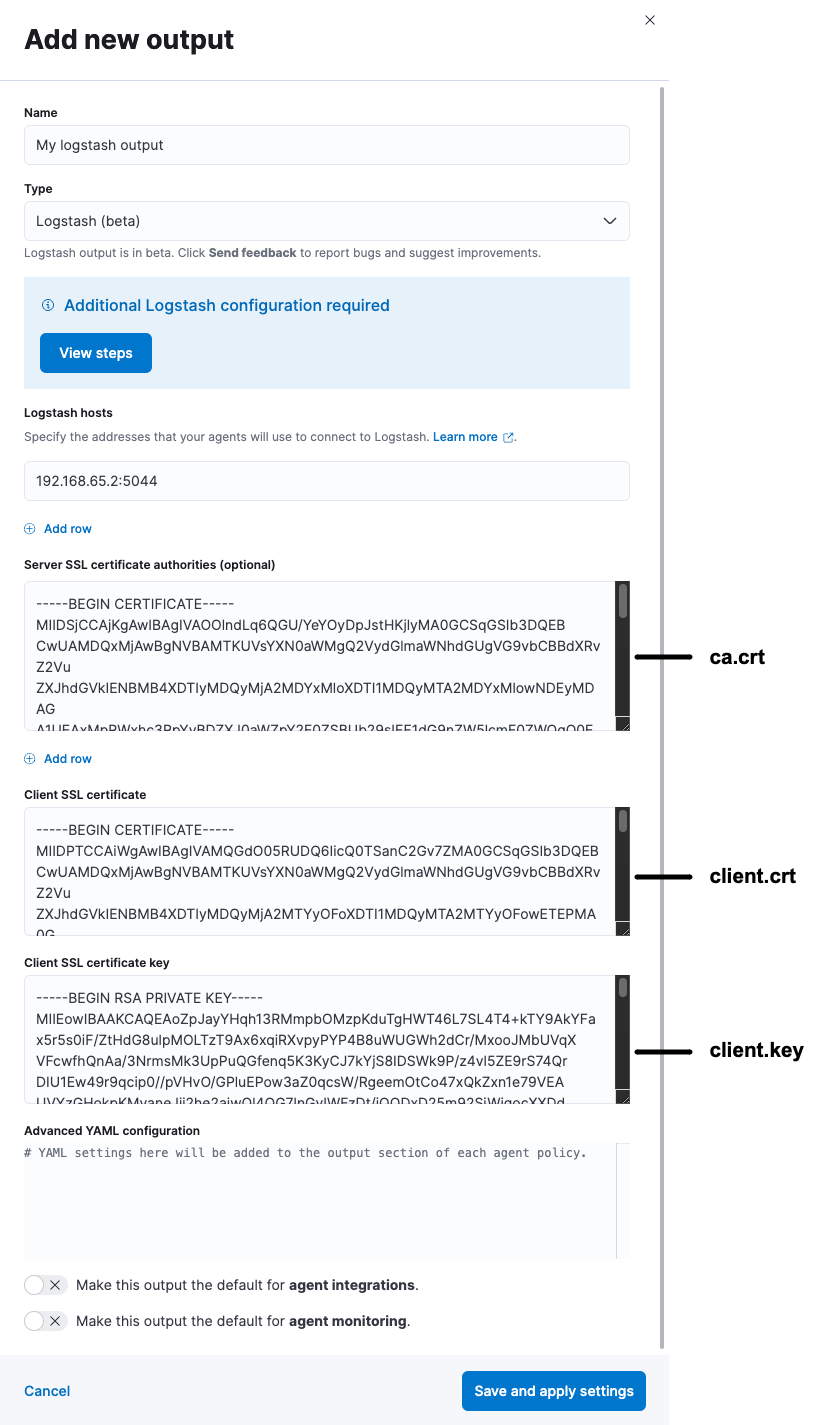
When you’re done, save and apply the settings.
Select the Logstash output in an agent policy
editLogstash is now listening for events from Elastic Agent, but events are not streaming into Elasticsearch yet. You need to select the Logstash output in an agent policy. You can edit an existing policy or create a new one:
-
In Kibana, go to Fleet > Agent policies and either create a new agent policy or click an existing policy to edit it:
- To change the output settings in a new policy, click Create agent policy and expand Advanced options.
- To change the output settings in an existing policy, click the policy to edit it, then click Settings.
-
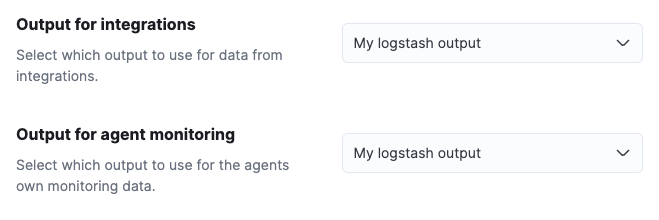
Set Output for integrations and (optionally) Output for agent monitoring to use the Logstash output you created earlier. You might need to scroll down to see these options
- Save your changes.
Any Elastic Agents enrolled in the agent policy will begin sending data to Elasticsearch via Logstash. If you don’t have any installed Elastic Agents enrolled in the agent policy, do that now.
There might be a slight delay while the Elastic Agents update to the new policy and connect to Logstash over a secure connection.
Test the connection
editTo make sure Logstash is sending data, run the following command from the host where Logstash is running:
curl -XGET localhost:9600/_node/stats/events
The request should return stats on the number of events in and out. If these values are 0, check the Elastic Agent logs for problems.
When data is streaming to Elasticsearch, go to Observability and click Metrics to view metrics about your system.