Migrate from Beats to Elastic Agent
editMigrate from Beats to Elastic Agent
editLearn how to replace your existing Filebeat and Metricbeat deployments with Elastic Agent, our single agent for logs, metrics, security, and threat prevention.
Why migrate to Elastic Agent?
editElastic Agent and Beats provide similar functionality for log collection and host monitoring, but Elastic Agent has some distinct advantages over Beats.
- Easier to deploy and manage. Instead of deploying multiple Beats, you deploy a single Elastic Agent. The Elastic Agent downloads, configures, and manages any underlying programs required to collect and parse your data.
- Easier to configure. You no longer have to define and manage separate configuration files for each Beat running on a host. Instead you define a single agent policy that specifies which integration settings to use, and the Elastic Agent generates the configuration required by underlying programs, like Beats.
- Central management. Unlike Beats, which require you to set up your own automation strategy for upgrades and configuration management, Elastic Agents can be managed from a central location in Kibana called Fleet. In Fleet, you can view the status of running Elastic Agents, update agent policies and push them to your hosts, and even trigger binary upgrades.
- Endpoint protection. Probably the biggest advantage of using Elastic Agent is that it enables you to protect your endpoints from security threats.
Limitations and requirements
editThere are currently some limitations and requirements to be aware of before migrating to Elastic Agent:
- No support for configuring the Beats internal queue. Each Beat has an internal queue that stores events before batching and publishing them to the output. To improve data throughput, Beats users can set configuration options to tune the performance of the internal queue. However, the endless fine tuning required to configure the queue is cumbersome and not always fruitful. Instead of expecting users to configure the internal queue, Elastic Agent uses sensible defaults. This means you won’t be able to migrate internal queue configurations to Elastic Agent.
- Requires superuser privileges to install and operate Elastic Agents. The Fleet and Integrations apps currently require the operator to have superuser privileges. In many deployments, particularly larger organizations, this requirement is unacceptable and poses a security risk. We recommend that you route any changes related to Elastic Agents or integrations through personnel who have superuser credentials. Work is on the way to provide Role Based Access Control (RBAC) to alleviate this requirement.
For more information about Elastic Agent limitations, see Beats and Elastic Agent capabilities.
Prepare for the migration
editBefore you begin:
- Review your existing Beats configurations and make a list of the integrations that are required. For example, if your existing implementation collects logs and metrics from Nginx, add Nginx to your list.
- Make a note of any processors or custom configurations you want to migrate. Some of these customizations may no longer be needed or possible in Elastic Agent.
- Decide if it’s the right time to migrate to Elastic Agent. Review the information under Beats and Elastic Agent capabilities. Make sure the integrations you need are supported and Generally Available, and that the output and features you require are also supported.
If everything checks out, proceed to the next step. Otherwise, you might want to continue using Beats and possibly deploy Elastic Agent alongside Beats to use features like endpoint protection.
Set up Fleet Server (self-managed deployments only)
editTo use Fleet for central management, a Fleet Server must be running and accessible to your hosts.
If you’re using Elastic Cloud, you can skip this step because Elastic Cloud runs a hosted version of Fleet Server.
Otherwise, follow the steps for self-managed deployments described in Add a Fleet Server, then return to this page when you are done.
Deploy Elastic Agent to your hosts to collect logs and metrics
editTo begin the migration, deploy an Elastic Agent to a host where Beats shippers are running. It’s recommended that you set up and test the migration in a development environment before deploying across your infrastructure.
You can continue to run Beats alongside Elastic Agent until you’re satisfied with the data its sending to Elasticsearch.
Read our quick start guide to learn how to deploy an Elastic Agent. (Skip the step about setting up Fleet Server if it’s already running.) To save time, return to this page when the Elastic Agent is deployed, healthy, and successfully sending data. You don’t have to complete all the steps in the quick start.
Here’s a high-level overview to help you understand the deployment process.
It’s best to add one integration at a time and test it before adding more integrations to your agent policy. The System integration is a good way to get started if it’s supported on your OS.
View agent details and inspect the data streams
editAfter deploying an Elastic Agent to a host, view details about the agent and inspect the data streams it creates. To learn more about the benefits of using data streams, refer to Data streams.
-
On the Agents tab in Fleet, confirm that the Elastic Agent status is
Healthy.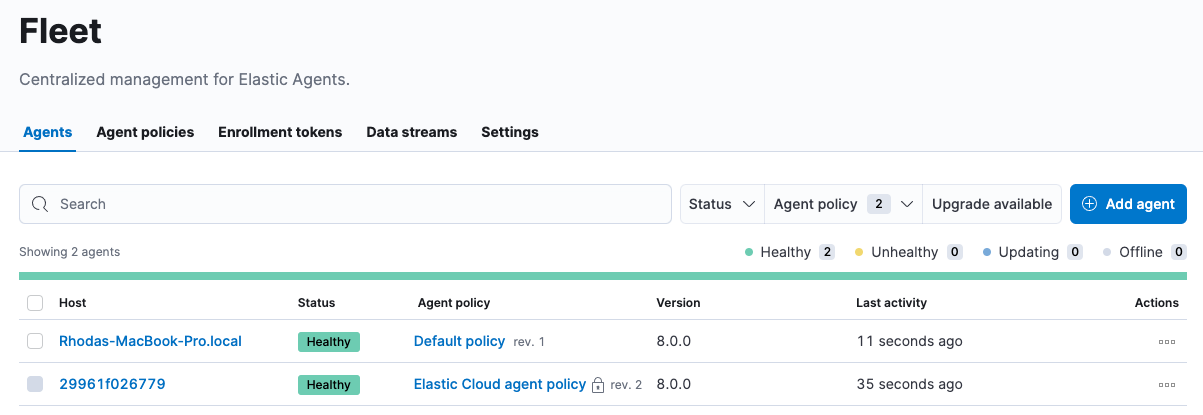
-
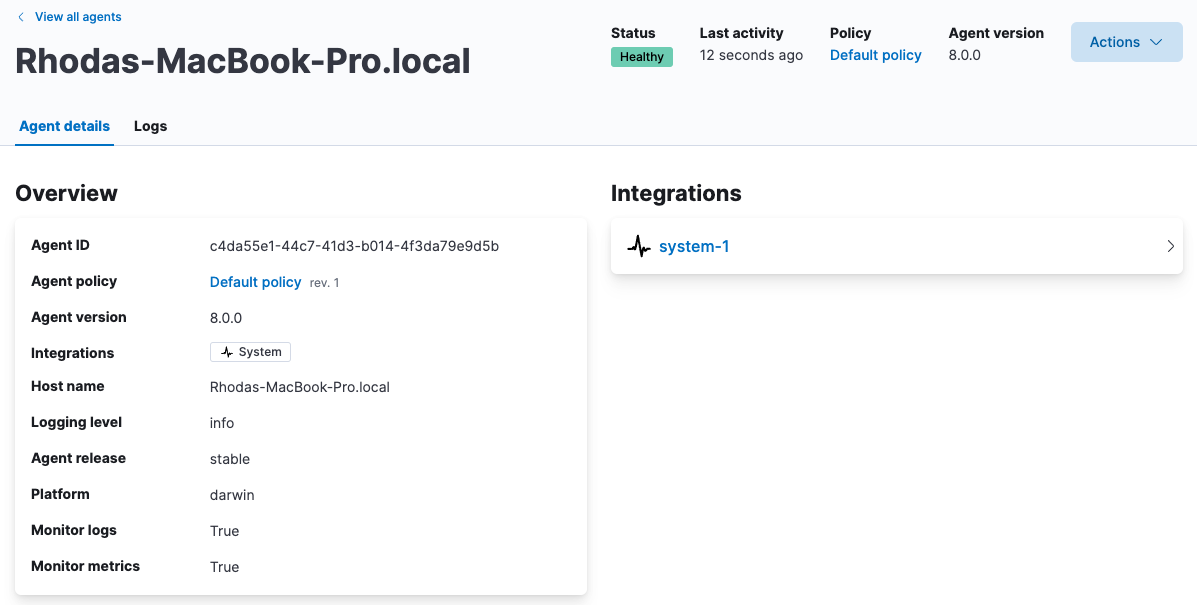
Click the host name to examine the Elastic Agent details. This page shows the integrations that are currently installed, the policy the agent is enrolled in, and information about the host machine:
-
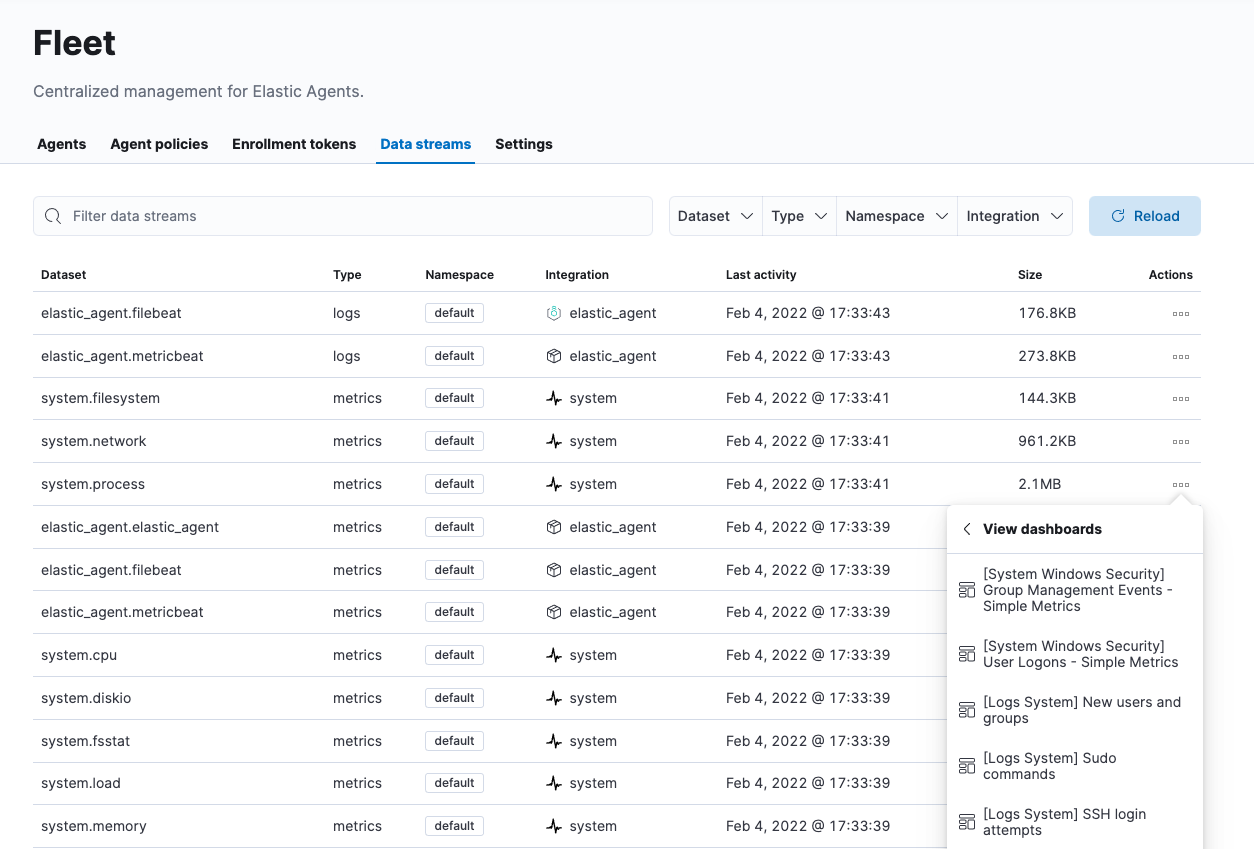
Go back to the main Fleet page and click the Data streams tab. You should be able to see the data streams for various logs and metrics from the host. This is out-of-the-box without any extra configuration or dashboard creation:
-
Go to Analytics > Discover and examine the data streams. Note that documents indexed by Elastic Agent match these patterns:
-
logs-* -
metrics-*
If Beats are installed on the host machine, the data in Elasticsearch will be duplicated, with one set coming from Beats and another from Elastic Agent for the same data source.
For example, filter on
filebeat-*to see the data ingested by Filebeat.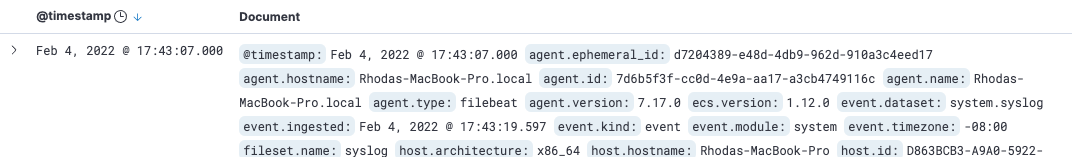
Next, filter on
logs-*. Notice that the document containsdata_stream.*fields that come from logs ingested by the Elastic Agent.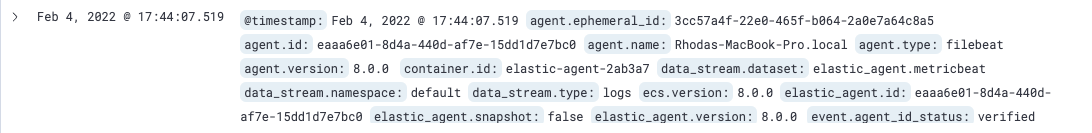
This duplication is superfluous and will consume extra storage space on your Elasticsearch deployment. After you’ve finished migrating all your configuration settings to Elastic Agent, you’ll remove Beats to prevent redundant messages.
-
Add integrations to the agent policy
editNow that you’ve deployed an Elastic Agent to your host and it’s successfully sending data to Elasticsearch, add another integration. For guidance on which integrations you need, look at the list you created earlier when you prepared for the migration.
For example, if the agent policy you created earlier includes the System integration, but you also want to monitor Nginx:
-
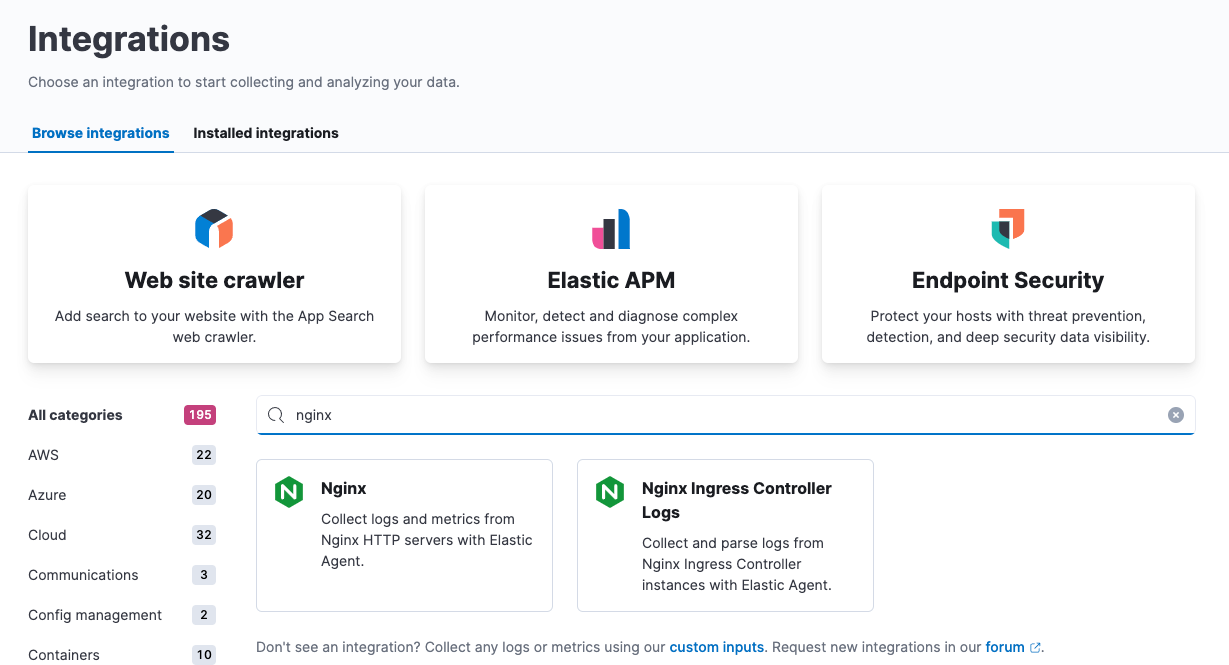
From the main menu in Kibana, click Add integrations and add the Nginx integration.
-
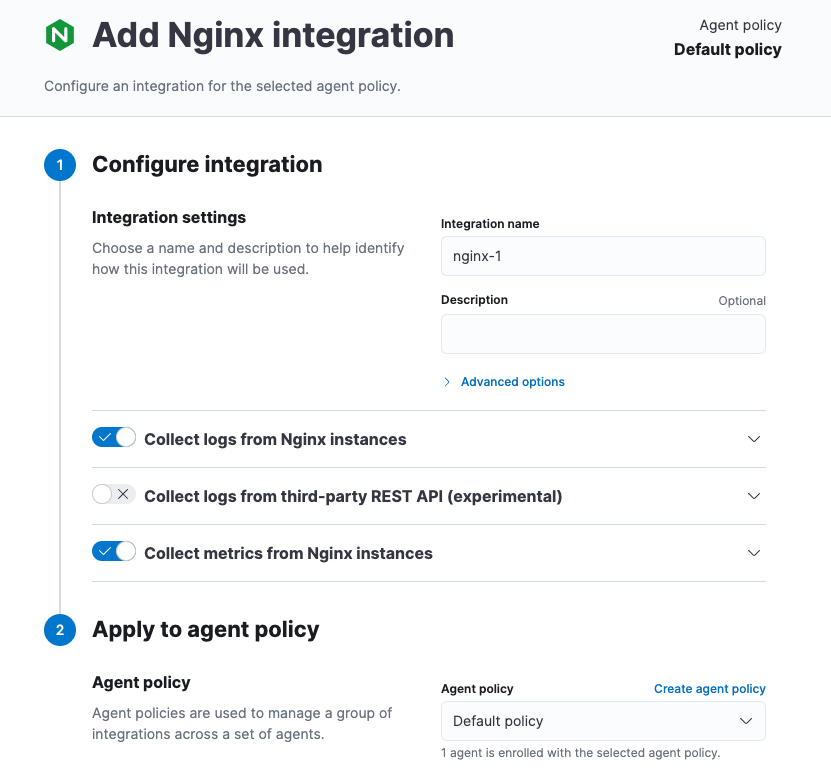
Configure the integration, then apply it to the agent policy you used earlier. Make sure you expand collapsed sections to see all the settings like log paths.
When you save and deploy your changes, the agent policy is updated to include a new integration policy for Nginx. All Elastic Agents enrolled in the agent policy get the updated policy, and the Elastic Agent running on your host will begin collecting Nginx data.
Integration policy names must be globally unique across all agent policies.
-
Go back to Fleet > Agents and verify that the agent status is still healthy. Click the host name to drill down into the agent details. From there, you can see the agent policy and integration policies that are applied.
If the agent status is not Healthy, click Logs to view the agent log and troubleshoot the problem.
- Go back to the main Fleet page, and click Data streams to inspect the data streams and navigate to the pre-built dashboards installed with the integration.
Notice again that the data is duplicated because you still have Beats running and sending data.
Migrate processor configurations
editProcessors enable you to filter and enhance the data before it’s sent to the output. Each processor receives an event, applies a defined action to the event, and returns the event. If you define a list of processors, they are executed in the order they are defined. Elastic provides a rich set of processors that are supported by all Beats and by Elastic Agent.
Prior to migrating from Beats, you defined processors in the configuration file for each Beat. After migrating to Elastic Agent, however, the Beats configuration files are redundant. All configuration is policy-driven from Fleet (or for advanced use cases, specified in a standalone agent policy). Any processors you defined previously in the Beats configuration need to be added to an integration policy; they cannot be defined in the Beats configuration.
Globally-defined processors are not currently supported by Elastic Agent. You must define processors in each integration policy where they are required.
To add processors to an integration policy:
- In Kibana, go to Fleet > Agent policies, and click the policy name to view its integration policies.
- Click the name of the integration policy to edit it.
-
Click the down arrow next to enabled streams, and under Advanced options, add the processor definition. The processor will be applied to the data set where it’s defined.
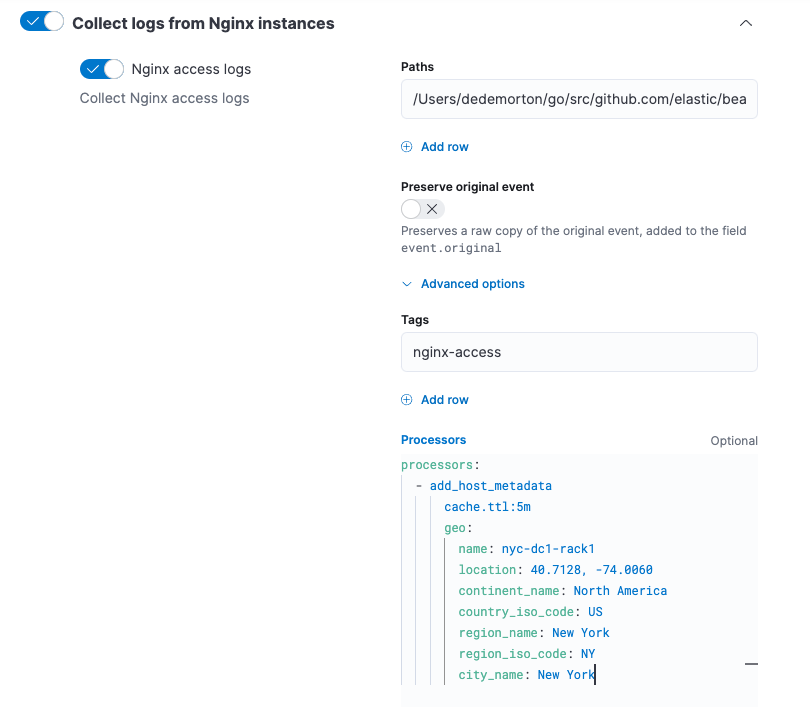
For example, the following processor adds geo-specific metadata to host events:
- add_host_metadata:
    cache.ttl: 5m
    geo:
      name: nyc-dc1-rack1
      location: 40.7128, -74.0060
      continent_name: North America
      country_iso_code: US
      region_name: New York
      region_iso_code: NY
      city_name: New York
In Kibana, look at the data again to confirm it contains the fields you expect.
Preserve raw events
editIn some cases, Beats modules preserve the original, raw event, which consumes more storage space, but may be a requirement for compliance or forensic use cases.
In Elastic Agent, this behavior is optional and disabled by default.
If you must preserve the raw event, edit the integration policy, and for each enabled data stream, click the Preserve original event toggle.
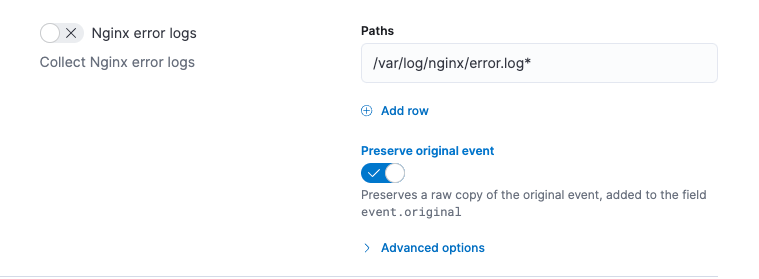
Do this for every data stream with a raw event you want to preserve.
Migrate custom dashboards
editElastic integration packages provide many assets, such as pre-built dashboards, to make it easier for you to visualize your data. In some cases, however, you might have custom dashboards you want to migrate.
Because Elastic Agent uses different data streams, the fields exported by an Elastic Agent are slightly different from those exported Beats. Any custom dashboards that you created for Beats need to be modified or recreated to use the new fields.
You have a couple of options for migrating custom dashboards:
- (Recommended) Recreate the custom dashboards based on the new data streams.
- Create index aliases to point to the new data streams and continue using custom dashboards.
Create index aliases to point to data streams
editYou may want to continue using your custom dashboards if the dashboards installed with an integration are not adequate. To do this, use index aliases to feed data streams into your existing custom dashboards.
For example, custom dashboards that point to filebeat- or metricbeat- can be
aliased to use the equivalent data streams, logs- and metrics-.
To use aliases:
-
Add a
filebeatalias to thelogs-data stream. For example:POST _aliases { "actions": [ { "add": { "index": "logs-*", "alias": "filebeat-" } } ] } -
Add a
metribeatalias to themetrics-data stream.POST _aliases { "actions": [ { "add": { "index": "metrics-*", "alias": "metricbeat-" } } ] }
These aliases must be added to both the index template and existing indices.
Note that custom dashboards will show duplicated data until you remove Beats from your hosts.
For more information, see the Aliases documentation.
Migrate index lifecycle policies
editIndex lifecycle management (ILM) policies in Elasticsearch enable you to manage indices according to your performance, resiliency, and retention requirements. To learn more about ILM, refer to the ILM documentation.
ILM is configured by default in Beats (version 7.0 and later) and in Elastic Agent (all versions). To view the index lifecycle policies defined in Elasticsearch, go to Management > Index Lifecycle Policies.
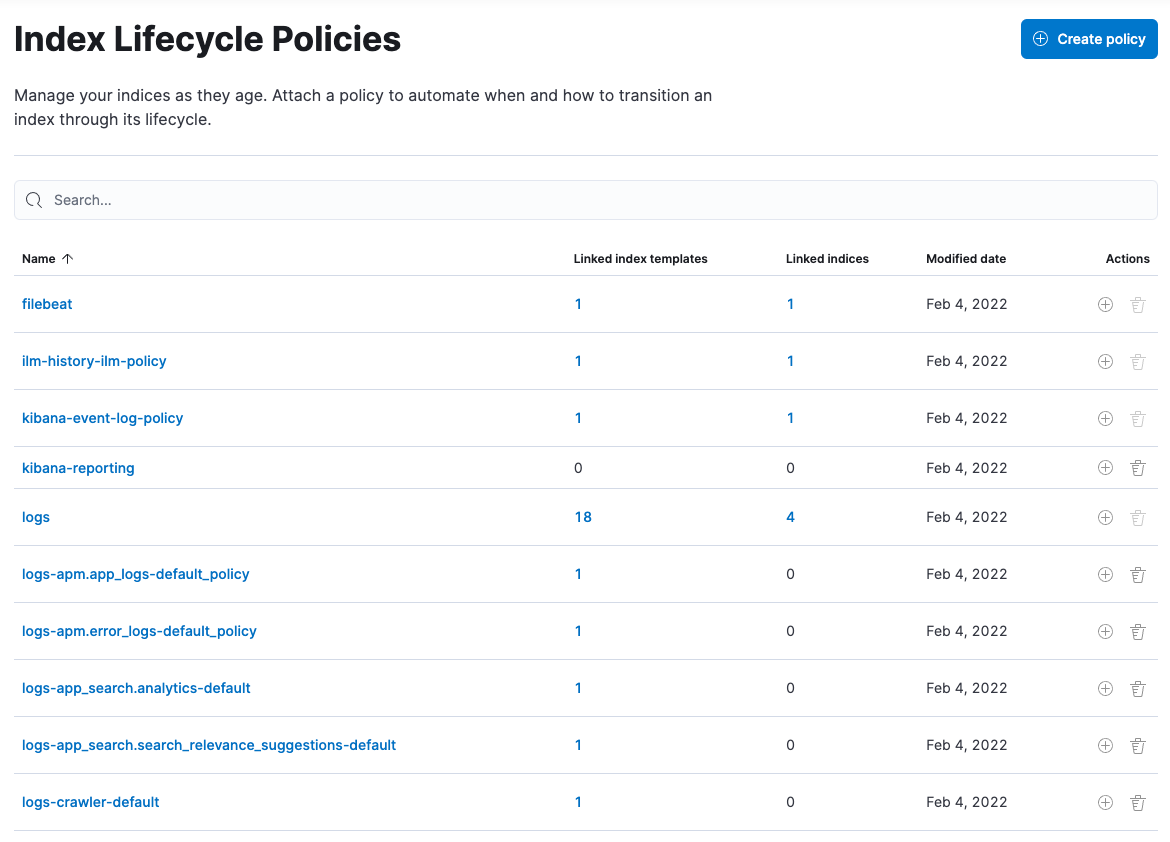
If you used ILM with Beats, you’ll see index lifecycle policies like
filebeat and metricbeat in the list. After migrating to Elastic Agent, you’ll see
polices named logs and metrics, which encapsulate the ILM policies for all
logs-* and metrics-* index templates.
When you migrate from Beats to Elastic Agent, you have a couple of options for migrating index policy settings:
-
Modify the newly created index lifecycle policies (recommended). As mentioned earlier, ILM is enabled by default when the Elastic Agent is installed. Index lifecycle policies are created and added to the index templates for data streams created by integrations.
If you have existing index lifecycle policies for Beats, it’s highly recommended that you modify the lifecycle policies for Elastic Agent to match your previous policy. To do this:
- In Kibana, go to Stack Management > Index Lifecycle Policies and search for a Beats policy, for example, filebeat. Under Linked indices, notice you can view indices linked to the policy. Click the policy name to see the settings.
- Click the logs policy and, if necessary, edit the settings to match the old policy.
- Under Index Lifecycle Policies, search for another Beats policy, for example, metricbeat.
- Click the metrics policy and edit the settings to match the old policy.
Optionally delete the Beats index lifecycle policies when they are no longer used by an index.
-
Keep the Beats policy and apply it to the index templates created for data streams. To preserve an existing policy, modify it, as needed, and apply it to all the index templates created for data streams:
- Under Index Lifecycle Policies, find the Beats policy, for example, filebeat.
- In the Actions column, click the Add policy to index template icon.
- Under Index template, choose a data stream index template, then add the policy.
- Repeat this procedure, as required, to apply the policy to other data stream index templates.
Remove Beats from your host
editAny installed Beats shippers will continue to work until you remove them. This allows you to roll out the migration in stages. You will continue to see duplicated data until you remove Beats.
When you’re satisfied with your Elastic Agent deployment, remove Beats from your hosts. All the data collected before installing the Elastic Agent will still be available in Elasticsearch until you delete the data or it’s removed according to the data retention policies you’ve specified for ILM.
To remove Beats from your host:
- Stop the service by using the correct command for your system.
- (Optional) Back up your Beats configuration files in case you need to refer to to them in the future.
- Delete the Beats installation directory. If necessary, stop any orphan processes that are running after you stopped the service.
- If you added firewall rules to allow Beats to communicate on your network, remove them.
- After you’ve removed all Beats, revoke any API keys or remove privileges for any Beats users created to send data to Elasticsearch.