Audit logging
editAudit logging
editThis feature is not available for all Elastic subscription levels. Refer to the subscriptions pages for Elastic Cloud and Elastic Stack. To change your subscription level or start a trial, see Subscriptions and features.
Enterprise Search emits audit log events to help you understand how and when your search experiences have been changed. Actions taken via both API and management dashboard are audited. A single action may generate several audit log events, as events are generated for both the attempted action and for any Enterprise Search entity changes that result. Events are appended to a JSON log file. They are then picked up by an instance of Filebeat that is started by Enterprise Search and appended to an Elasticsearch datastream. This guide aims to give you a deeper understanding of how Enterprise Search handles audit logging.
Structure of an audit log event
editEnterprise Search audit events use Elastic Common Schema. Some fields are of particular interest include:
-
message - A human readable message that summarizes the event being audited.
-
event.category -
This can be either
authenticationif the event occurs during authenticating a request, orprocessif it occurs further along in an action. -
event.outcome -
One of
success,failure, orunknown. -
event.type - Most of the ECS event types are possible here, see https://www.elastic.co/guide/en/ecs/current/ecs-allowed-values-event-type.html
-
event.enterprisesearch.entity - If this is a change event for an Enterprise Search entity, the type of entity being changed.
-
event.enterprisesearch.change - If this is a change event for an Enterprise Search entity, a json representation of the change made.
-
user.name - The username of the user taking this action.
-
user.email - The email address of the user taking this action.
-
user.id - A unique identifier for this user within Enterprise Search.
Enabling and disabling audit log event streams
editAudit logging can be enabled and disabled from the App Search Settings page. Audit logs are enabled by default. Disabling them disables them for both App Search and Workplace Search.
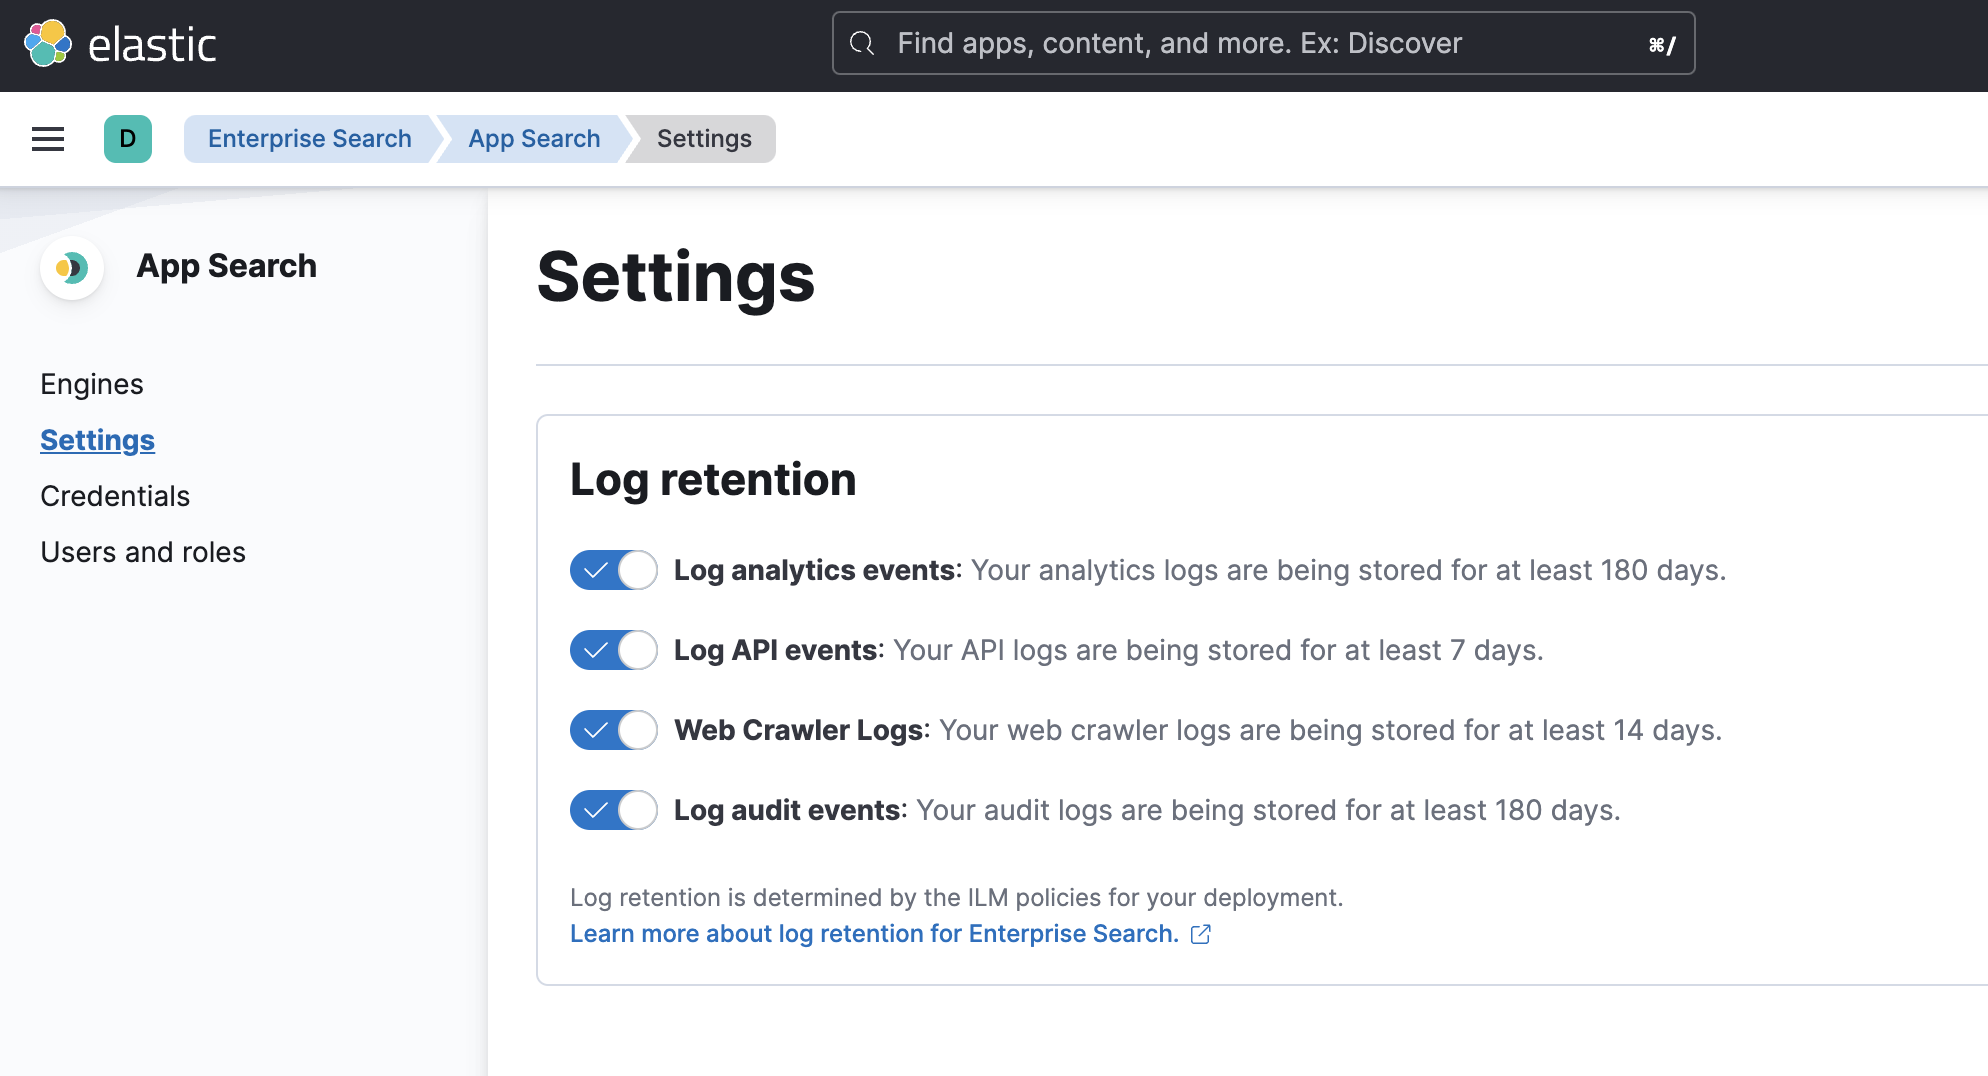
Audit log event retention
editAudit log retention within Elasticsearch defaults to 180 days, and is controlled using Index Lifecycle Managment (ILM). See Log retention.
Audit log file handling configuration
editWhile we recommend viewing your audit log events within Kibana using their data stream, you are also free to consume the audit logs directly from the log file. Configuration options are provided to control the location of the audit log files, the number of files to keep, and the log file size that triggers file rotation. They are as follows:
audit_log_directory: log
audit_log_rotation.keep_files: 7
audit_log_rotation.rotate_every_bytes: 1048576 # 1 MiB
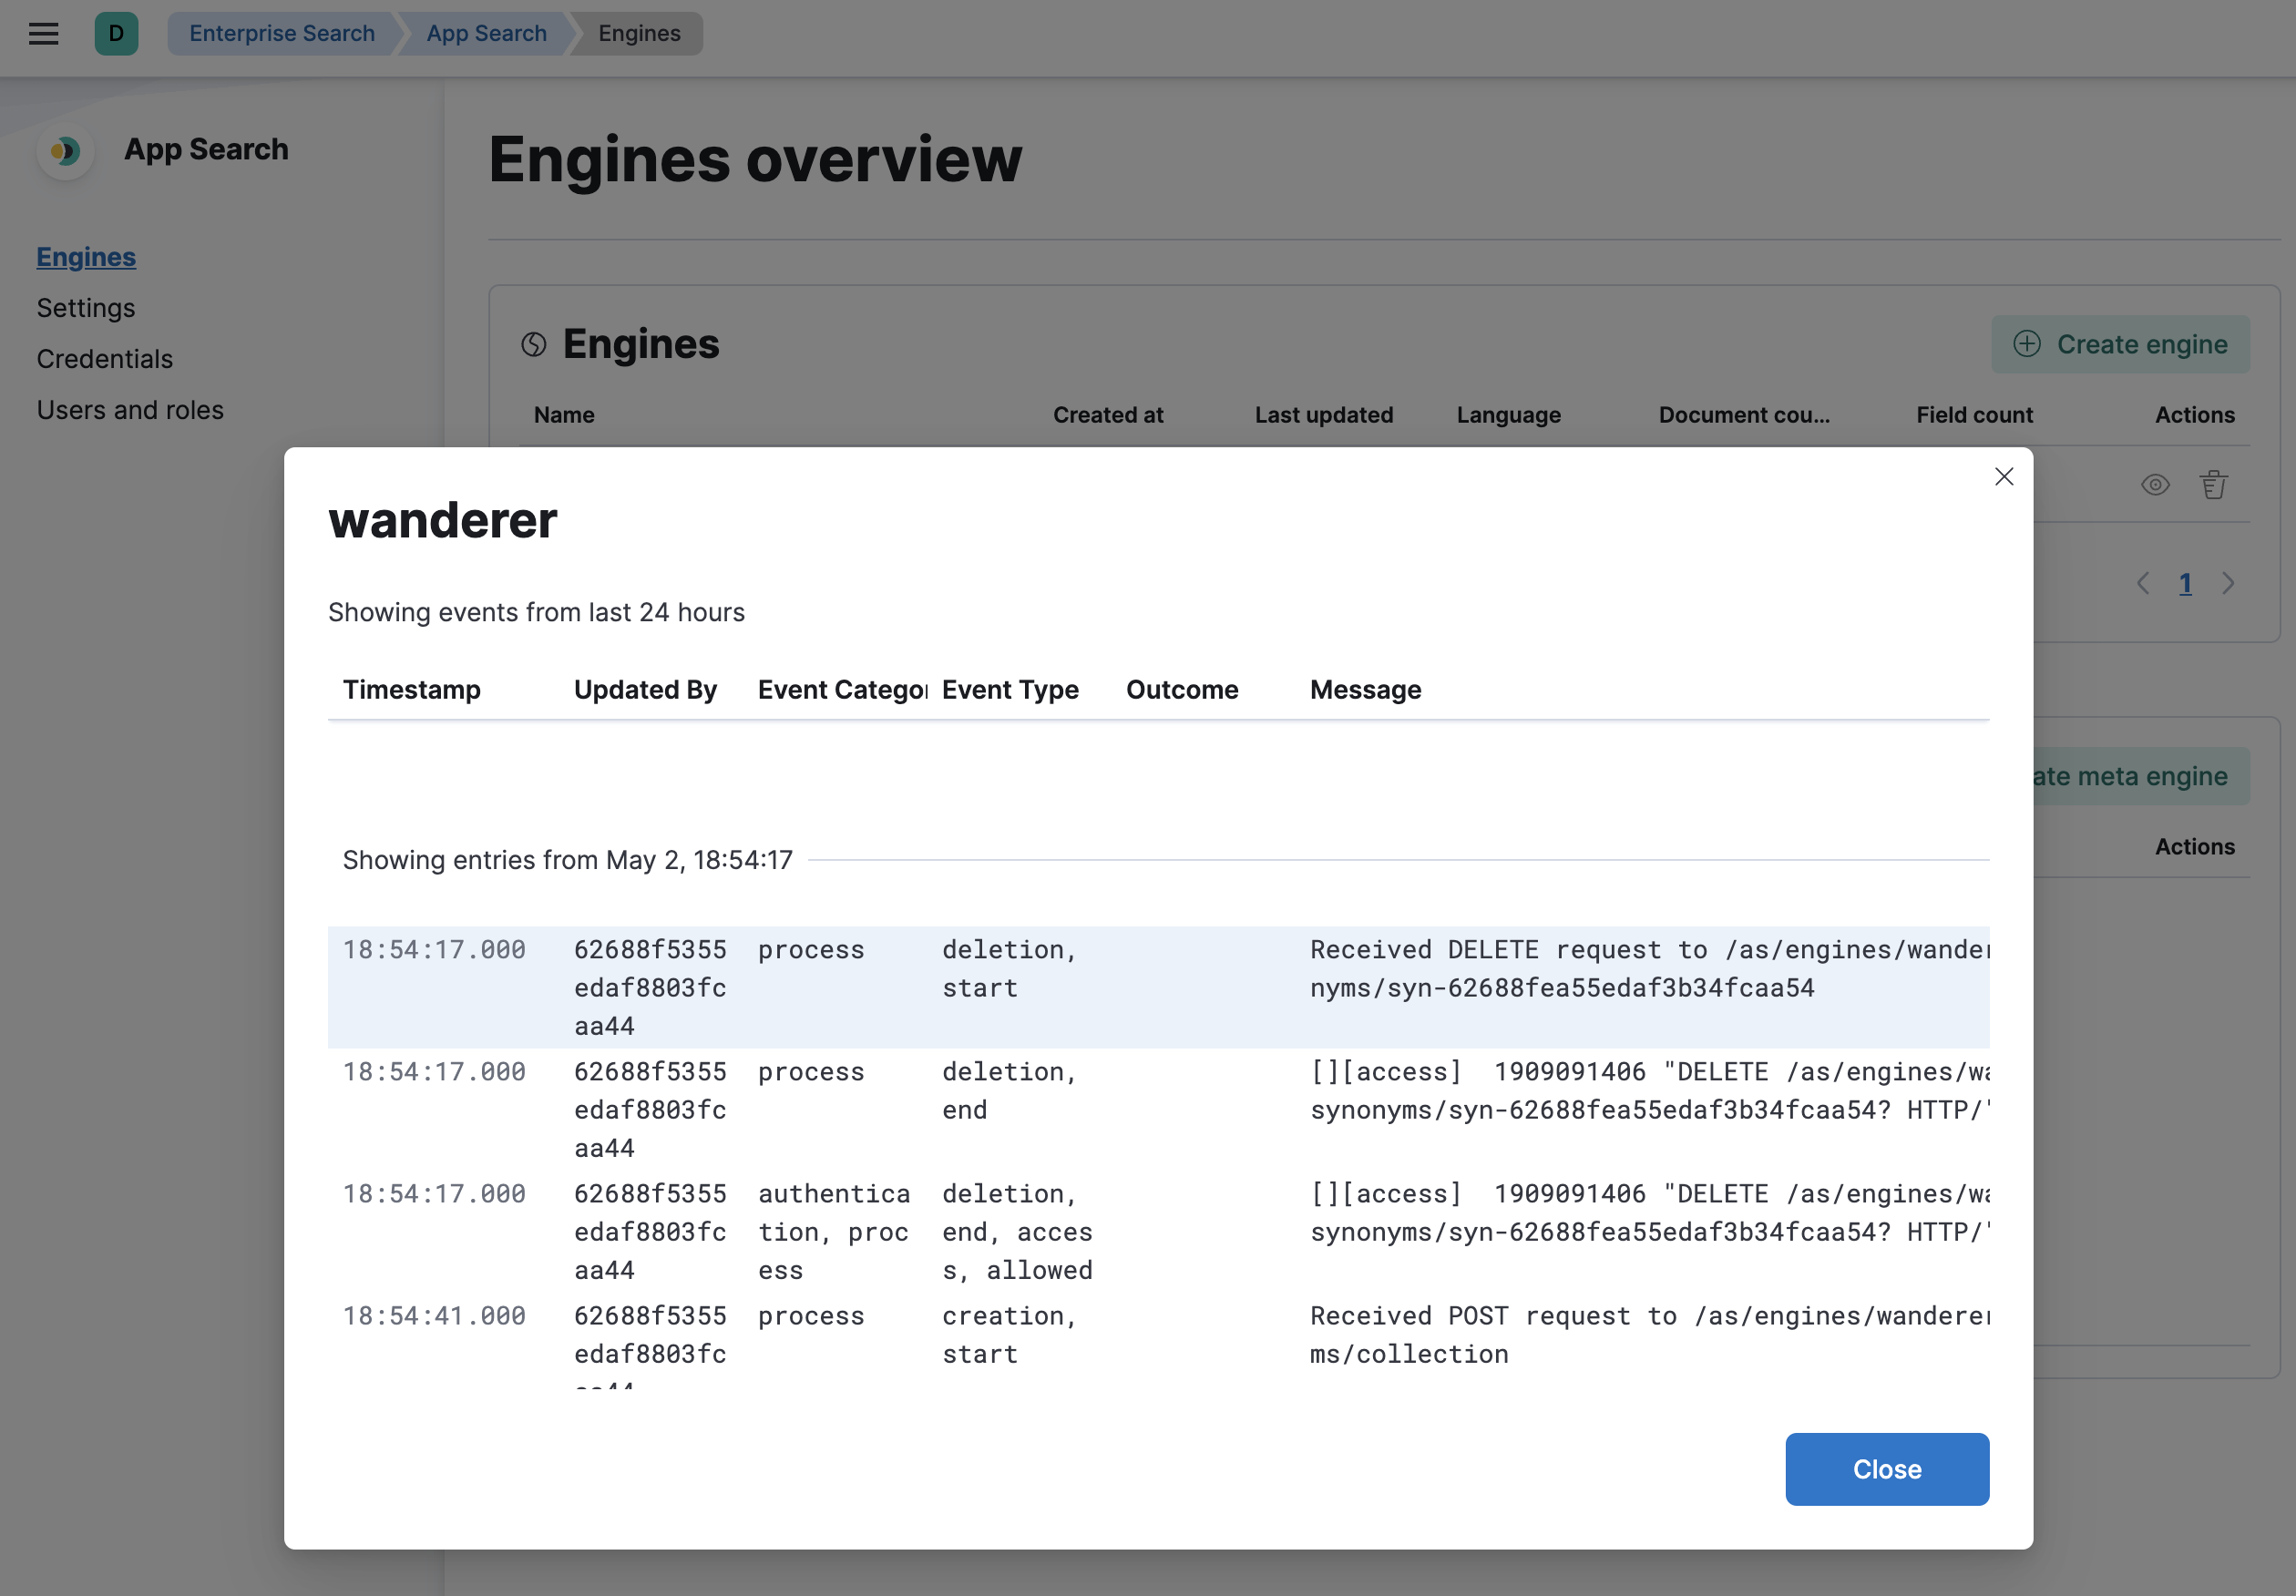
Viewing audit events in App Search
editAudit log events that pertain to an engine can be viewed directly within the Engine Overview page by clicking the "Last Updated" timestamp in Engine Table.
Viewing audit events in Kibana
editAudit log events can also be viewed directly in the Kibana Logs UI or the Discover tab. To view them in the Discover tab, you must first create a Data View for the logs-enterprise_search.audit-default data stream.
If you’re having trouble finding them in the Kibana Logs UI in Observability, try filtering by event.dataset:"enterprise-search-audit".
Read this guide to learn how to create data views, and query your logs in Kibana Logs or Discover.