Kibana highlights
editKibana highlights
editThis list summarizes the most important enhancements in Kibana 8.3.
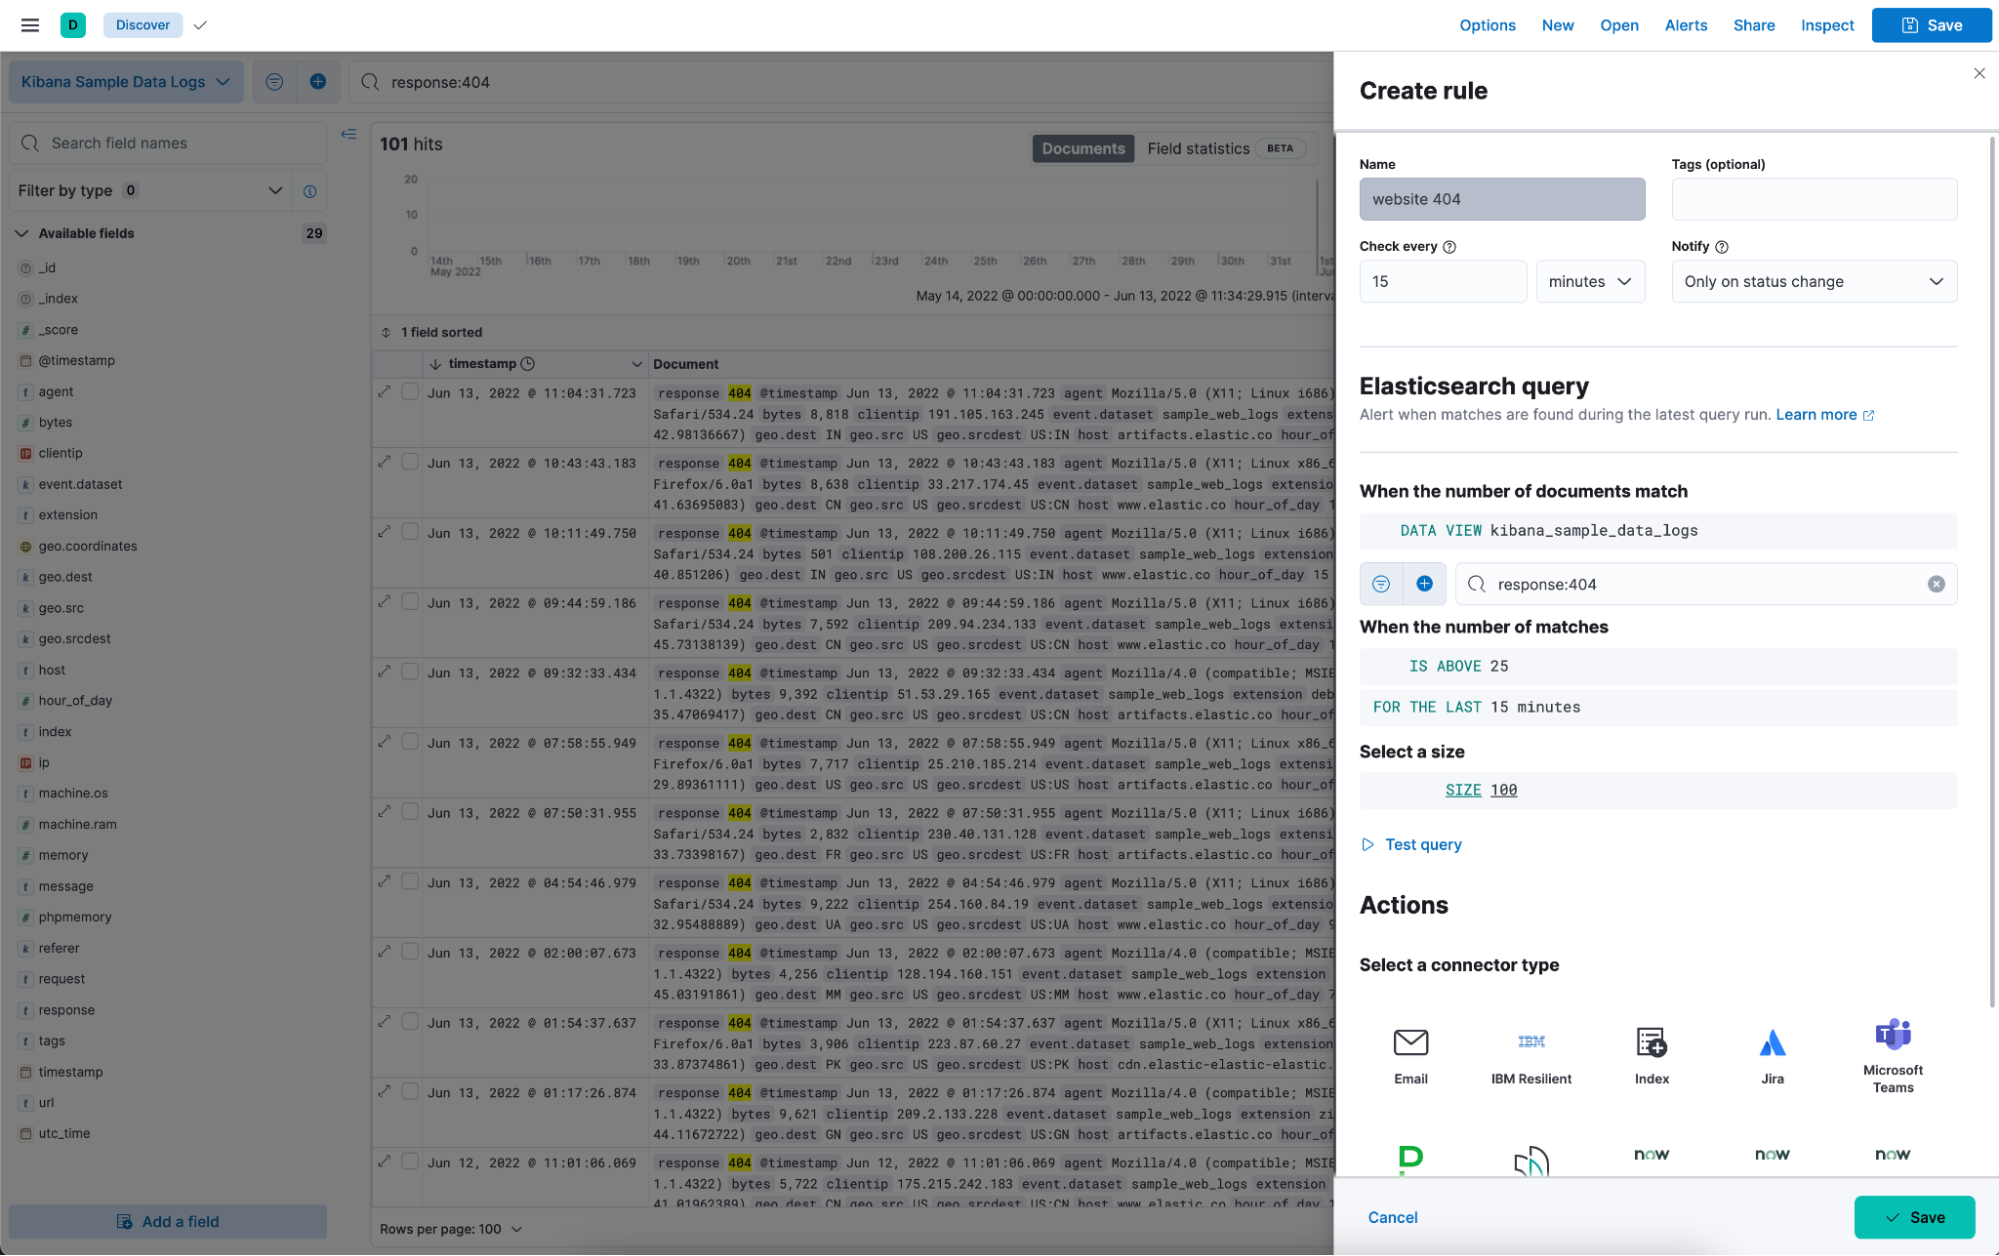
Alerts available from Discover
editYou can now create search threshold rules from Discover, making it easy to be notified when documents change so you can turn your data into action. Start by defining the data view, query, and filter conditions for when you want to be alerted. Then choose the messaging services where you want to be notified when your alert conditions are met, and finally, trigger workflows across third-party integrations such as ServiceNow and Slack. For information about alerts, check Alerting.
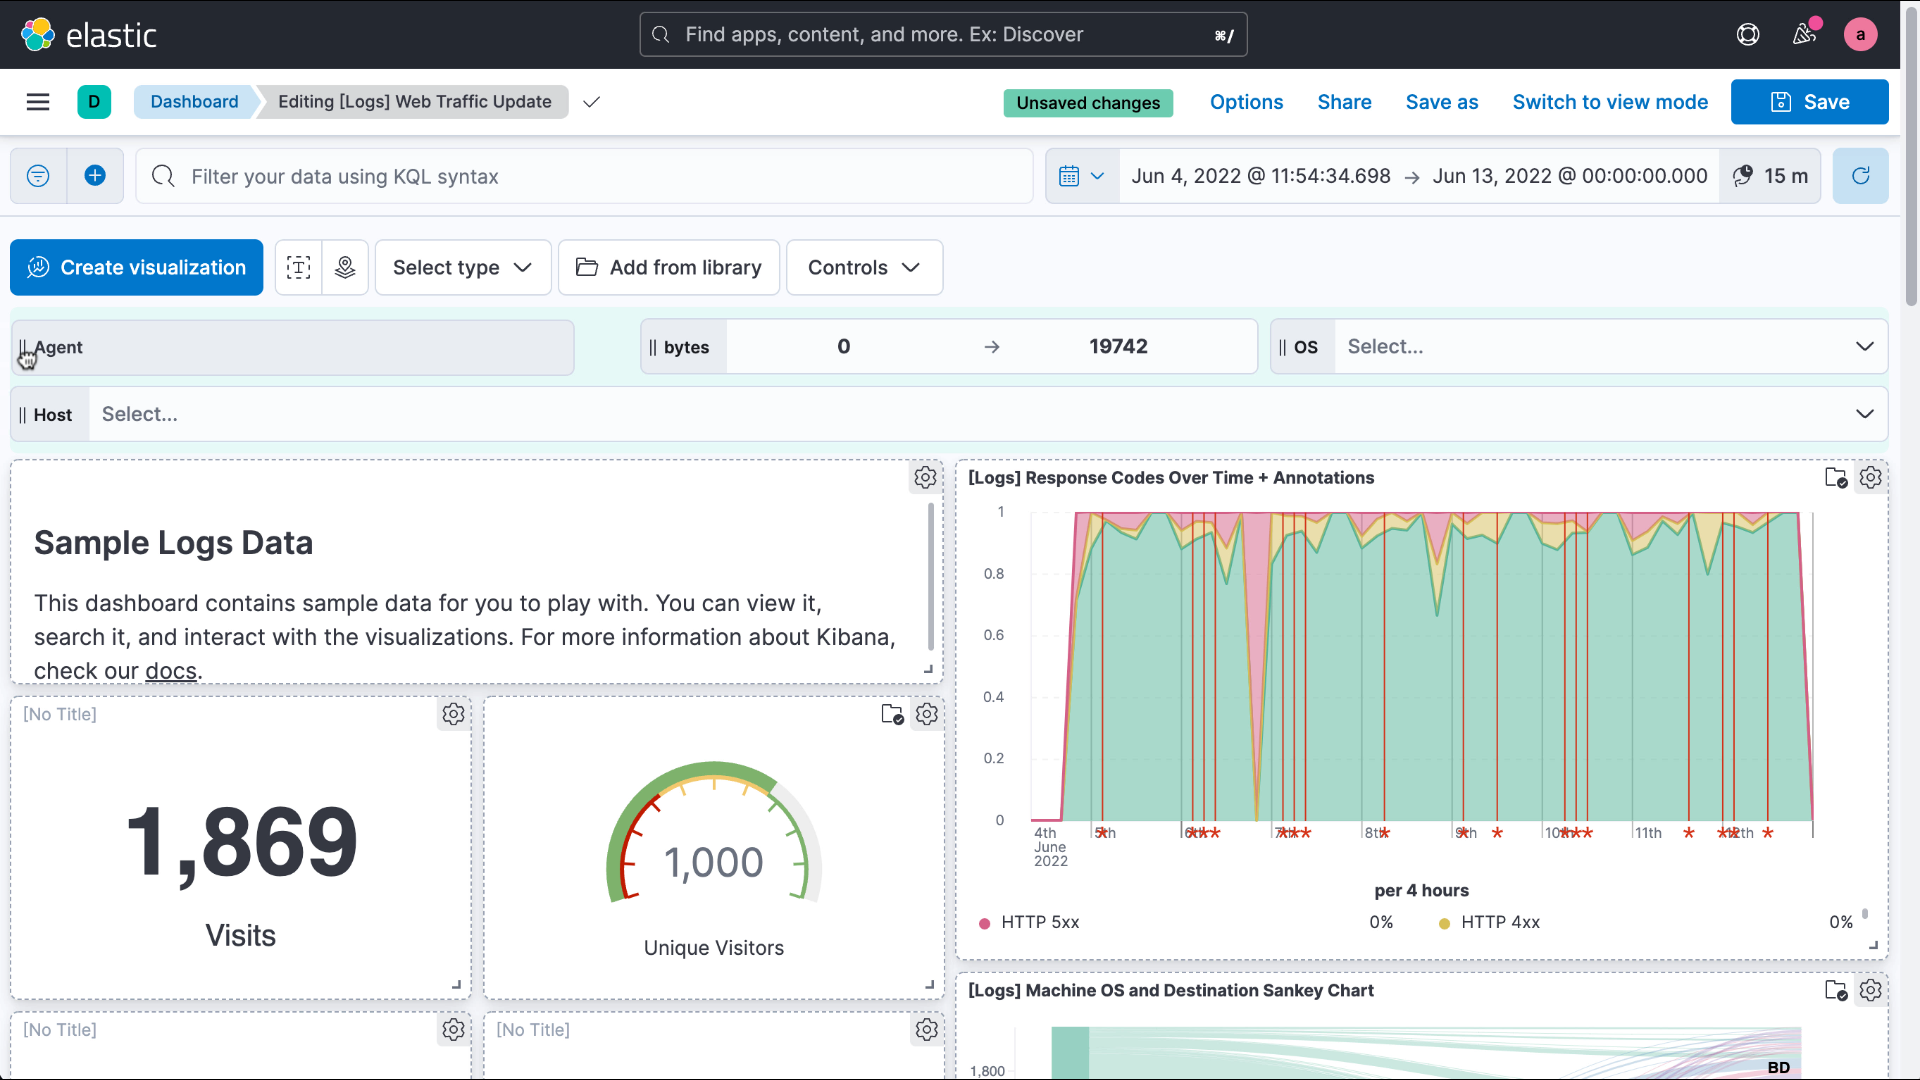
Controls for filtering dashboard data
editDashboard controls bring interactive inputs in an easy drag and drop editing experience. Controls chain, disable when they need to, and offer several filtering form factors that make filtering fast. Now, you can make filtering on popular fields easy for all your dashboard users. For more information, check Filter dashboard data with controls.
Query bar refreshed across Kibana
editThis release brings a modern and responsive query and search experience to Kibana, which makes more room for your data and content.
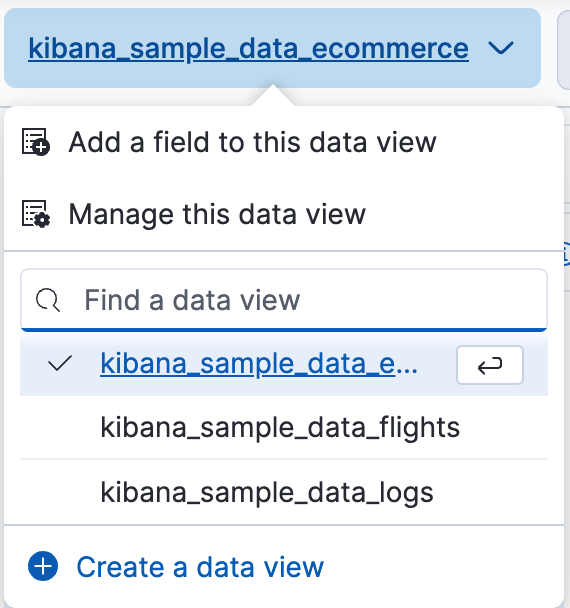
Data view menu
editThe new data view menu consolidates all of the options you need to create, find, and edit your data views in a single location. Need to add a field to your data view? Changed your mind and need to create a data view? No problem. These options are available in the simplified menu.
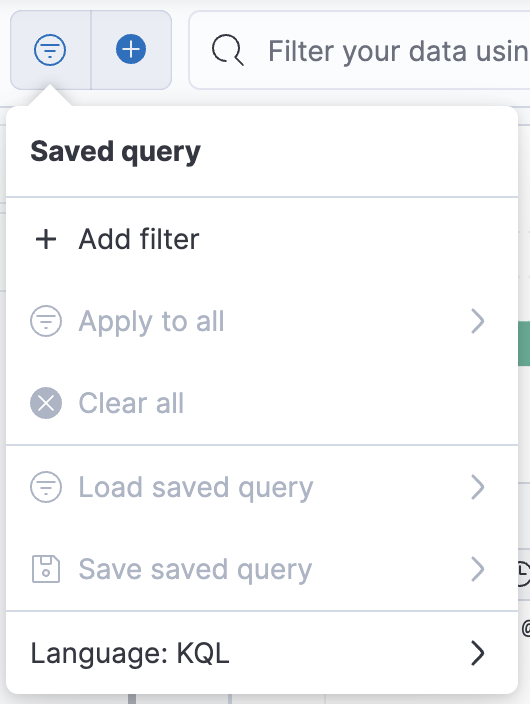
Saved query and Add filter menus
editQuerying and filtering your Elastic data is now easier with the improved Saved query and Add filter menus. The Saved query menu consolidates all of your query and filter needs, including the option to change your filtering language.
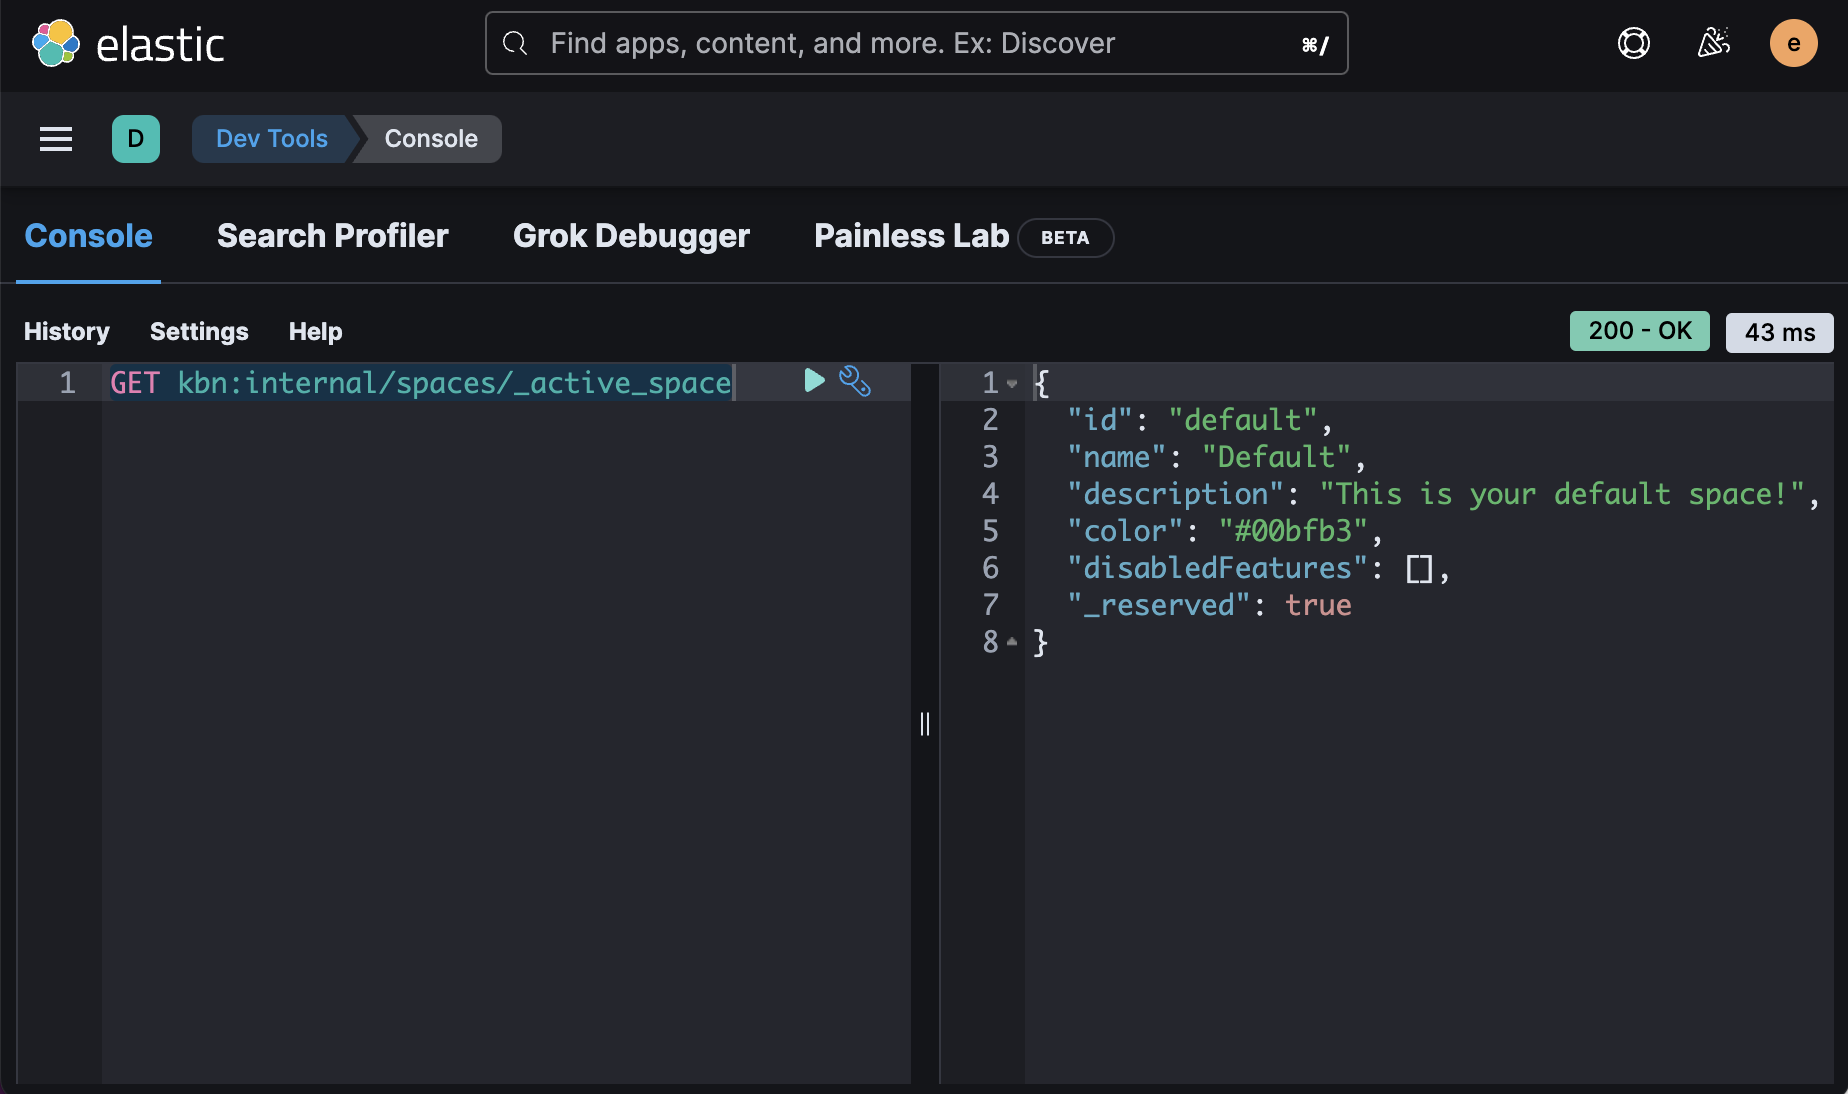
Support for Kibana APIs in Console
editDev Tools > Console now supports sending requests to Kibana APIs.
Prepend any Kibana API endpoint with kbn:
and send the request.
Enhancements to visualization editors
editRange annotations in Lens
editUnlock insights by visualizing event data directly on your Lens visualizations. With range annotations, you can show windows of time such as releases, maintenance windows, holidays, and more to provide context to metric performance. For information about Lens annotations, check Add annotations.
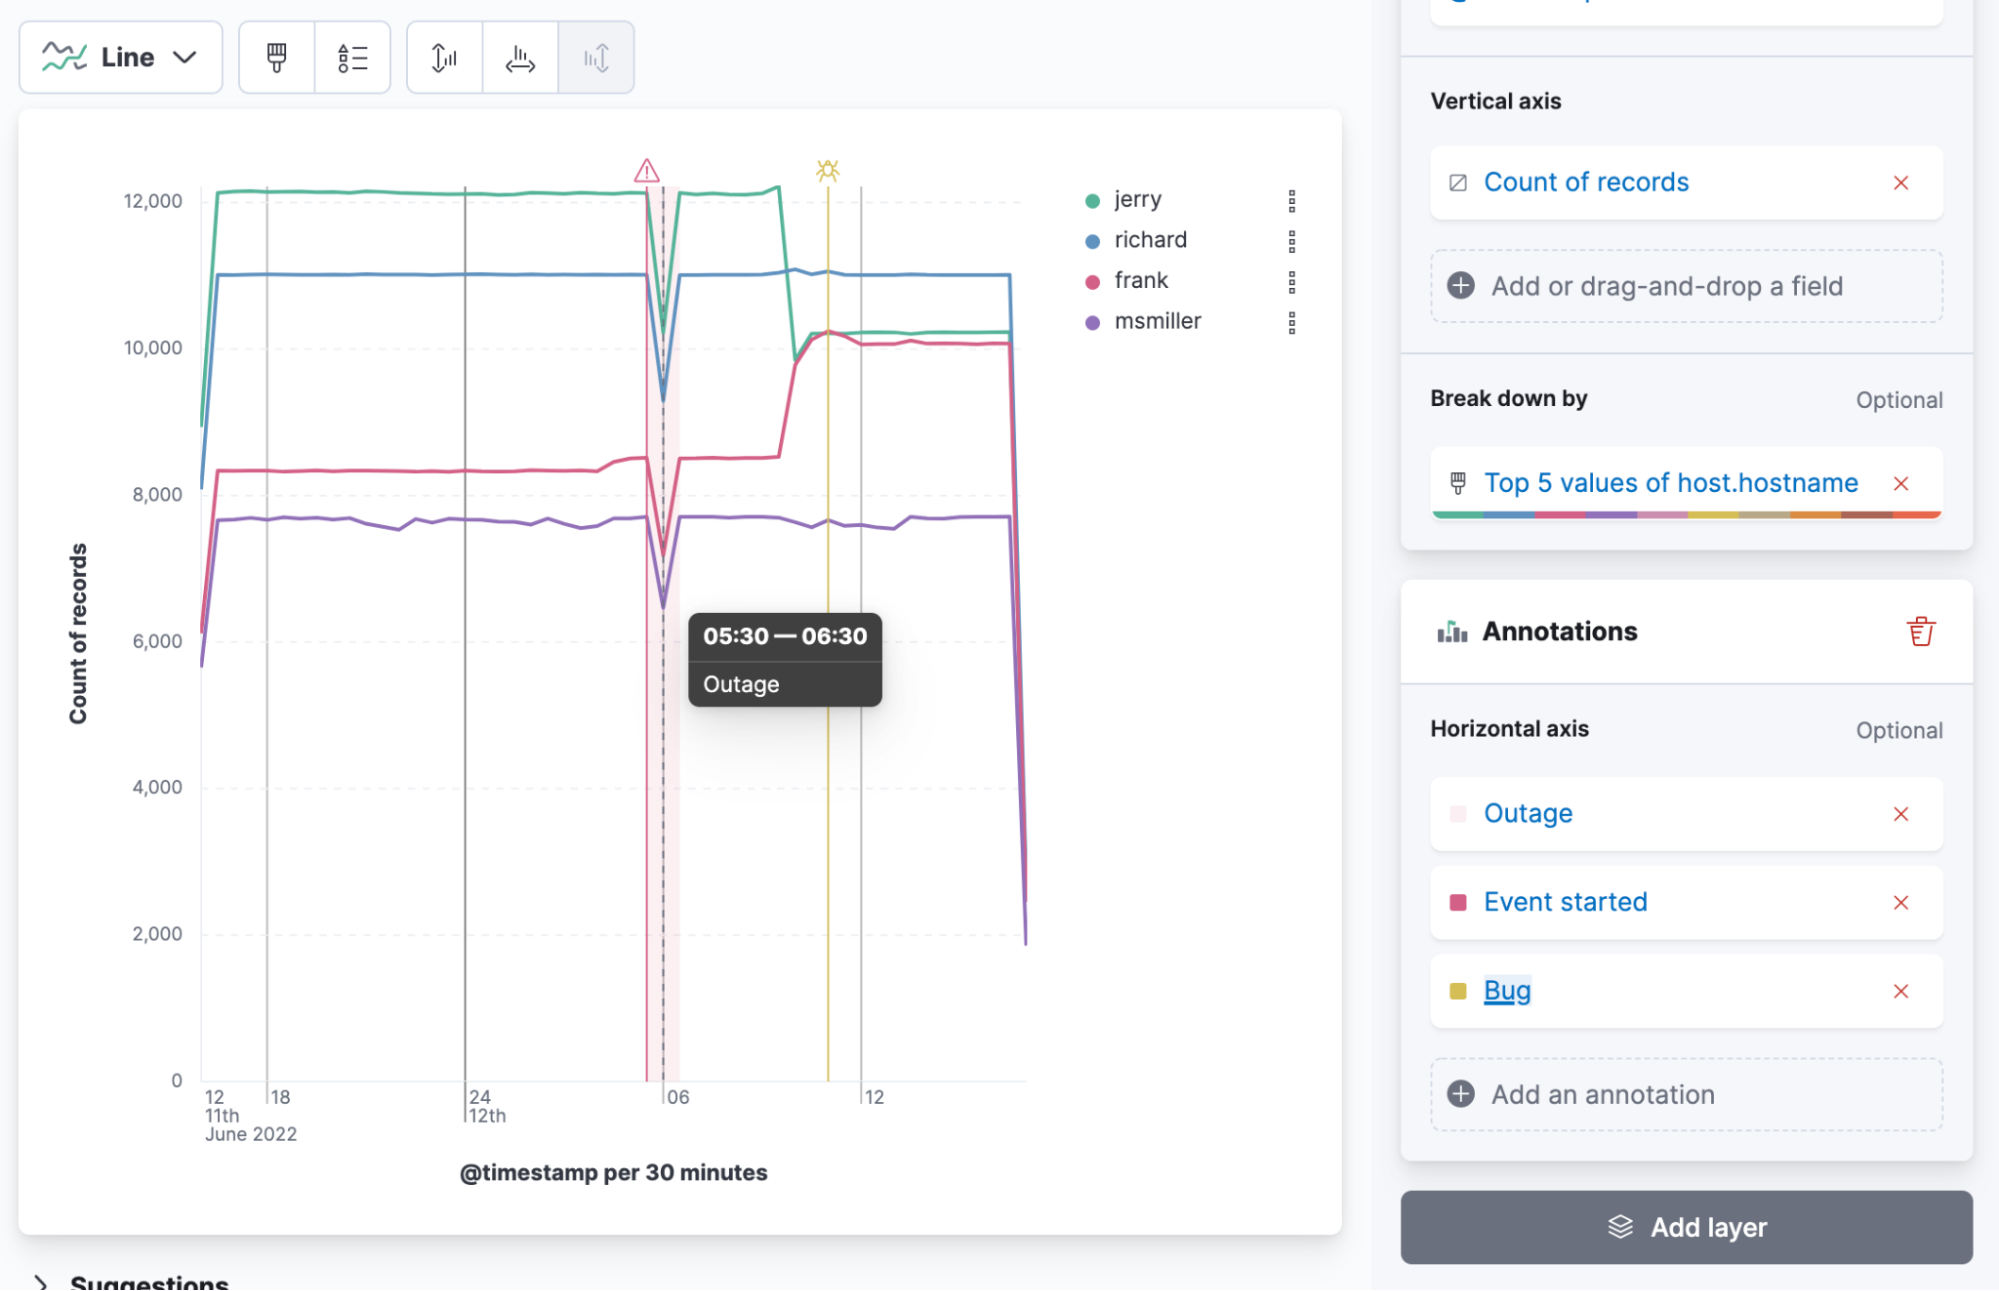
Range annotation inside a visualization
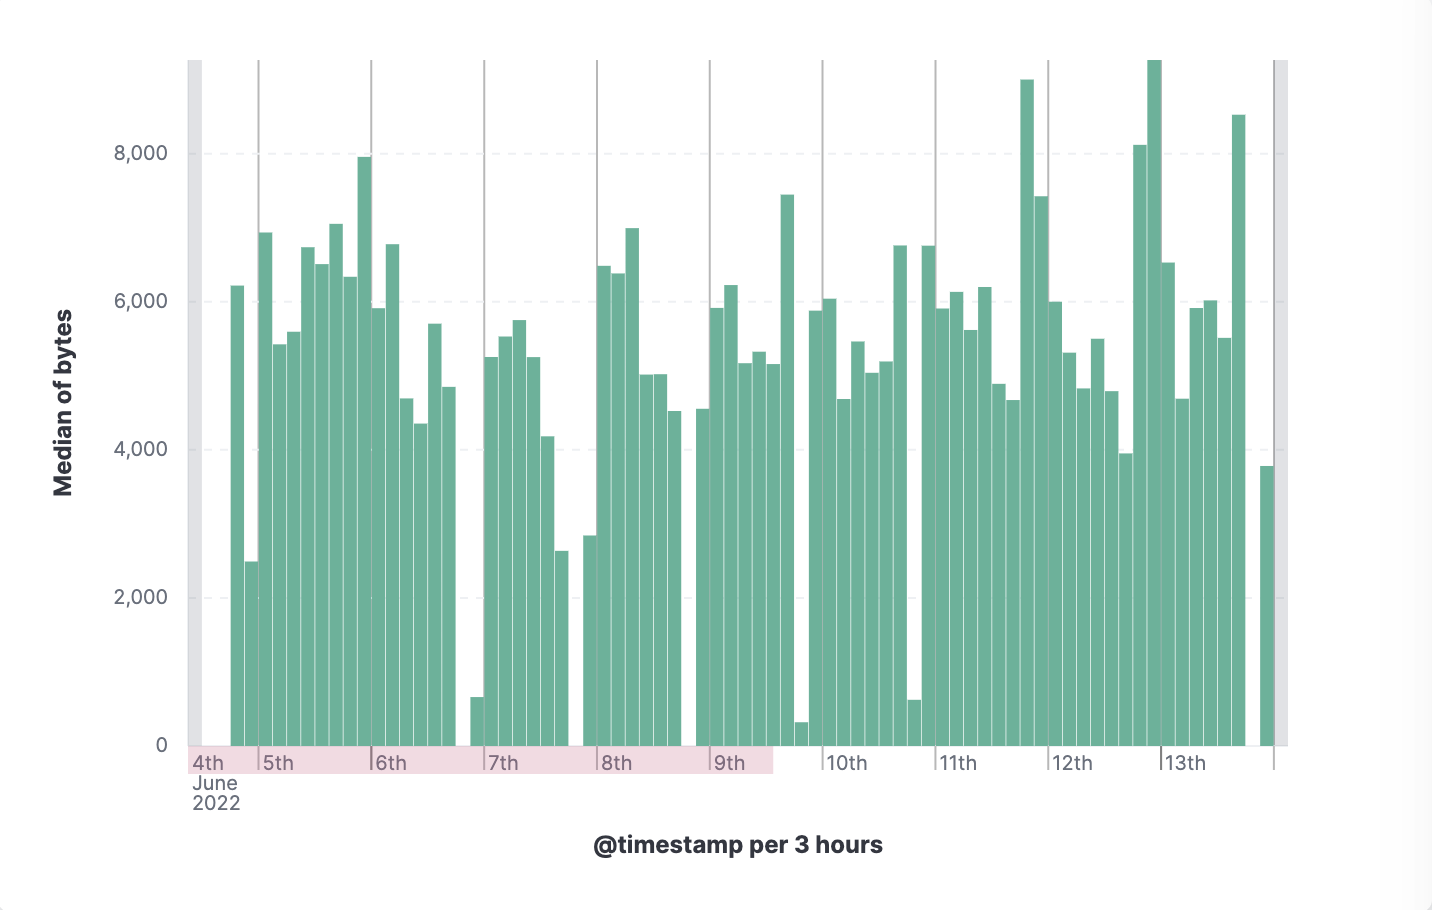
Range annotation outside of a visualization
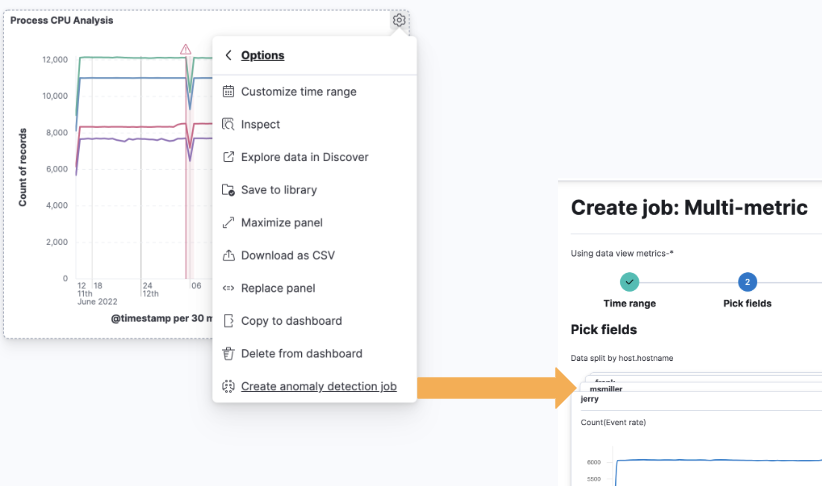
Anomaly jobs from Lens visualizations
editSee something interesting on a visualization on your dashboard? Turn any Lens panel into a new anomaly detection job with the Create anomaly detection job menu option in your dashboards.
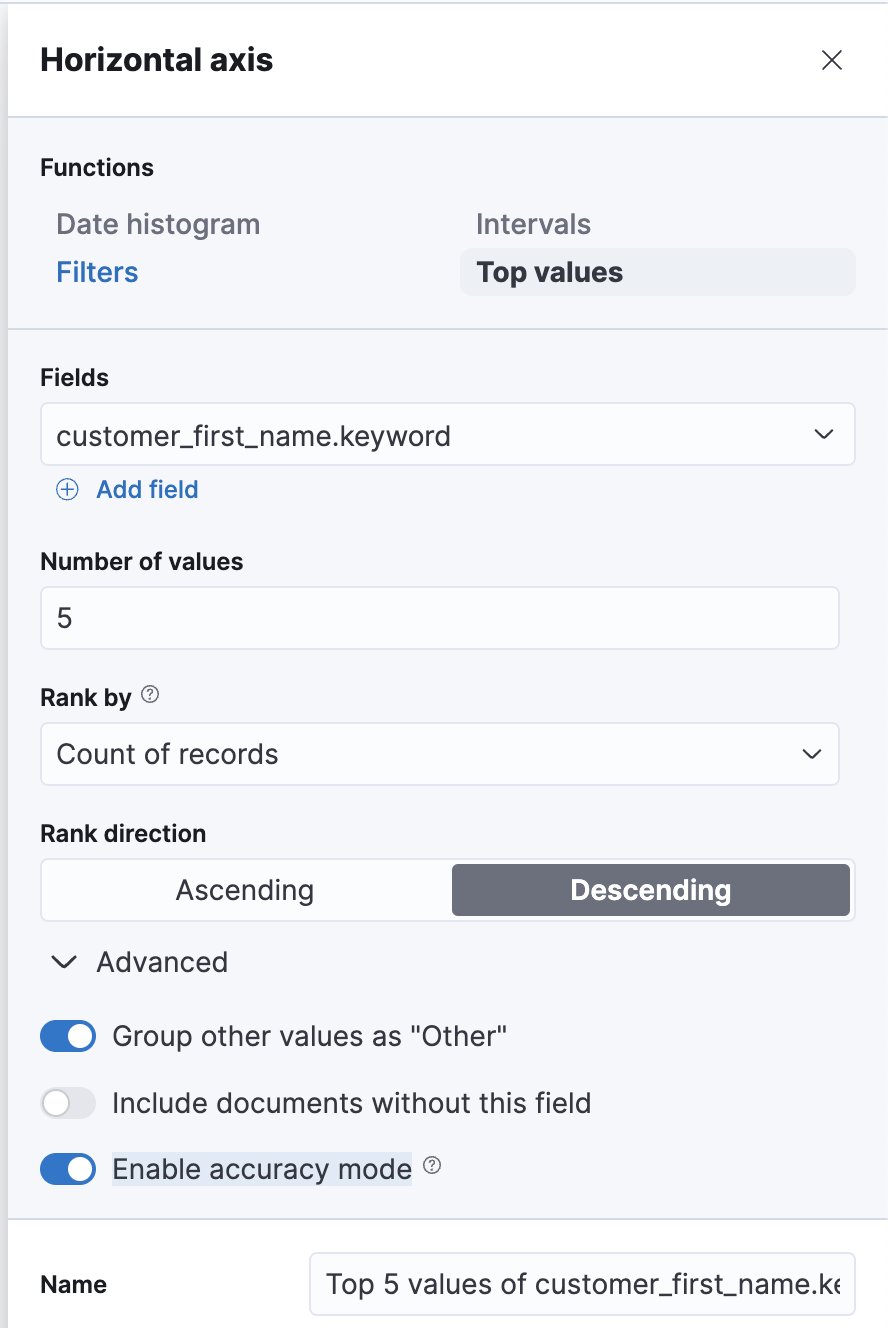
Accuracy mode in Lens
editWhen creating Lens visualizations with the Top values function, you can now enable accuracy mode. This mode improves the accuracy of results for high-cardinality data by using more resources in your Elasticsearch cluster. For information, check Lens.
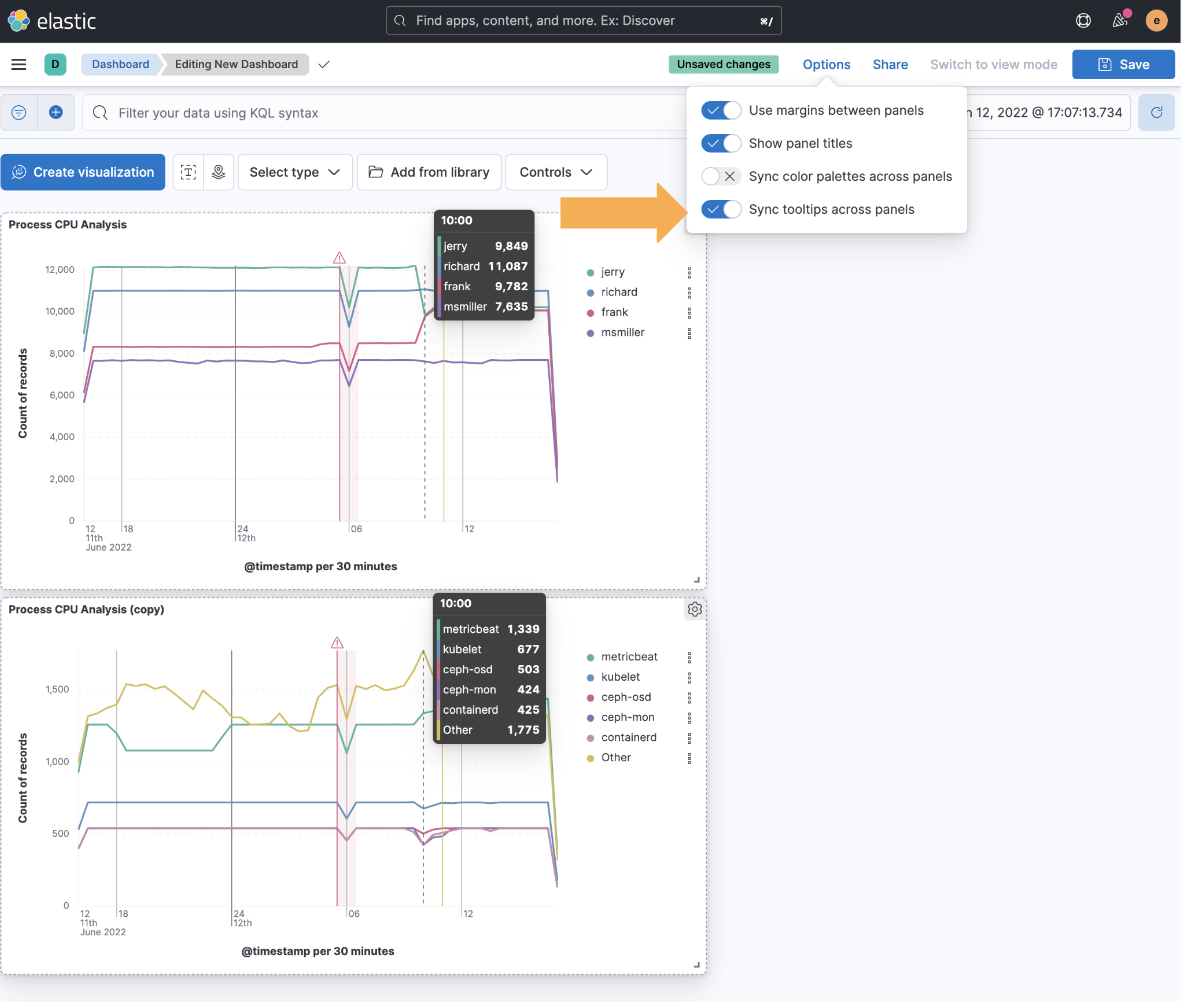
Synchronized tooltips in Lens
editTo make it easier to compare multiple time series visualizations, dashboards now include a Sync tooltips across panels option. When enabled and you hover your cursor over a chart, the tooltips on all other related dashboard charts automatically appear at the same data point or moment in time. For information, check Dashboard.
Collapse break down
editWhen creating Lens tables and XY visualizations, you can now collapse the breakdown dimension, allowing you to summarize aggregated data. For information, check Create custom tables.
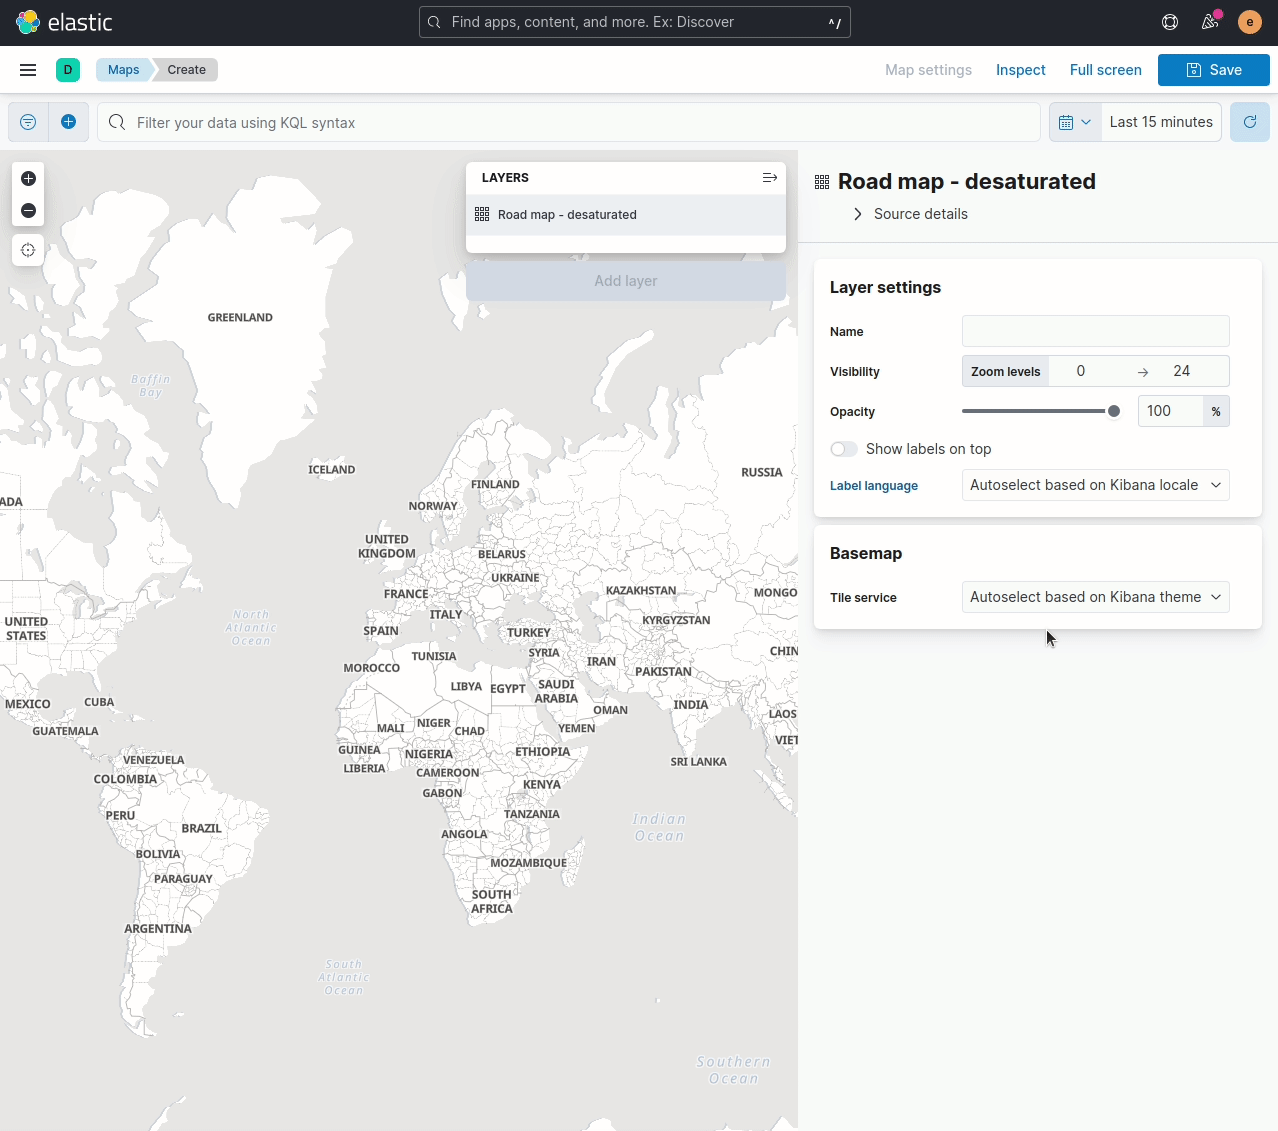
Enhancements to Maps
editLanguage selector
editYou can now select Arabic, German, English, Spanish, French, Hindi, Italian, Japanese, Portuguese, Russian, and Chinese for country and region labels. By default, new maps use the Kibana locale setting to determine the language for basemap labels.
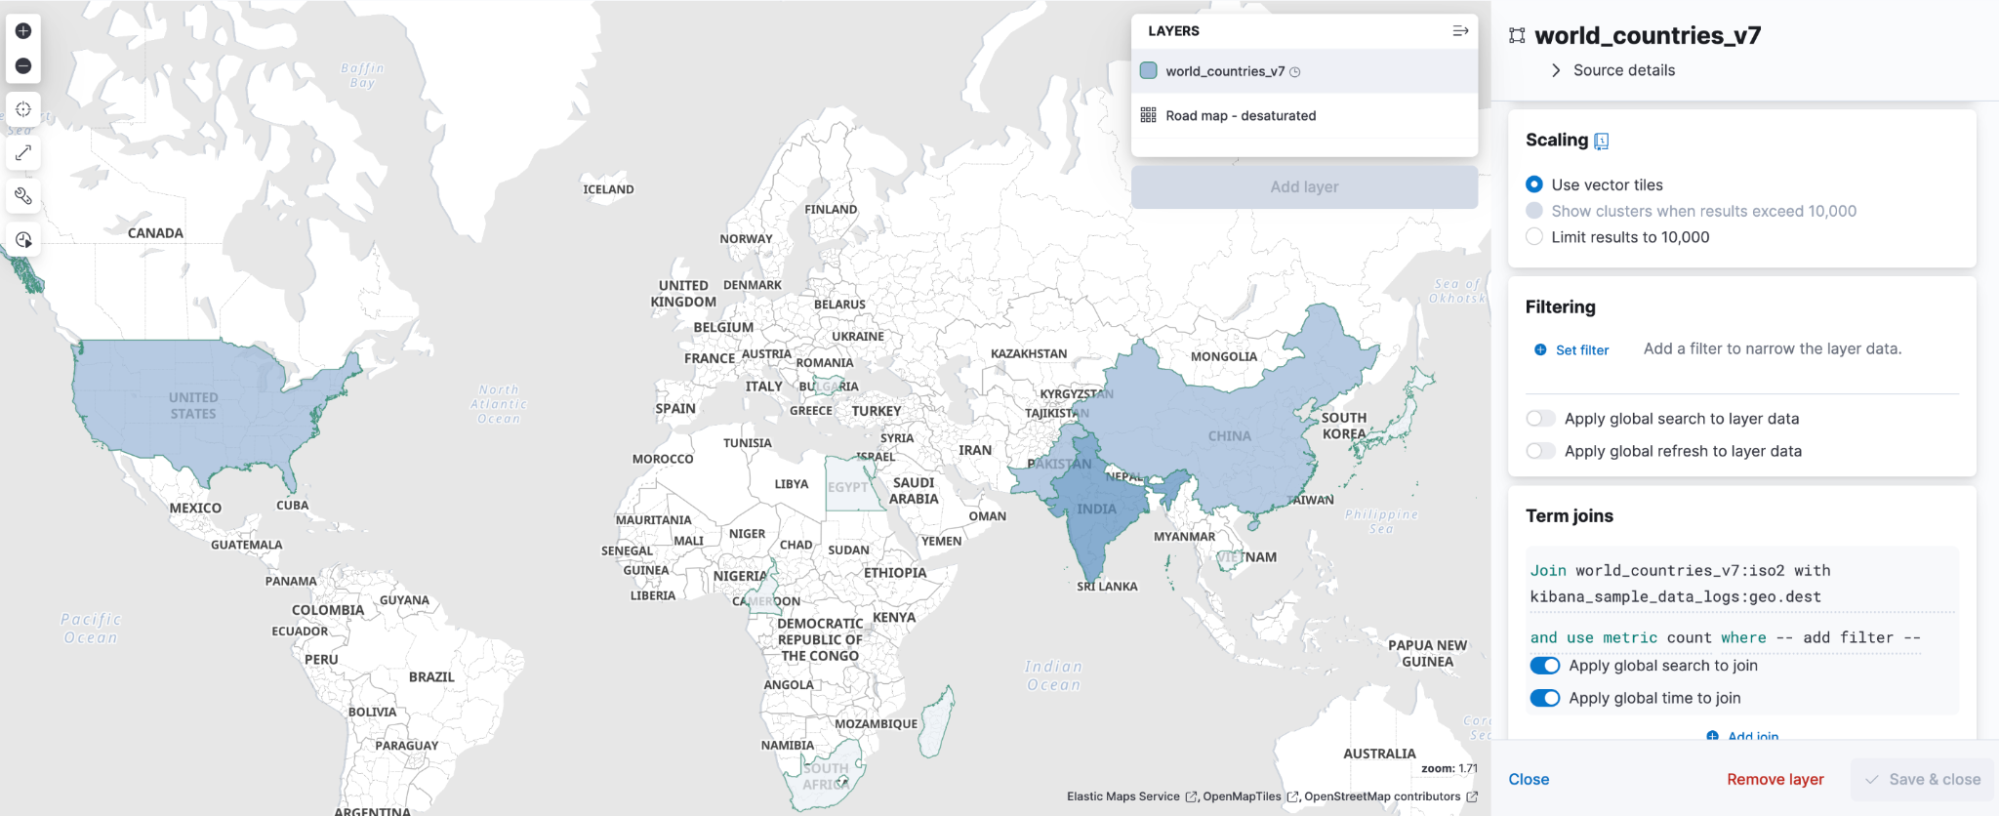
Vector tiles and joins
editAre you using vector tiles? Good news. You are now able to make joins.
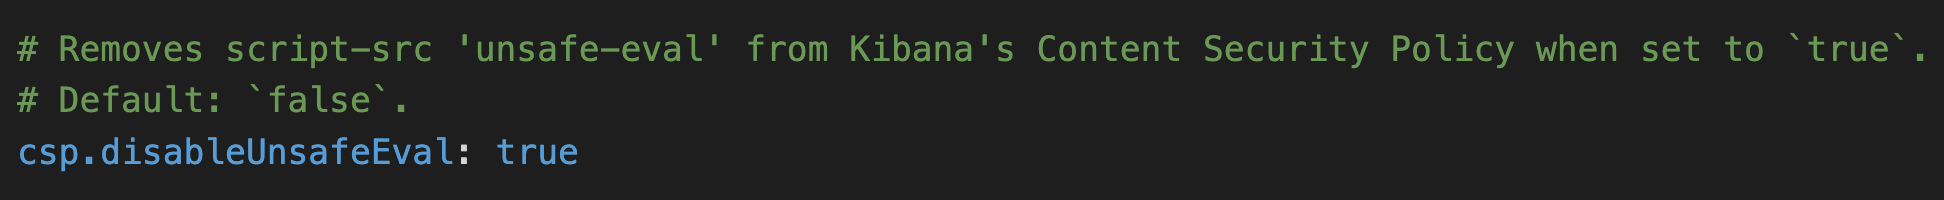
Improved Content Security Policy
editKibana now has experimental support for a more restrictive
Content Security Policy(CSP).
Specifically, we removed the need for script-src 'unsafe-eval',
which provides an additional level of protection against cross-site scripting (XSS) attacks.
To enable this feature, configure csp.disableUnsafeEval: true in your kibana.yml.
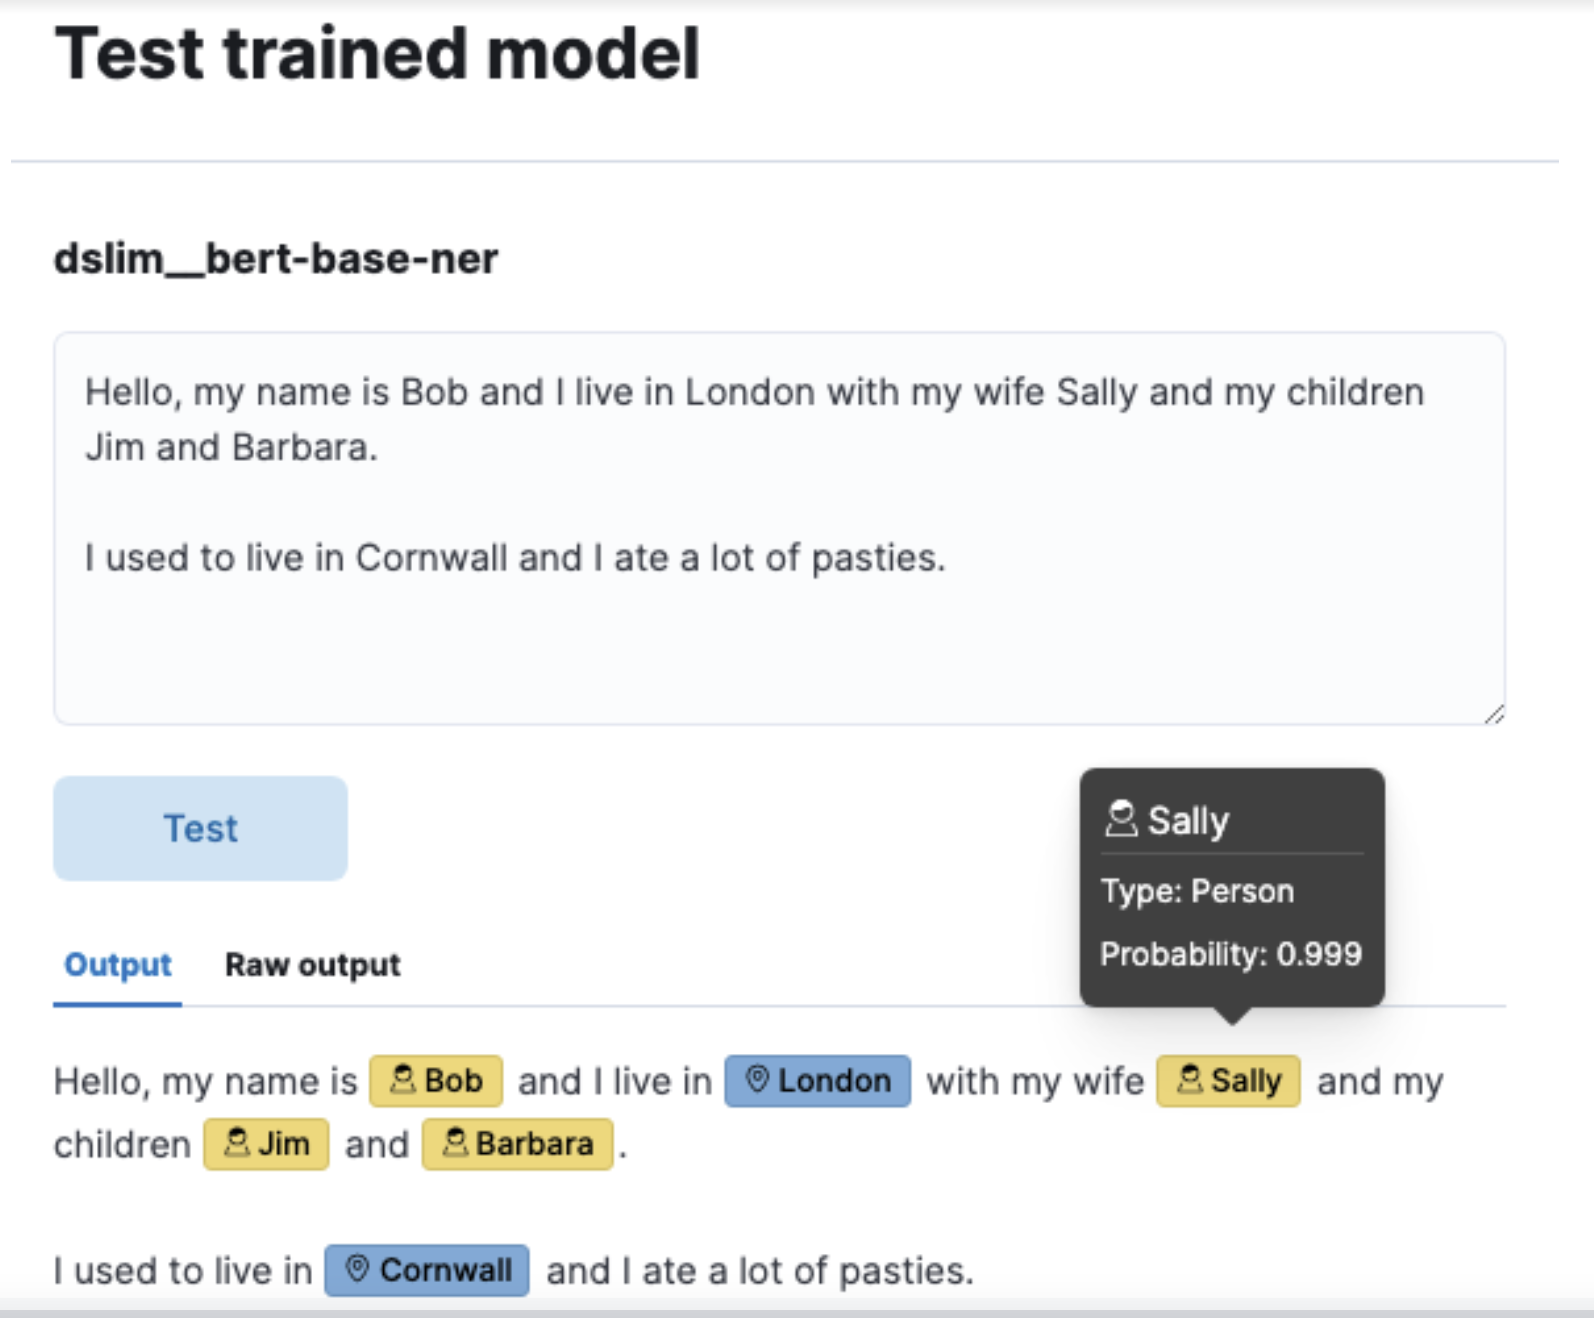
Test trained models in Machine Learning
editYou can now visualize machine learning trained model output. A new test model action in Machine Learning > Trained Models opens up a flyout, where you can enter input text for testing. View the output using text highlighting or as JSON output.
Trained models are available for the following tasks: language identification, named entity recognition (NER), text classification, question answering, zero-shot text classification, text embedding, and fill task.
Enhancements to Alerting
editOAuth support in ServiceNow connectors
editThe ServiceNow connectors now support open authentication (OAuth). For configuration details, refer to ServiceNow ITSM, ServiceNow SecOps, and ServiceNow ITOM connector.
Severity levels on cases
editYou can now assign a severity level to each of your cases (critical, high, medium, or low). You can also view information about the average duration of your cases and delete comments in Kibana.
Enhancements to Osquery
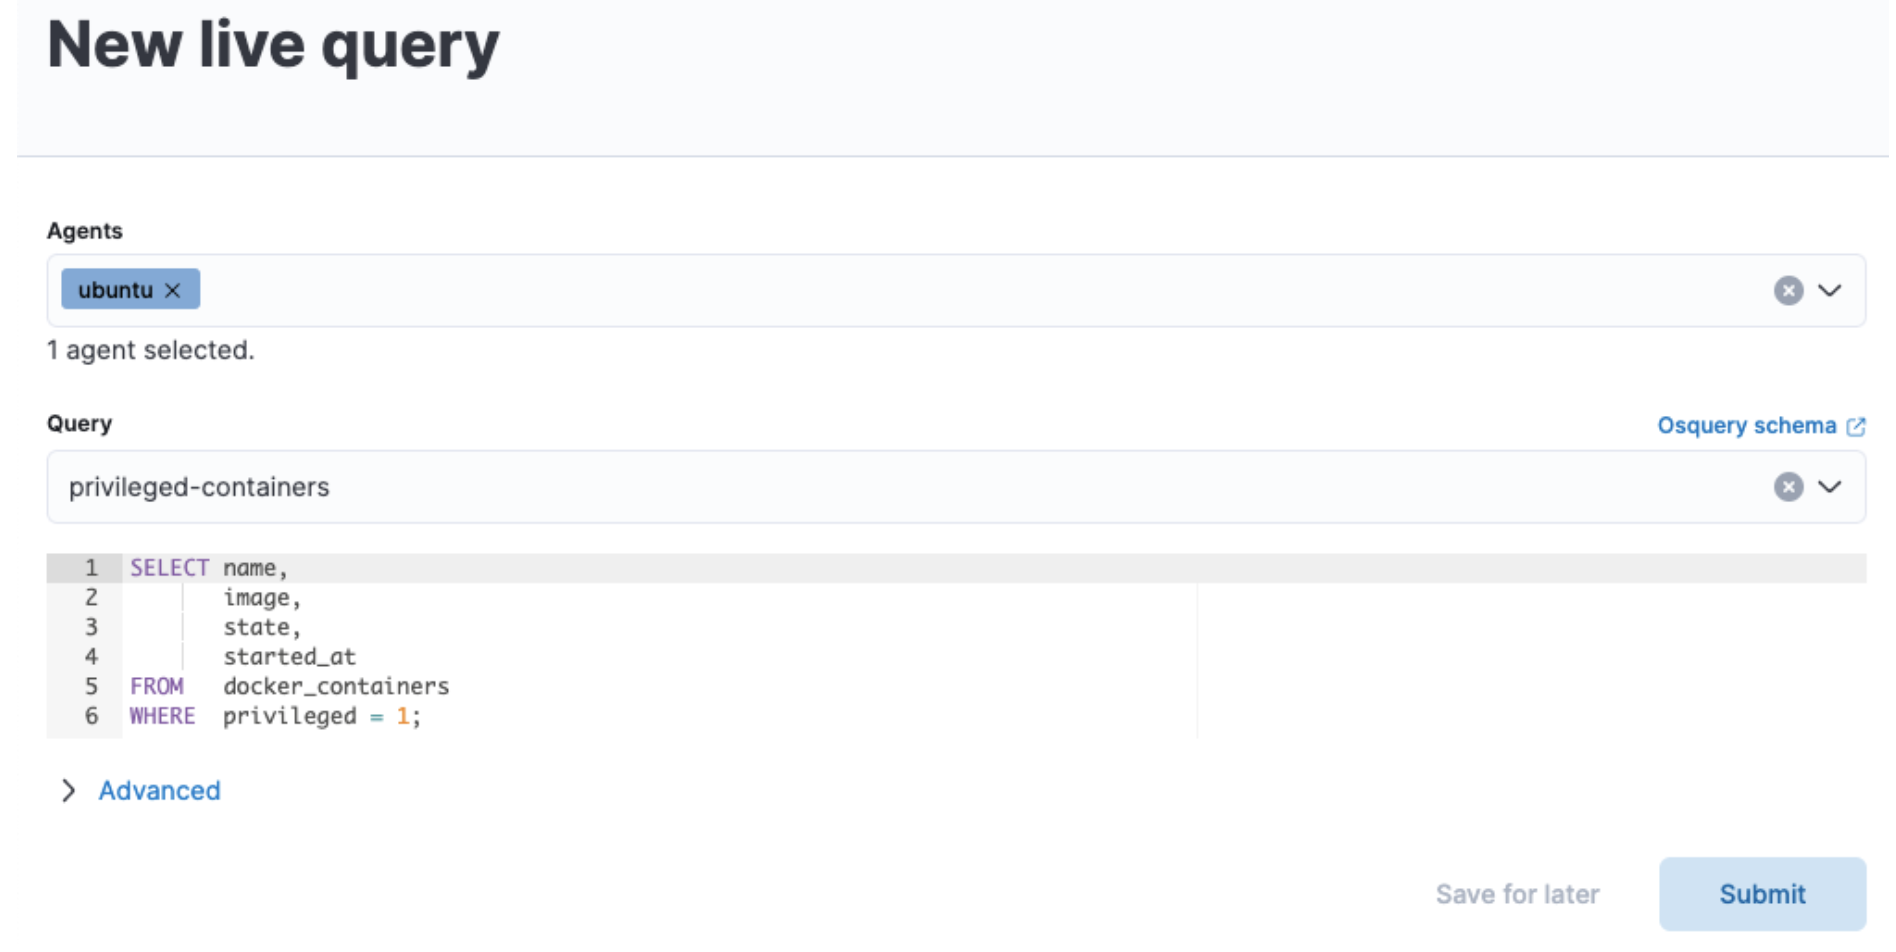
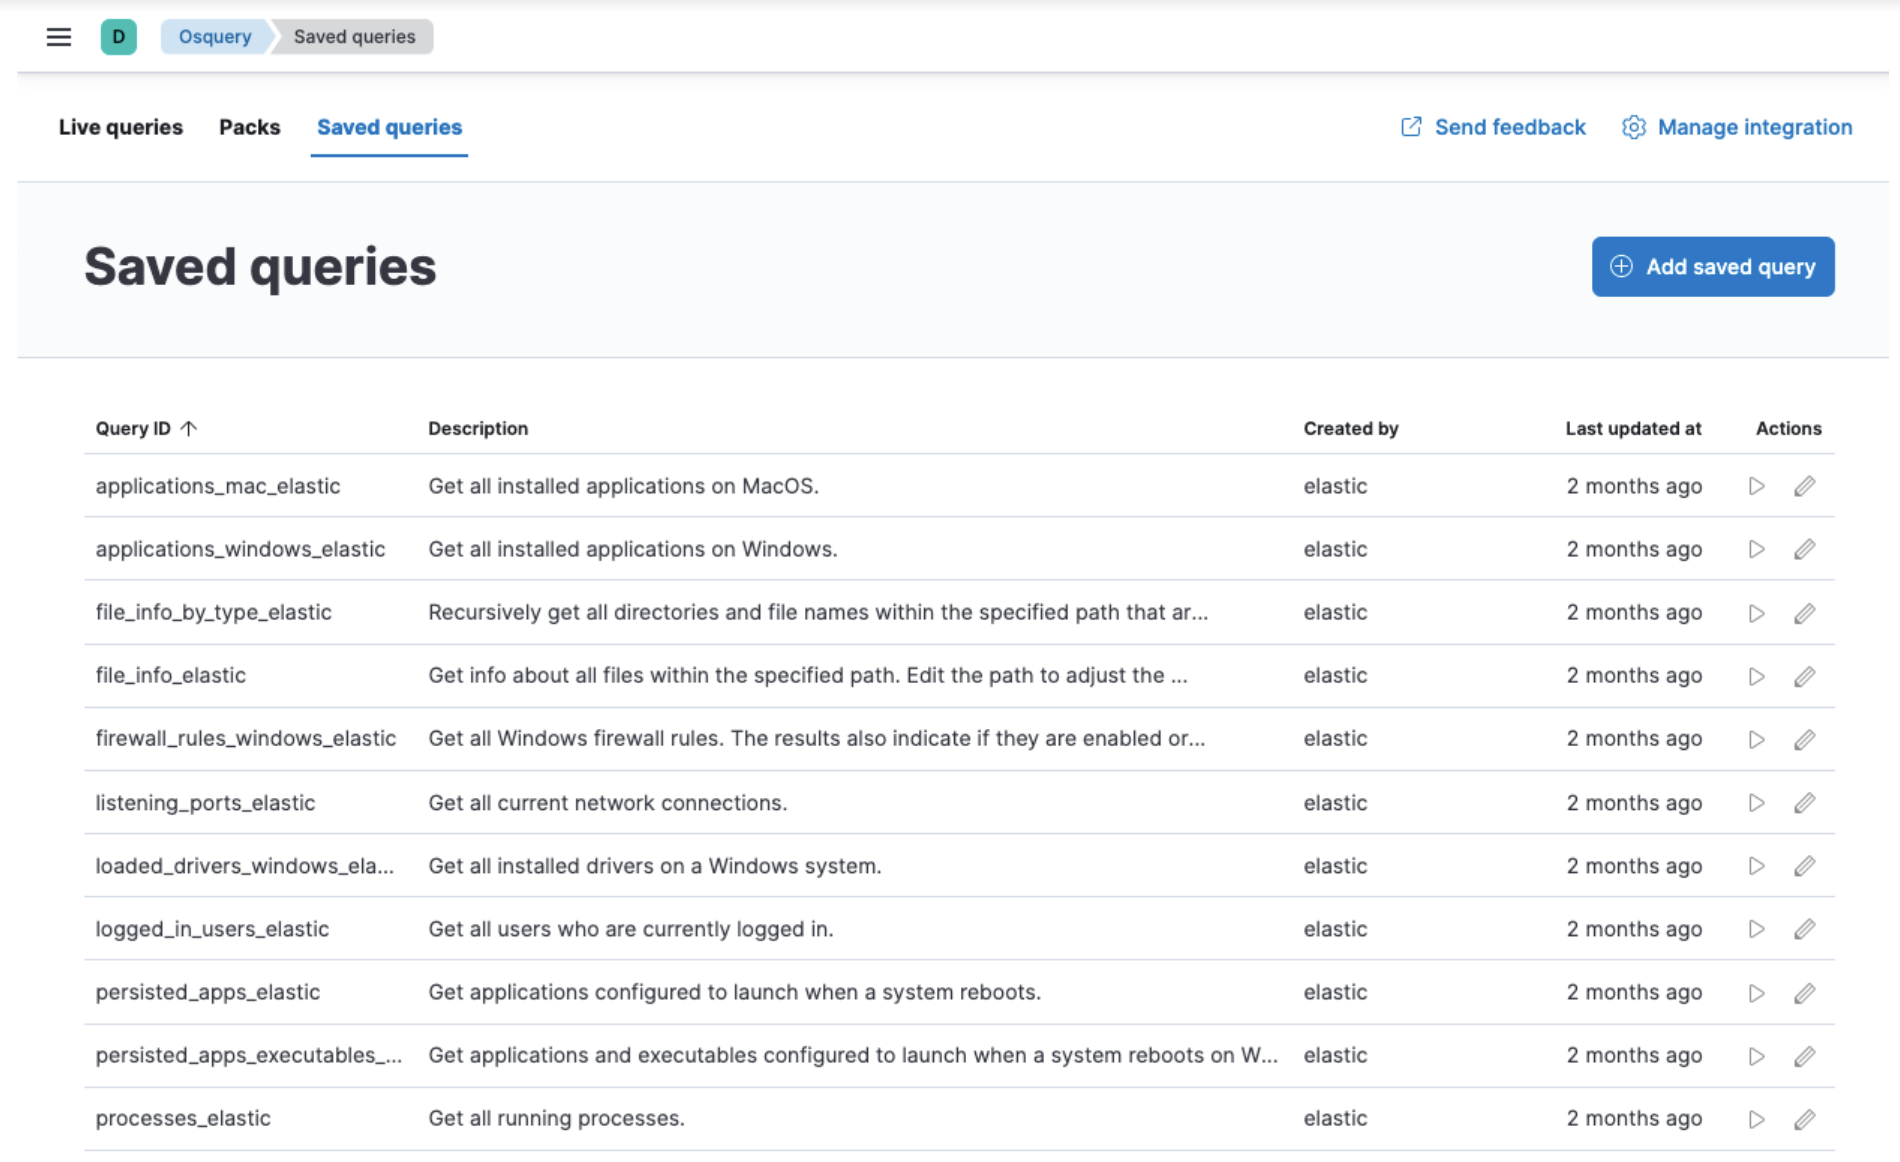
editNew saved queries available
editOsquery now includes a set of 17 saved queries that are available to run as a live query or add to a scheduled pack. These queries can help you get started using Osquery and show examples of the types of queries you can run.
Support for multi-line queries
editLive and scheduled queries now have multi-line query support, which makes queries easier to read, understand, and maintain. This update better supports Osquery syntax, which is a superset of SQLite, so that you can save and run queries using a standard SQL format.