Kibana highlights
editKibana highlights
editThis list summarizes the most important enhancements in Kibana 7.13].
Runtime fields in Discover and Lens
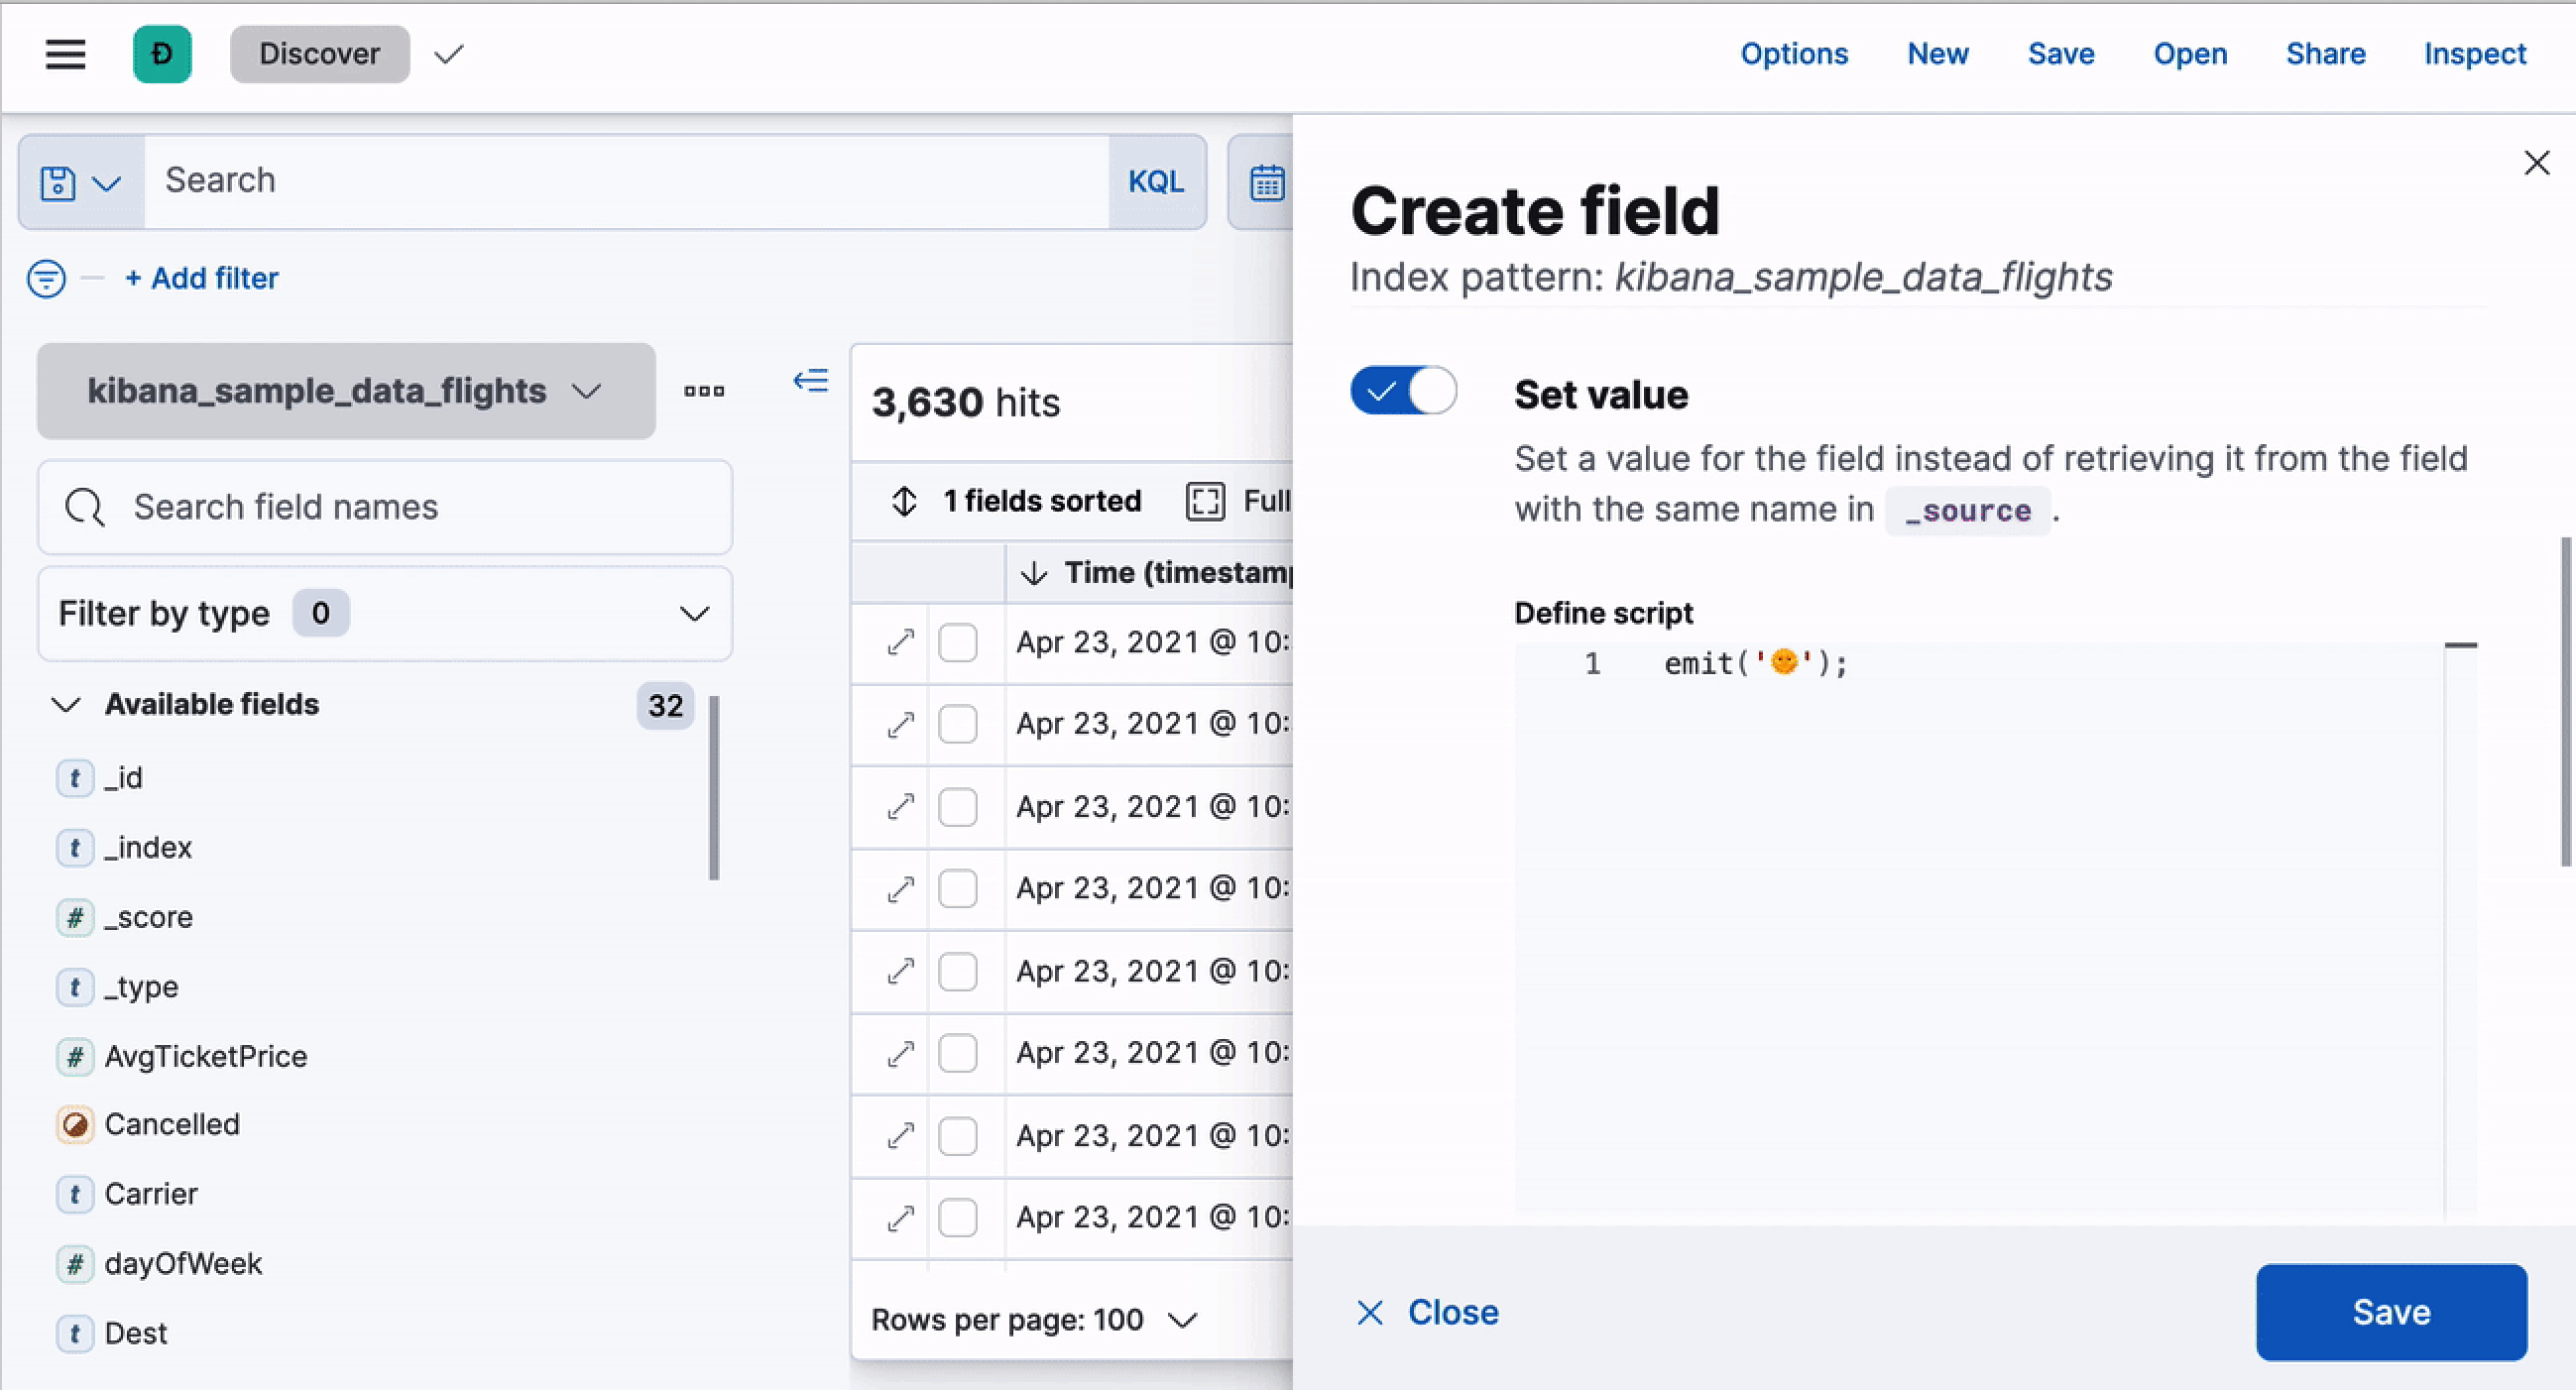
editDiscover, Lens, and Index patterns allow you to create and edit runtime fields right inside of the application. The ability to use runtime fields allows you to create fields on the fly, backed by Painless scripting, giving your fields the punch they need to stand out in analysis and visualizations. For example, you can combine two fields into one or extract portions of fields. The runtime fields you create are part of the index pattern from that point forward, and you can use them anywhere the index pattern is available. Refer to Explore your data with runtime fields for more information.
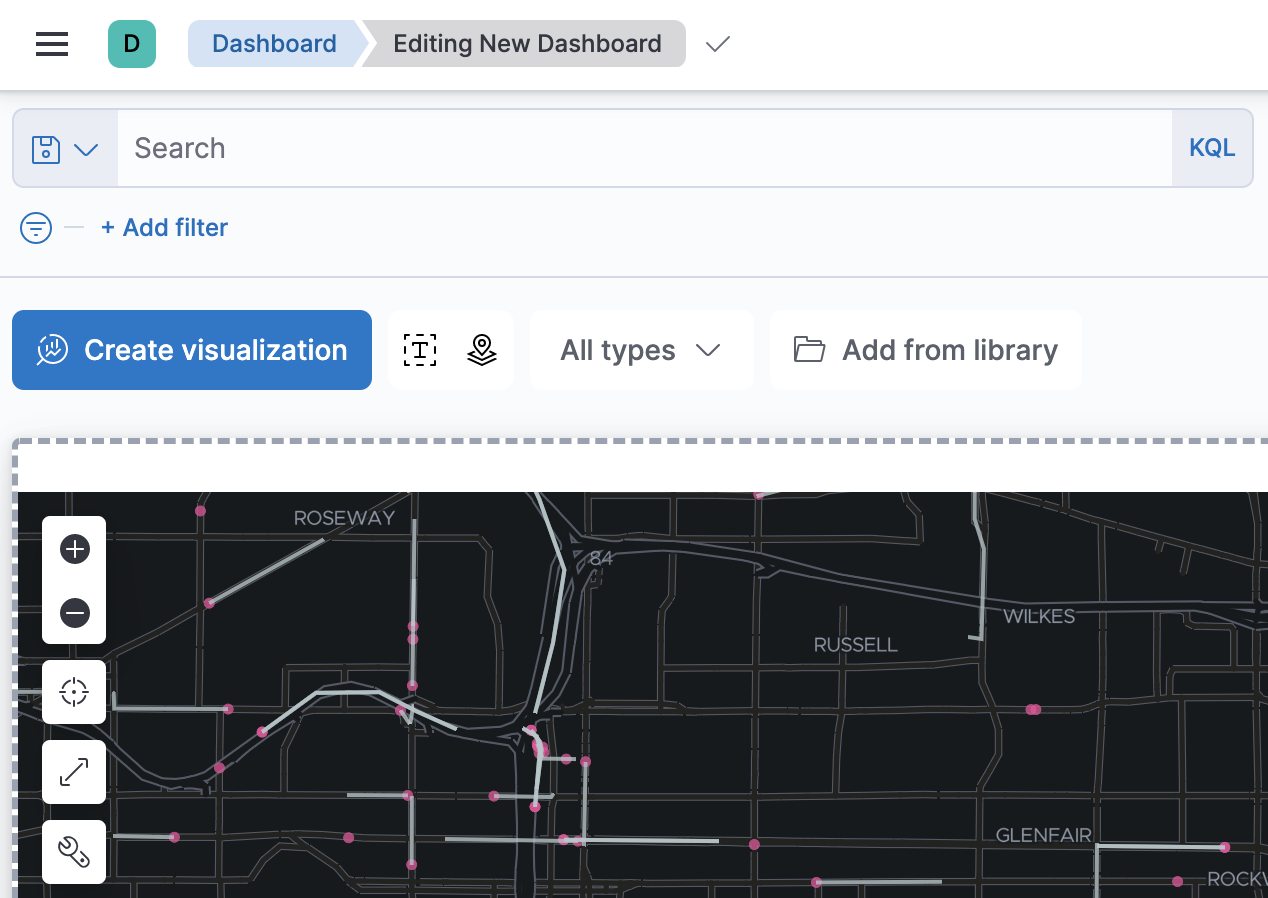
Dashboard—new toolbar and better drilldowns
editBecause Lens is the quickest and easiest way to create visualization panels, Lens now opens by default when you click Create visualization on the dashboard. To make it easy to open the other visualization editors and tools, or add your saved visualizations with a single-click, use the new dashboard toolbar. To learn more, refer to Dashboard.
Also in 7.13, you are no longer required to manually create drilldowns with functionality that you’ve already configured. You can copy drilldowns, then apply them to other panels on a dashboard, making it faster to create an interactive experience between multiple dashboards. To learn more, refer to Create custom dashboard actions.
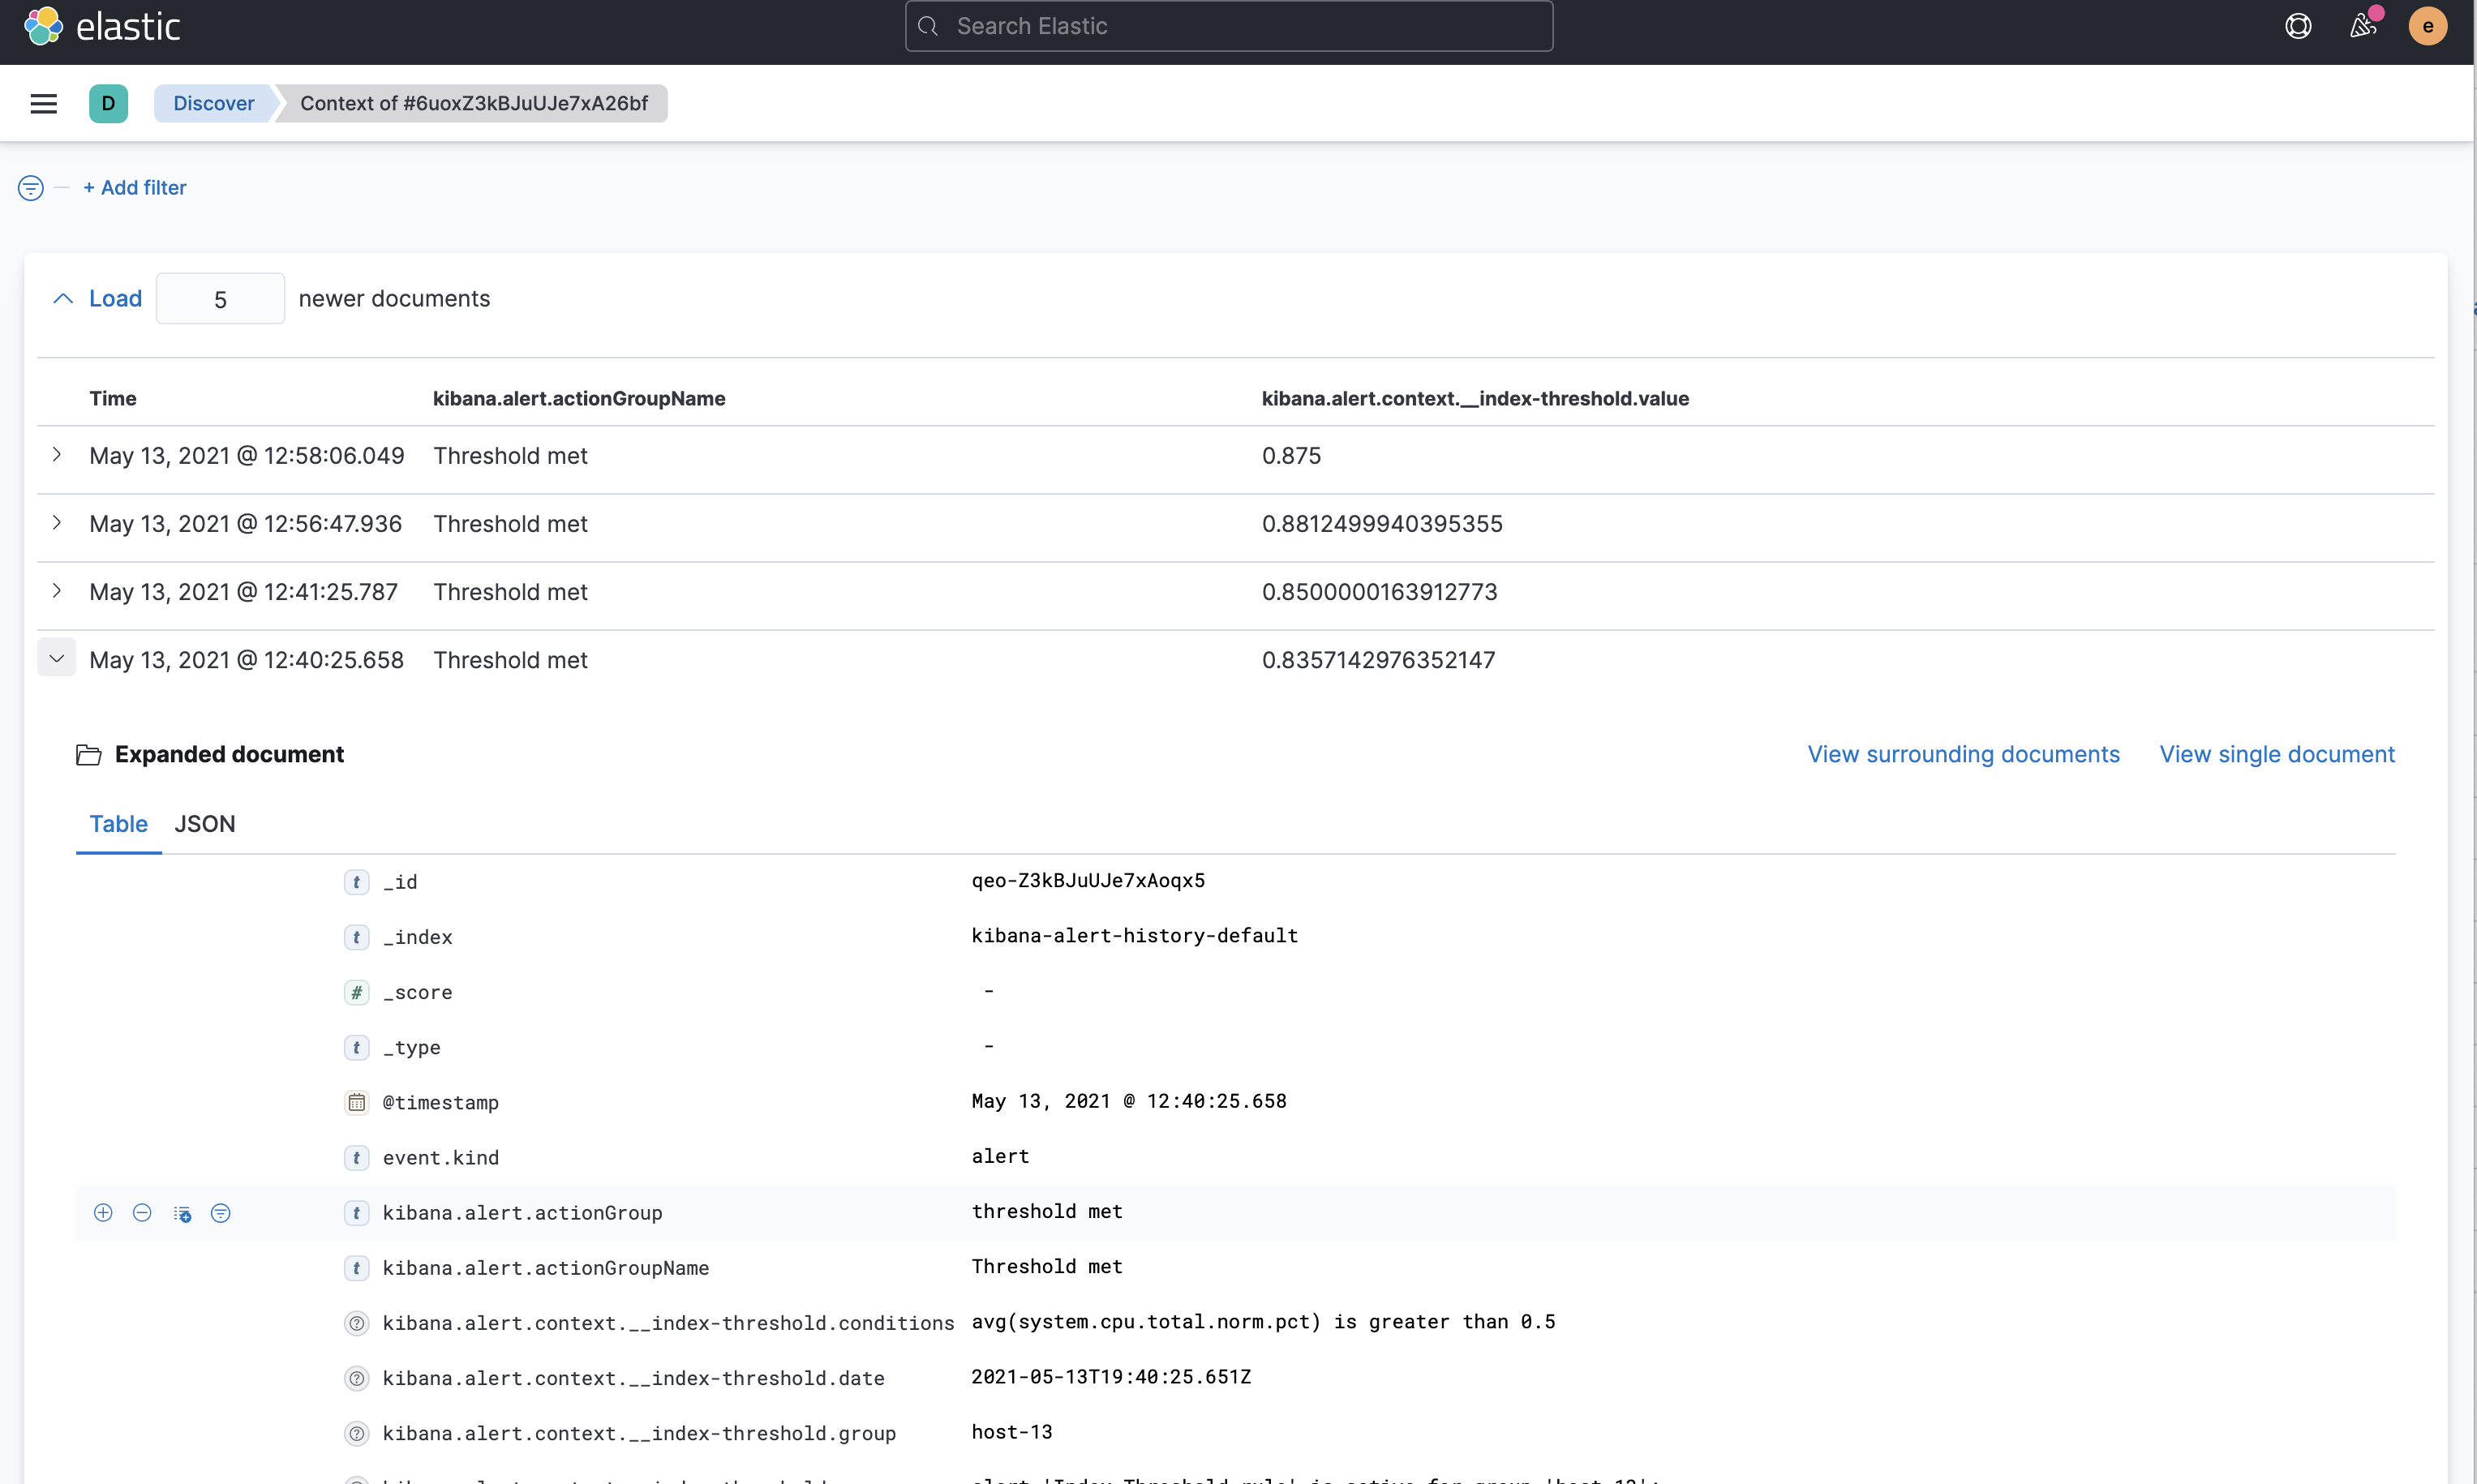
Alerting—Index connector and new terminology
editThis release introduces a preconfigured Index connector, which allows you to index your alert history
into Elasticsearch. To do this, set the new xpack.actions.preconfiguredAlertHistoryEsIndex
action setting to true. You can capture the alert and its context,
index it, and use the index and Kibana’s visualization capabilities to power custom alert history views,
built for your use case. For more information, watch
this webinar.
You’ll find new terminology for Alerting in the UI and the API:
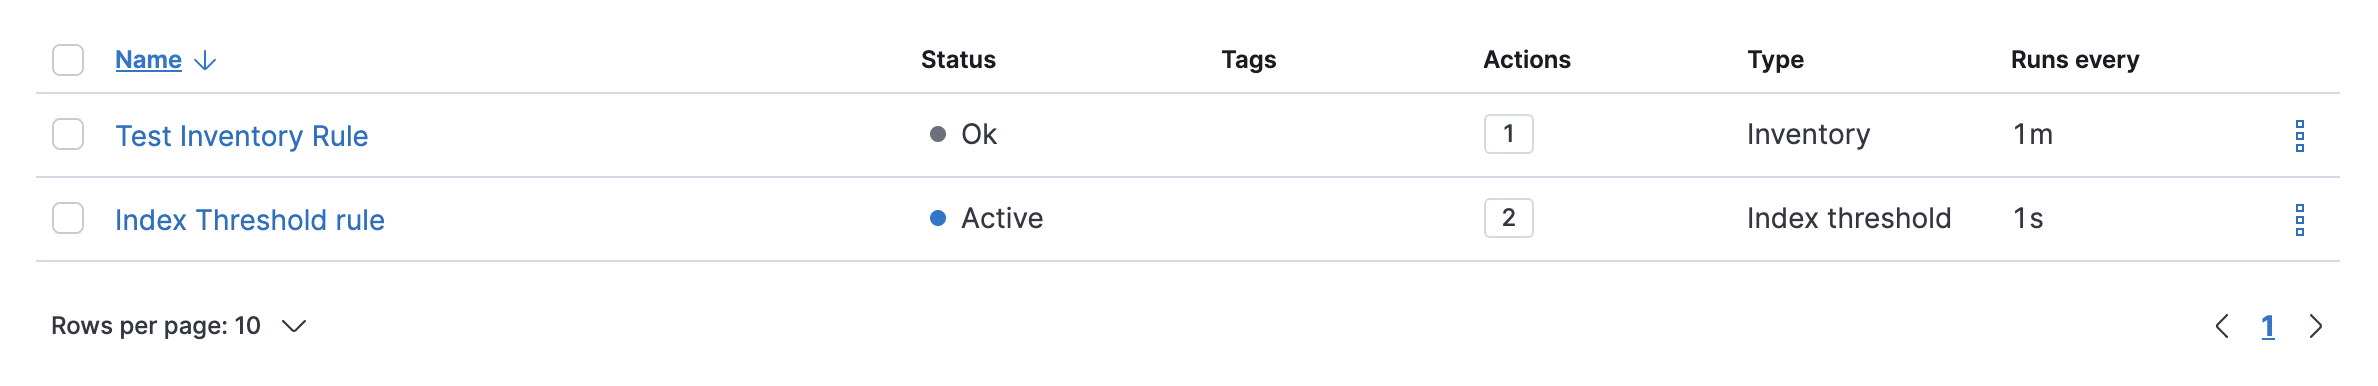
- The main Alerting management page was renamed Rules and Connectors.
- Instances changed to Alerts in the Rules details page.
-
The feature privilege in Stack Management > Roles changed to Stack Rules.
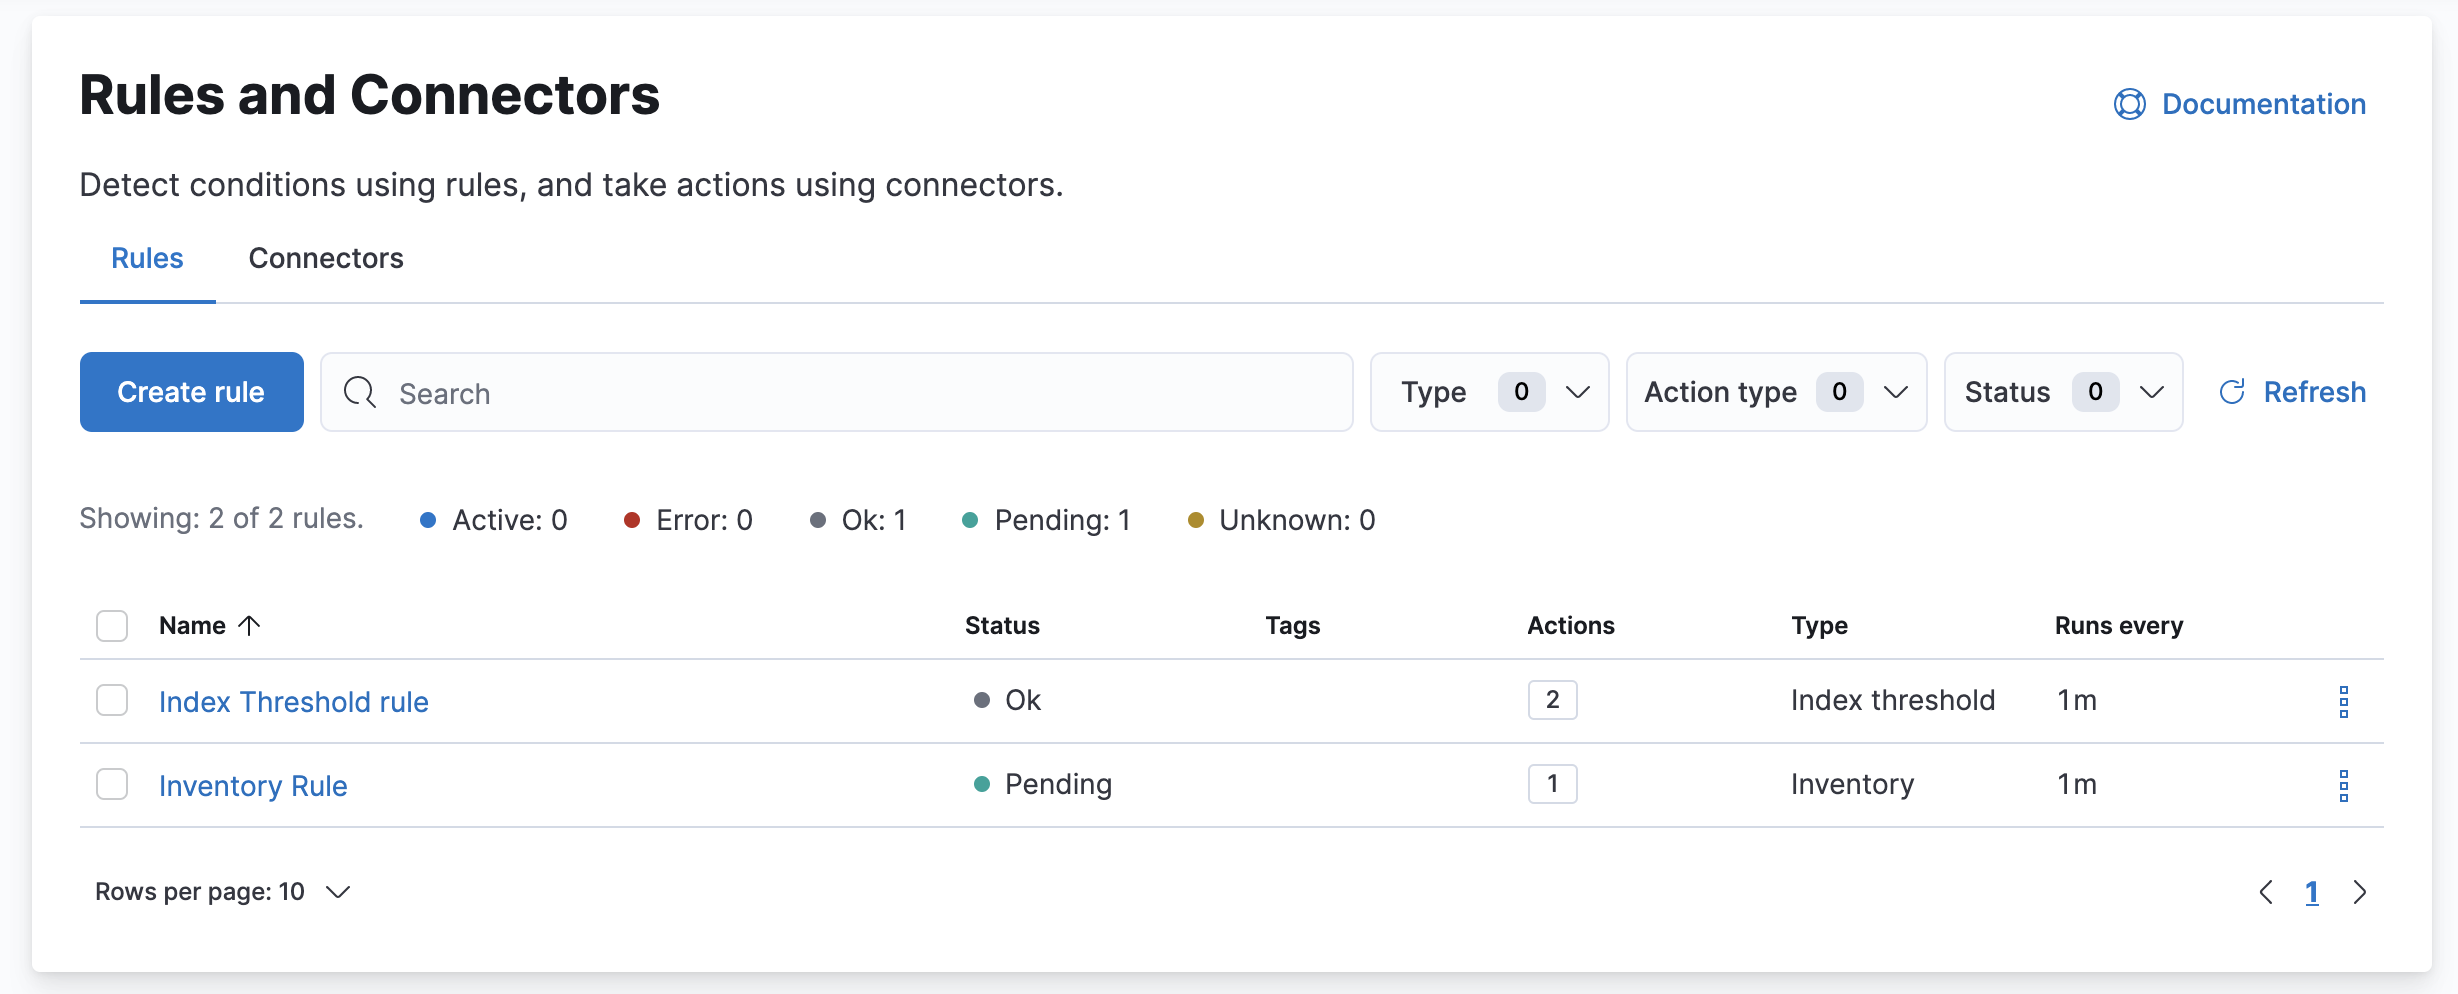
Rules and Connectors was tweaked for usability—you can sort rules by name or status.
Lens—table improvements, metric filters, & more
editData tables in Lens now allow you to pivot row data into columns. When your data tables are dense with information, you can display them horizontally instead. To help with spacing, you can also align the values in each column.
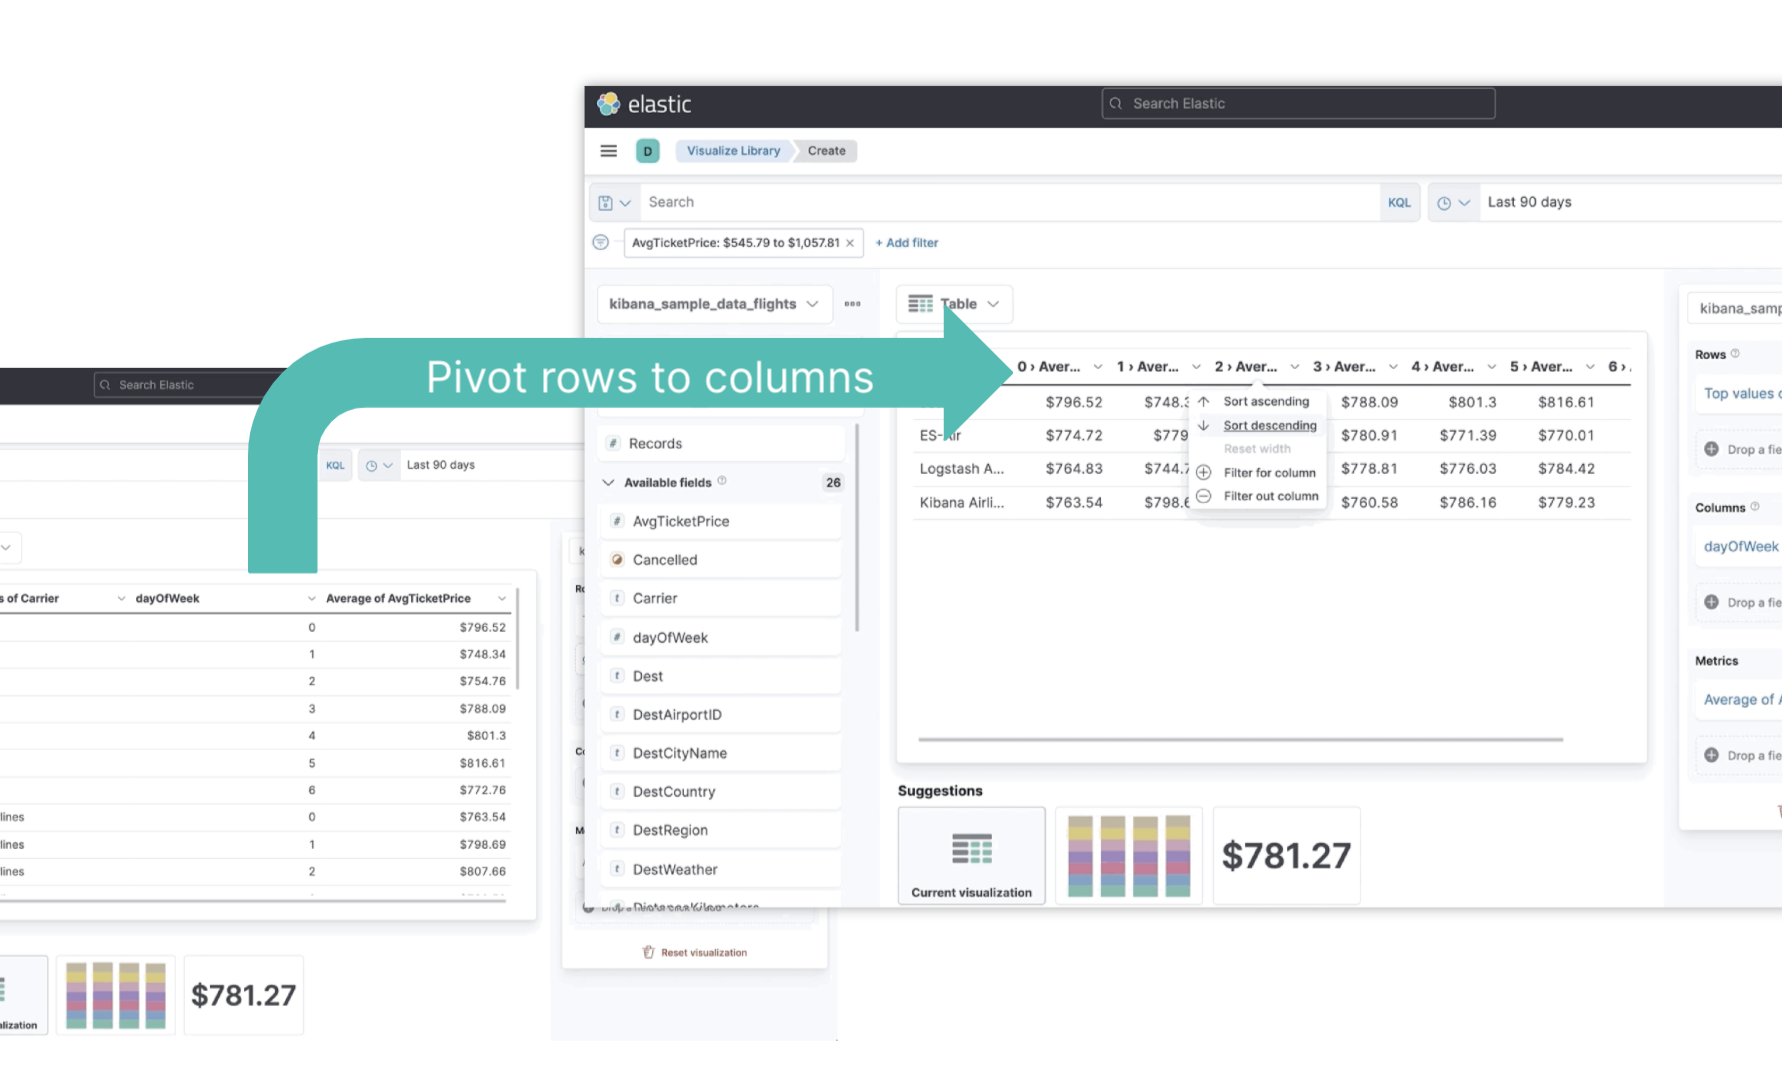
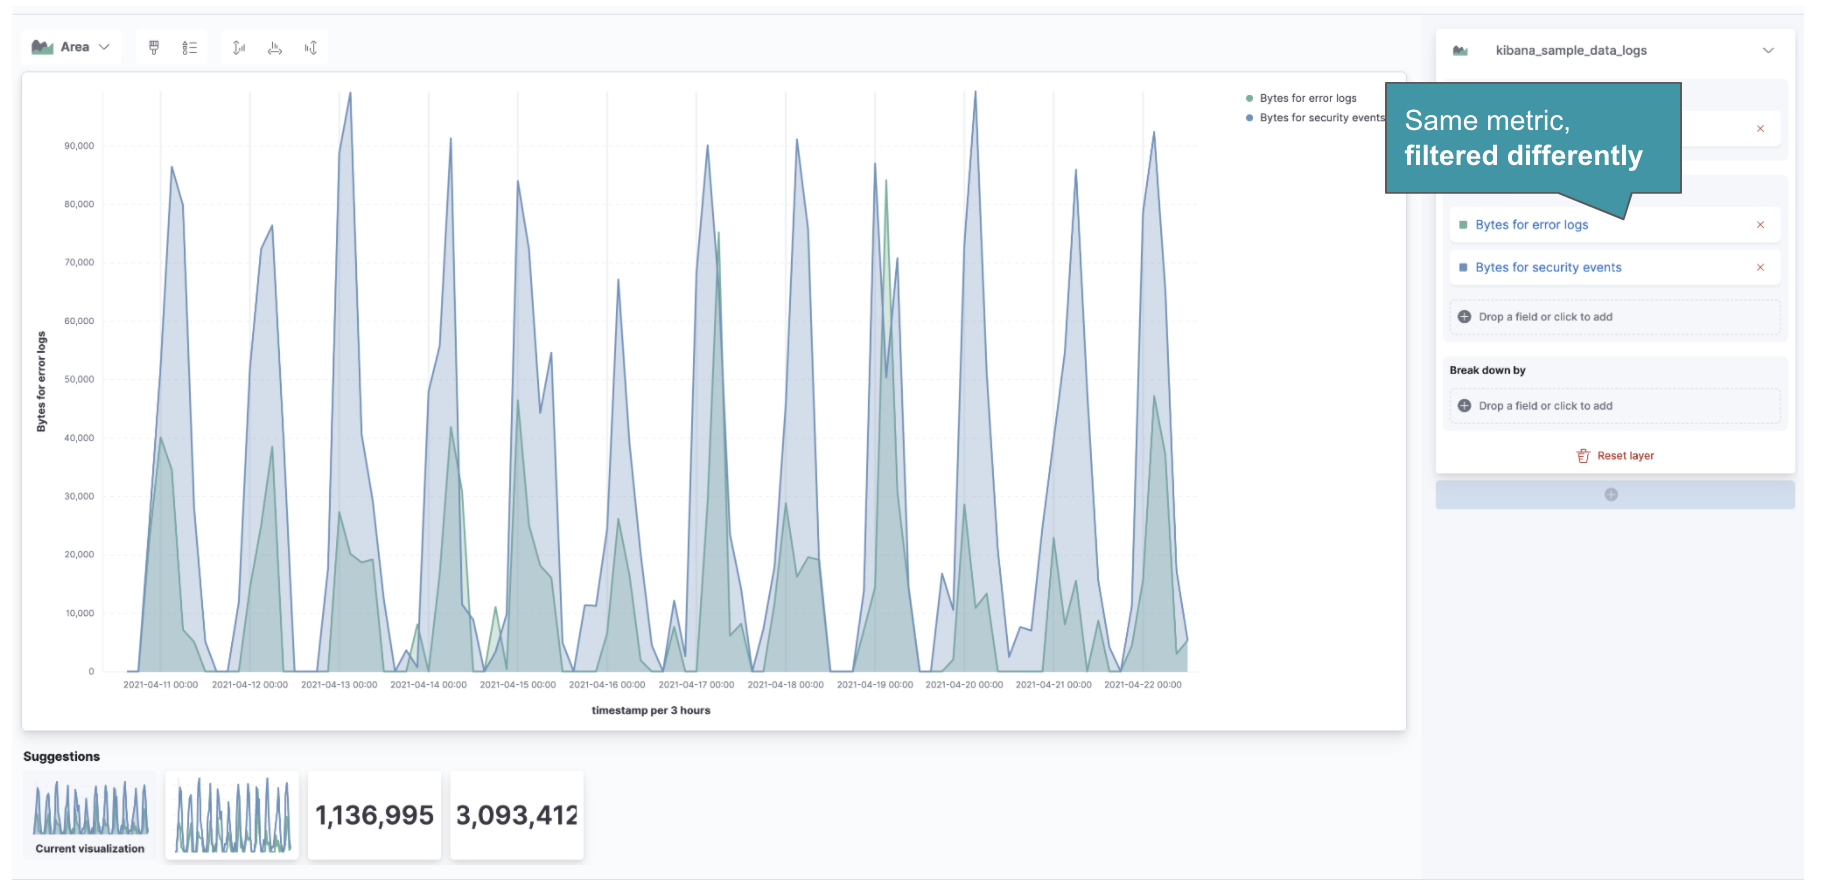
You can now apply filters to each field metric, adding even more capabilities to compare your data.
The 7.13 release also includes a few smaller tweaks:
- The visualization menu is organized into sections to help you navigate all the ways you can visualize your data.
- Making cosmetic changes to your visualization? Lens quickly renders the changes without refreshing the data.
- Dragging and dropping a field on top of another field? In addition to the default replace option, you can also choose to swap and duplicate.
To learn more, refer to Lens.
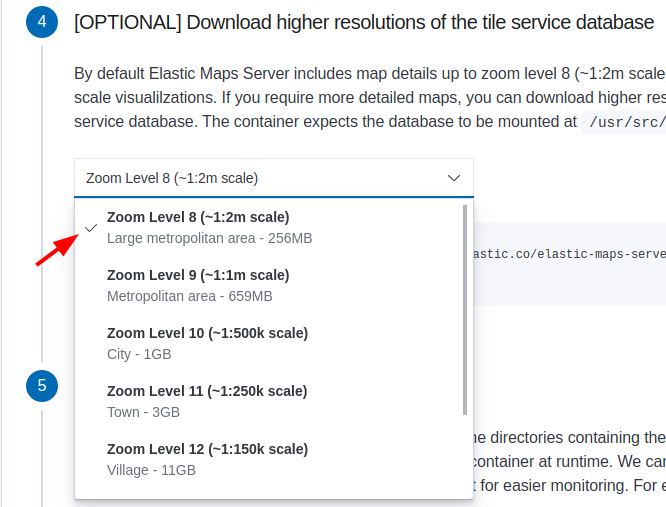
Elastic Maps Server generally available
editWith the GA release, the default deployment of Elastic Maps Server now includes a more detailed set of vector tiles (up to zoom-level 8). No need to download the entire planetary dataset unless you need street-level detail on your maps.
Maps—improved layers, tooltips, & more
editMaps adds many enhancements for working with your geospatial data. You can now toggle the visibility of a layer from a quick action when hovering over a layer.
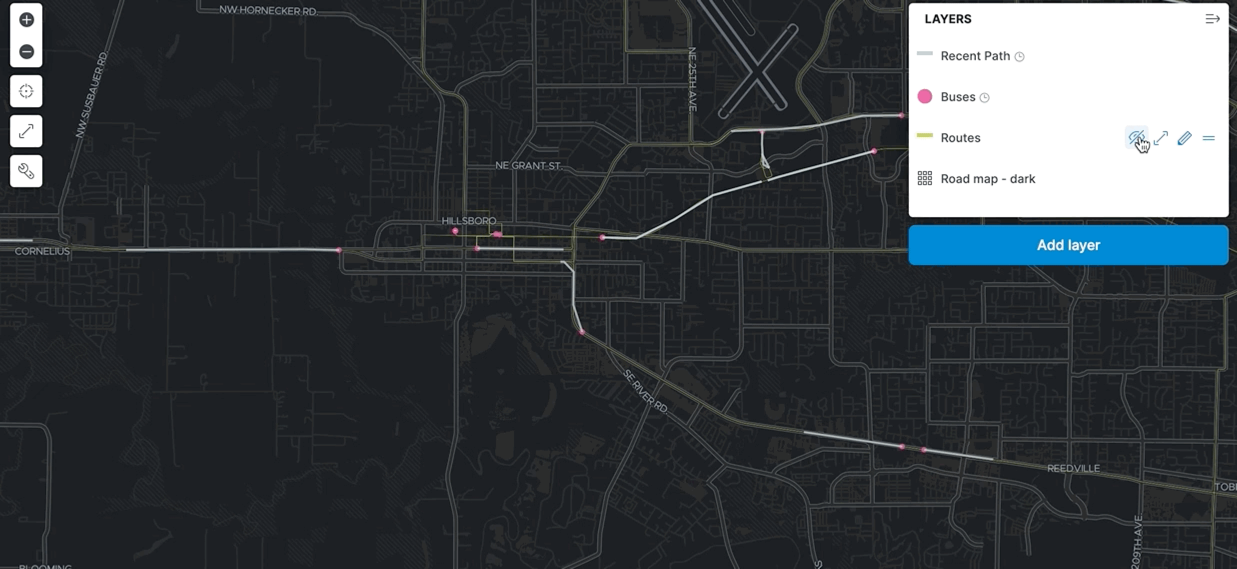
In addition:
- Tooltips include the layer name.
- Interactive spatial filters work with geo_points (and already worked with geo_shapes).
- The file size limit for GeoJSON uploads is now 1GB.
- The scaling option for “Top hits” is in its own layer card, making it easier for anyone to create a layer showing the most relevant or recent documents.
To learn more, refer to Maps.
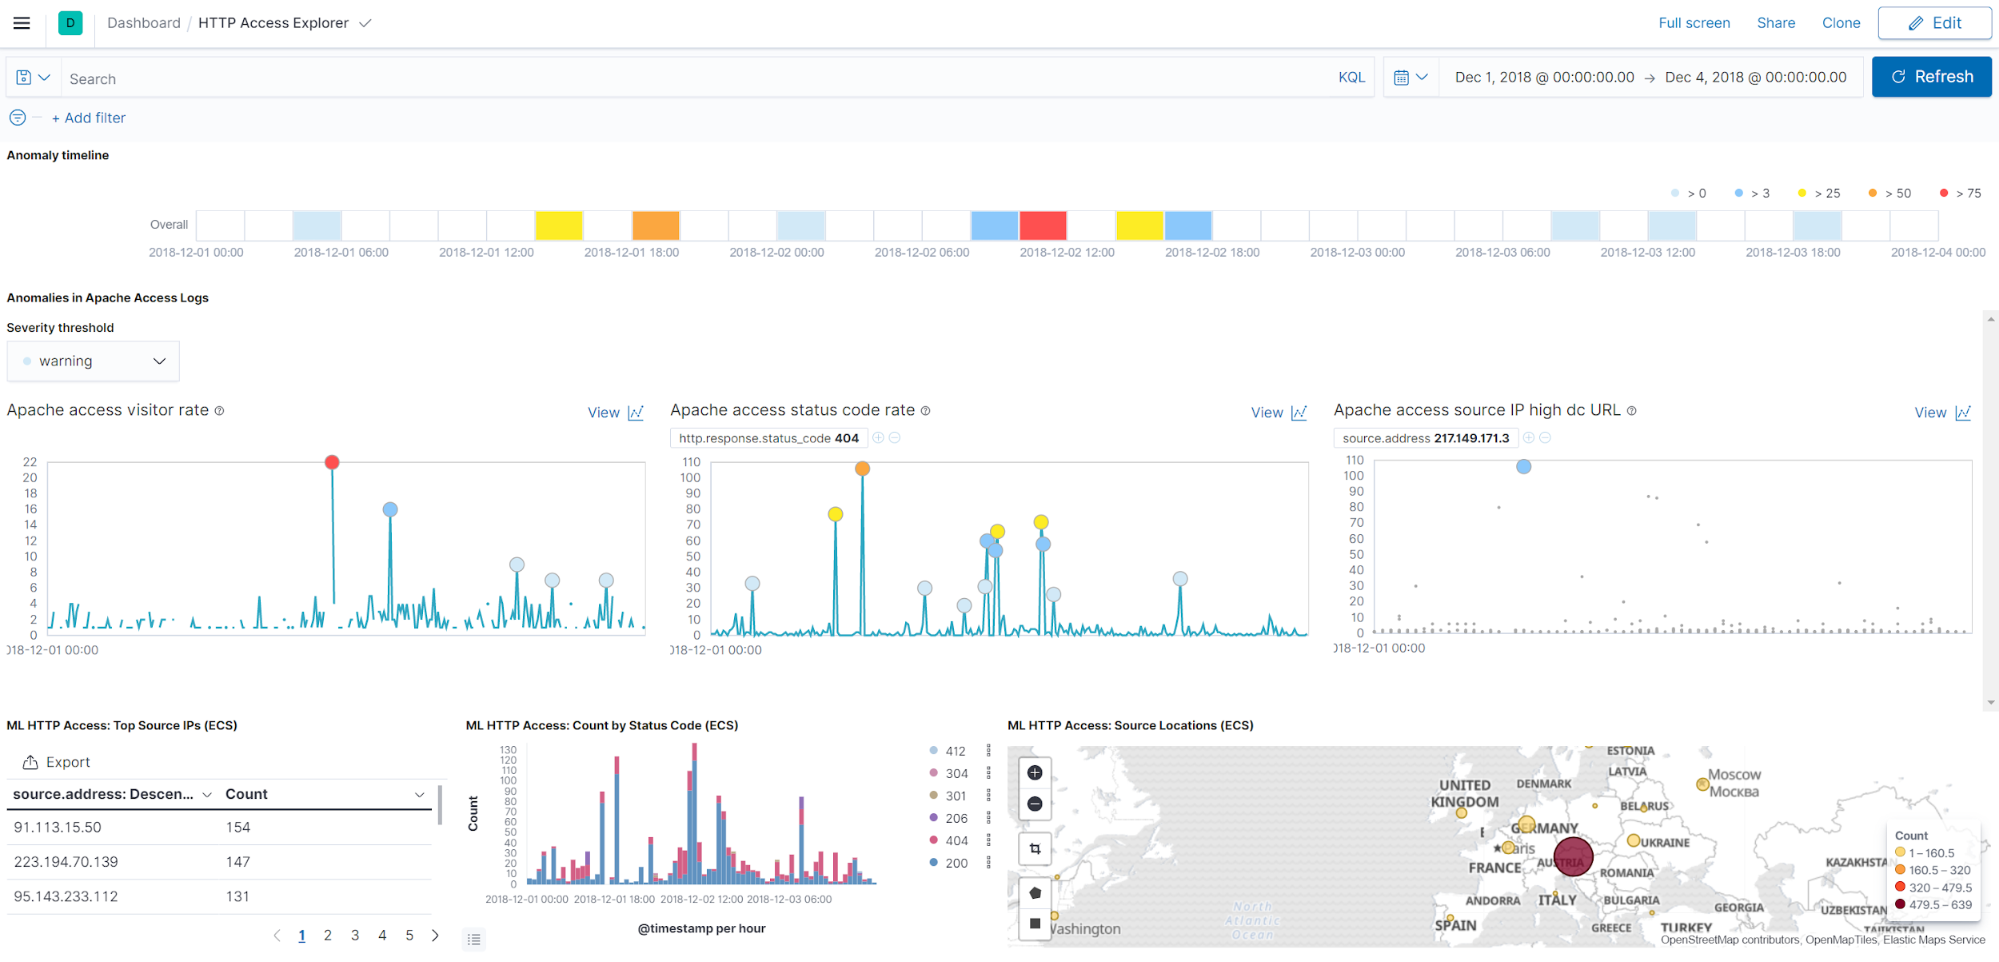
Machine Learning—embeddable charts and job validation
editFollowing on from embeddable swim lanes, Machine Learning now allows you to embed anomaly charts in dashboards. You can add the charts to a dashboard directly from the Anomaly Explorer, selecting the jobs of interest and the number of charts to show in the panel. This allows you to view anomalies alongside the source data in your dashboards. The following example displays anomalies from the Machine Learning Apache access logs module, which uses both the swim lane and anomaly chart embeddables.
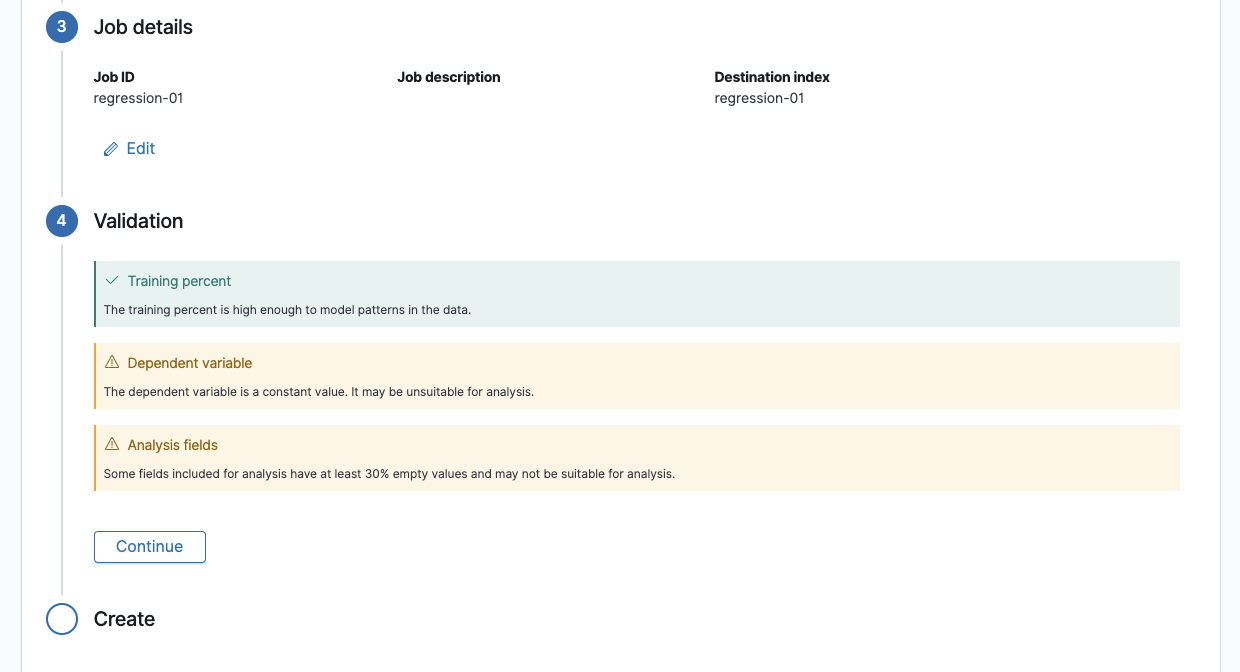
Creating a data frame analytics job has flexible configuration options, which can impact the time and resources needed to run the job and the quality of predictions that the trained model makes on new data. To help you create a job, the wizard now has a validation step that checks properties, such as the dependent variable, training percent, and fields included for analysis. Warnings appear if the selected configuration is likely to lead to the job taking a large amount of time or resources to complete.
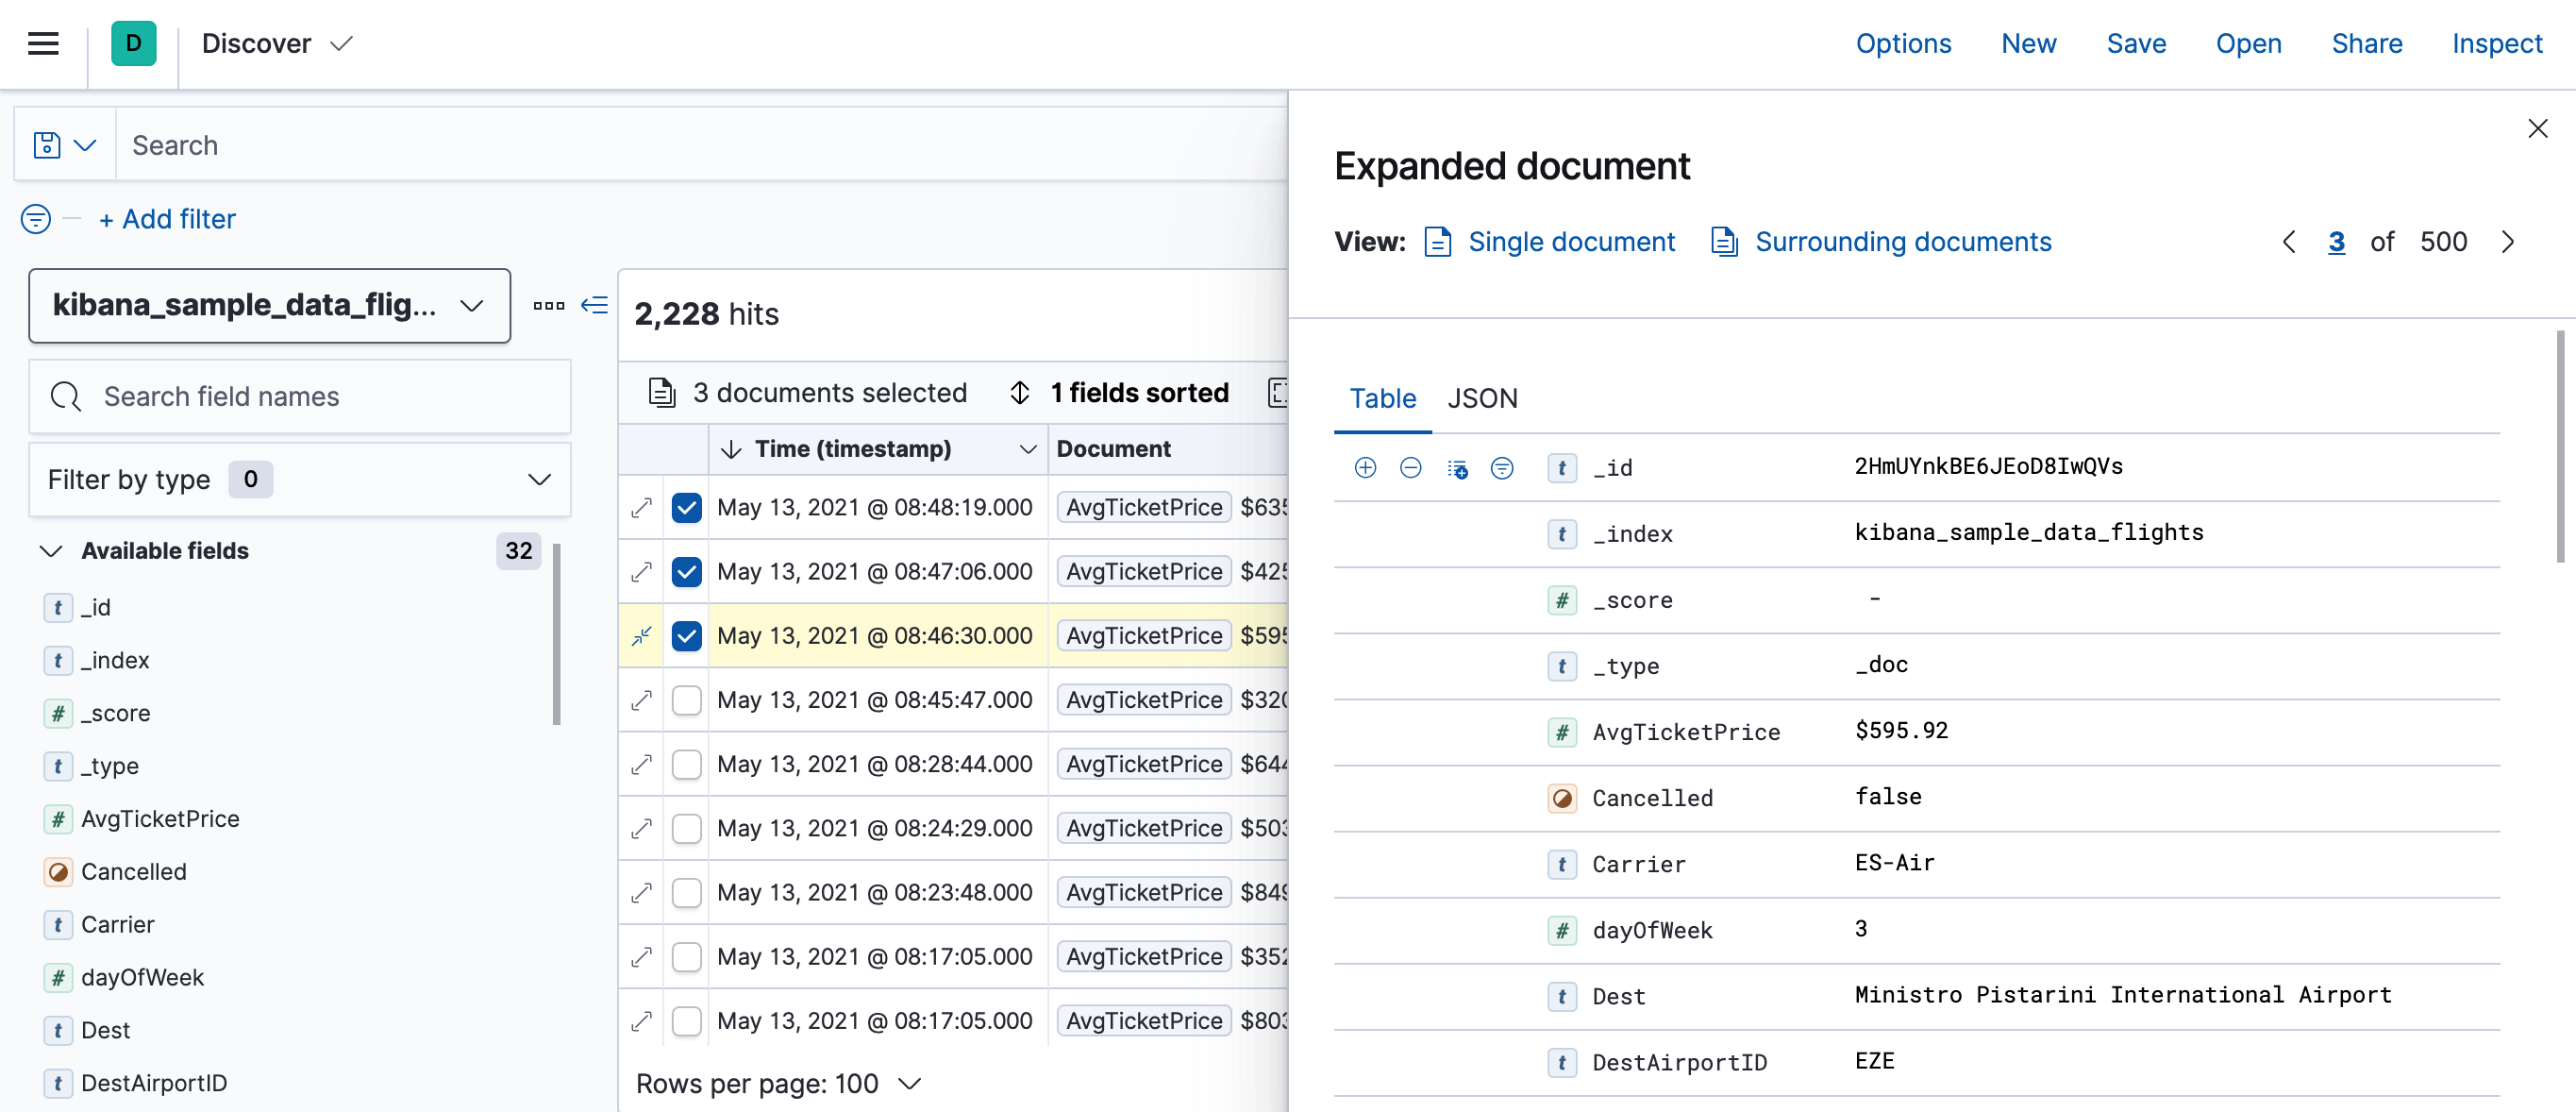
Discover—preview of new document table
editDiscover has a new table layout, now in technology preview. To enable this feature, go to the Discover section of Advanced Settings. Benefits of the new document table include:
- Changeable column widths
- Sortable columns with drag and drop
- Full screen mode
- Improved sorting
- Document selection and export to clipboard
- Expanded documents view in a flyout, with navigation to previous and next documents