Observability highlights
editObservability highlights
editThis list summarizes the most important enhancements in Observability 7.12.
APM PHP agent (GA)
editIn 7.12, we’re excited to announce that the Elastic APM PHP agent is now generally available! Thanks to all of you that provided us with valuable feedback on the agent’s preview and beta versions. The PHP agent adds automatic instrumentation for Web frameworks like Laravel, data access technologies like PHP Data Objects (PDO), client-side networking technologies like curl extension and the Guzzle library.
In addition to this out of the box instrumentation, the PHP Agent also provides a comprehensive Public API that allows you to custom instrument your PHP applications. If you haven’t had the chance to check out the new agent, test drive the agent and let us know what you would like to see added to it.
Automatic ECS compliant logs with APM
editDuring the last few releases, we have focused on improving the experience of visualizing your logs along with your trace data. This release makes that experience even more seamless. APM agents now do the heavy lifting of creating the ECS compliant logs for you.
This means all you have to do is deploy an APM agent to ship your logs to Elasticsearch so you can visualize them in Kibana. Check out our documentation for a complete list of logging frameworks supported.
Prometheus client for custom metrics in APM agents (Python only)
editPrometheus is one of the popular cross-language libraries that enables reporting various metrics, including application and runtime performance, and custom business metrics. Metricbeat has been capable of monitoring Prometheus metrics, including those coming from clients using the Prometheus module.
In 7.12, we release a beta version of integrated discovery and monitoring capabilities for Prometheus Python client metrics as part of the Python APM agent. Using the new Python agent, you can monitor Prometheus metrics out of the box. This feature simplifies the onboarding process and enables a tighter correlation between APM, logs, infrastructure, and custom metrics.
Native support for OpenTelemetry (Experimental)
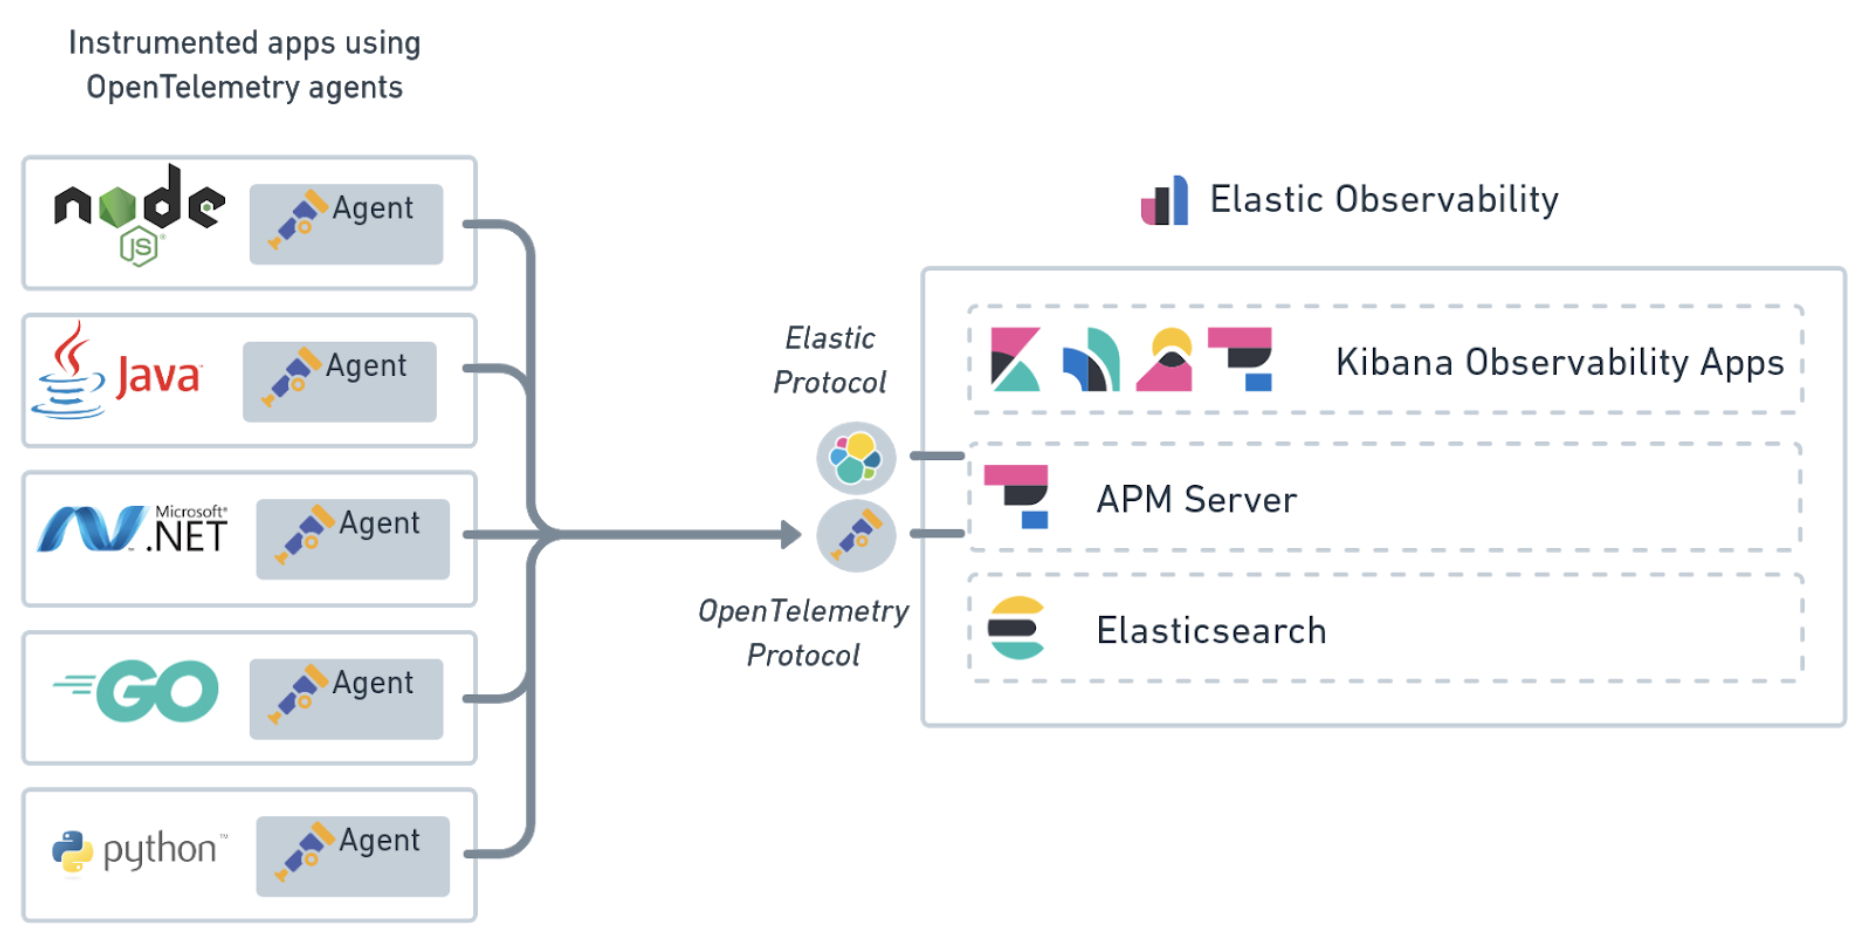
editOpenTelemetry is emerging as the standardized collection layer for observability data and is designed to enable organizations to instrument their apps in an open and vendor-neutral manner. Our support for OpenTelemetry is not new. In July 2020, we released the OpenTelemetry Collector exporter for Elastic that acts as a translation layer between OpenTelemetry agents and APM Server.
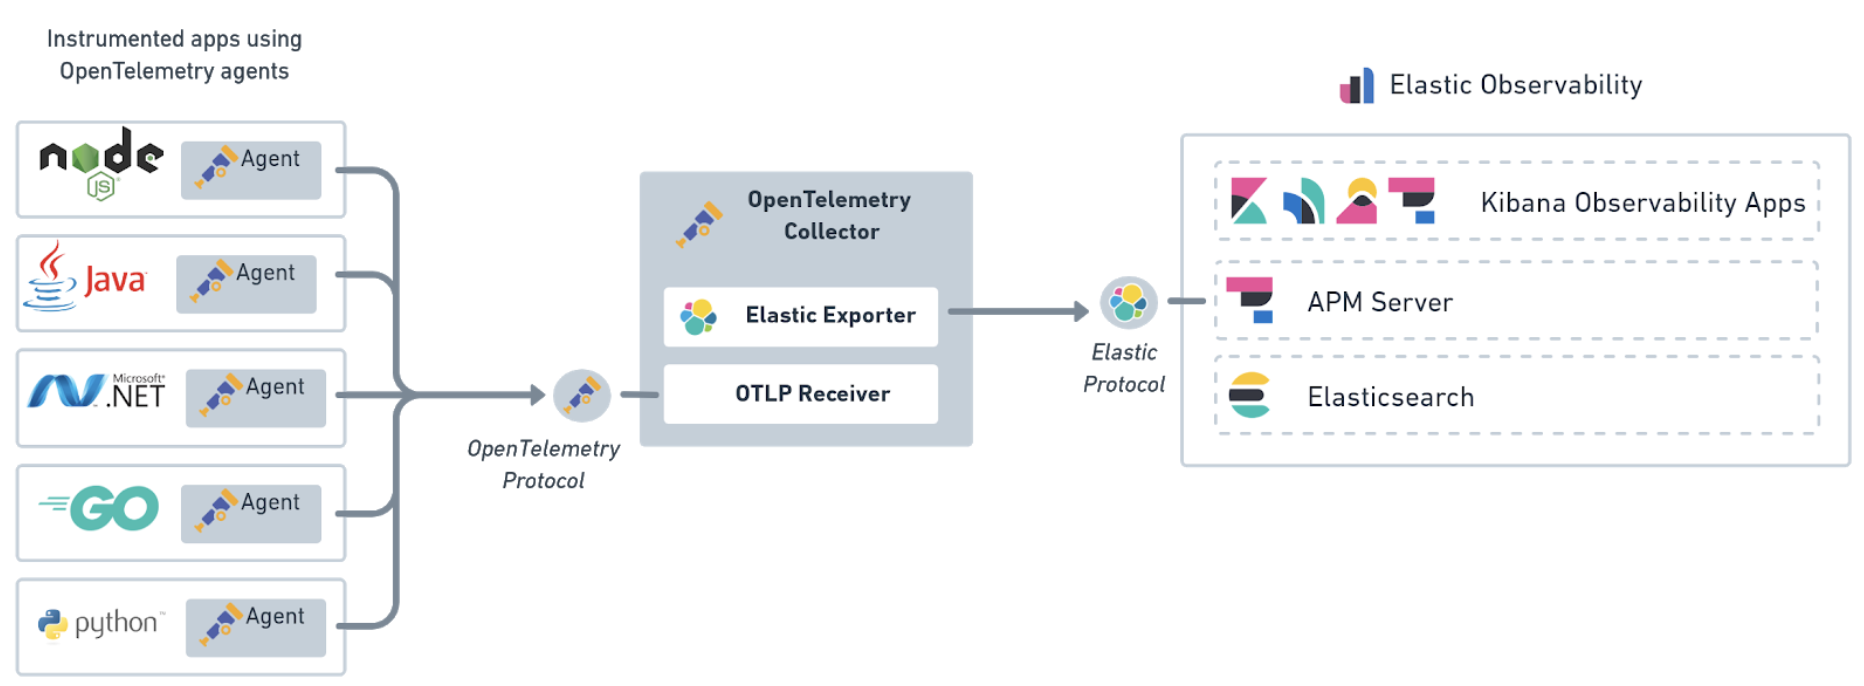
In 7.12, we are pleased to announce the experimental native support of the OpenTelemetry protocol. This experimental integration is currently available for Elastic Observability on self-managed deployments and available on Elastic Cloud and Elastic Cloud Enterprise soon.
This allows you to send collected telemetry data directly from your applications to APM Server. Not only does this lower the effort to adopt OpenTelemetry into your existing Elastic architecture, but it also simplifies the architecture by removing the need to install and manage an extra component.
ARM support for Beats and Elastic Agent (Beta)
editFor 7.12, we have released a beta version of Linux aarch64 (ARM) processor support for Beats and Elastic Agent. The builds for this architecture are now available on the download page for Beats and Elastic Agent. The Docker image is still a work in progress and will be coming soon. To make it easier to get started, we are now offering builds rather than the source code to run on these systems.
This support makes it easier to run and monitor your Elastic Stack on ARM systems, such as AWS Graviton, with up to 40% better price performance. Beats and Elastic Agent can also monitor internet-of-things (IoT) devices built on the ARM architecture.
Correlations in APM
editTroubleshooting a performance problem with APM got a whole lot easier with the addition of Correlations as a feature in 7.12! Discover what attributes of your transaction data impact your service’s performance or causing errors straight out of the box.
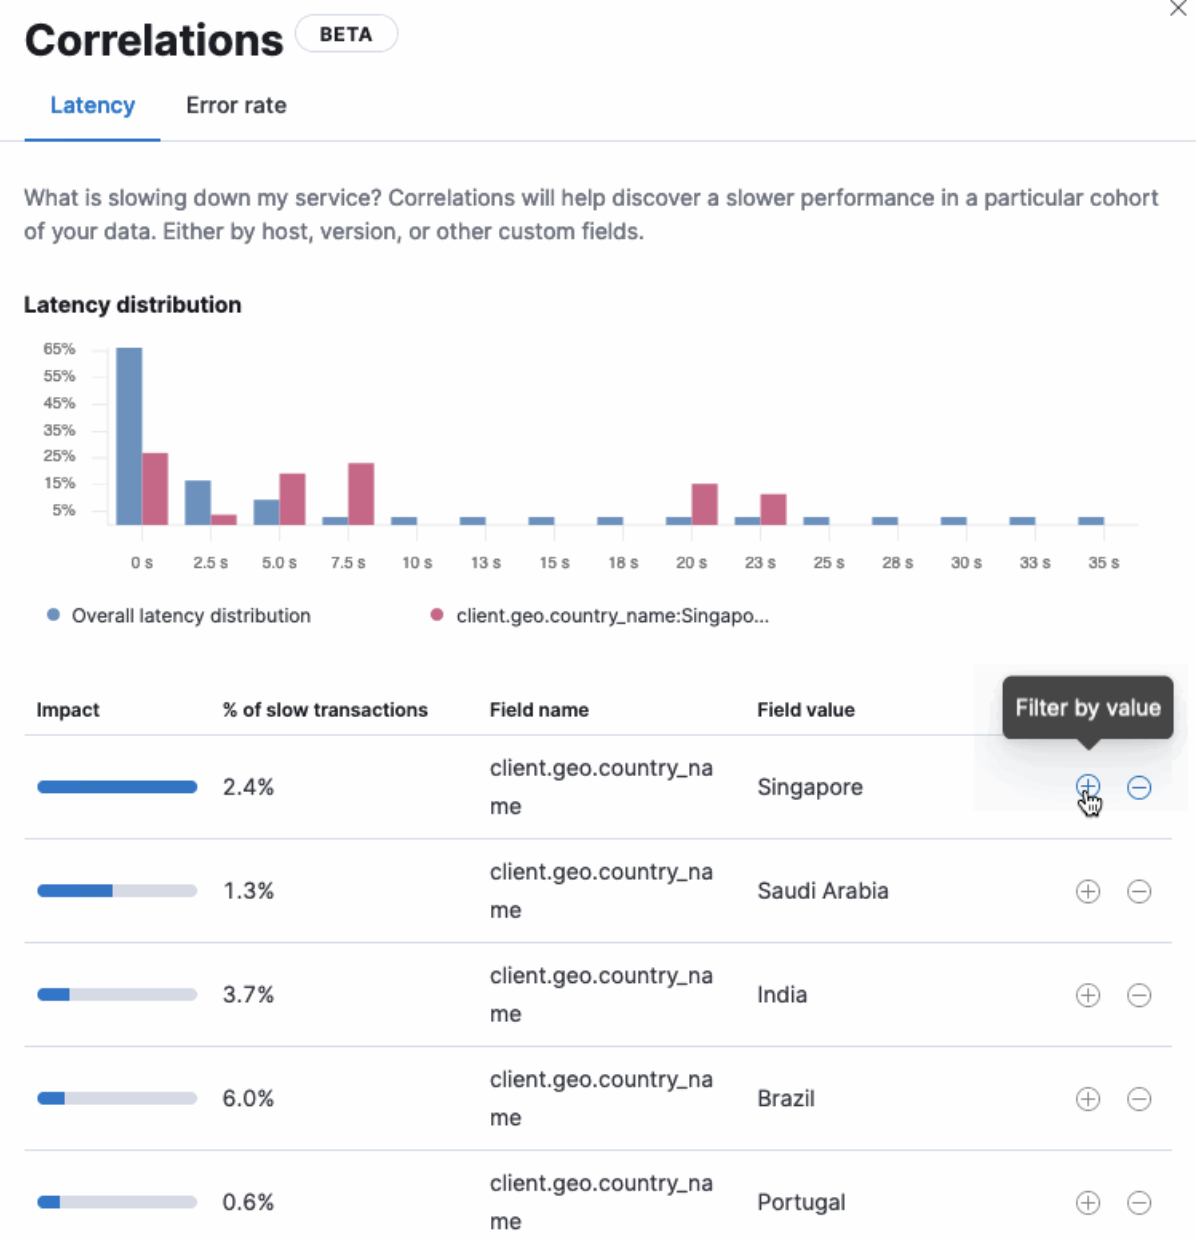
While the table in the correlations view helps surface attributes that have the most significant impact on your service, the distribution chart allows you to visualize how these attributes are distributed compared to what is expected. You can then use these attributes to filter and isolate the root cause of your performance problems.
Correlations give you the flexibility of exploring your data your way, which means you can set a different threshold value for your slow transactions or even specify what attributes you want to run the analysis on, right from the UI. For more information, see our Correlations docs.
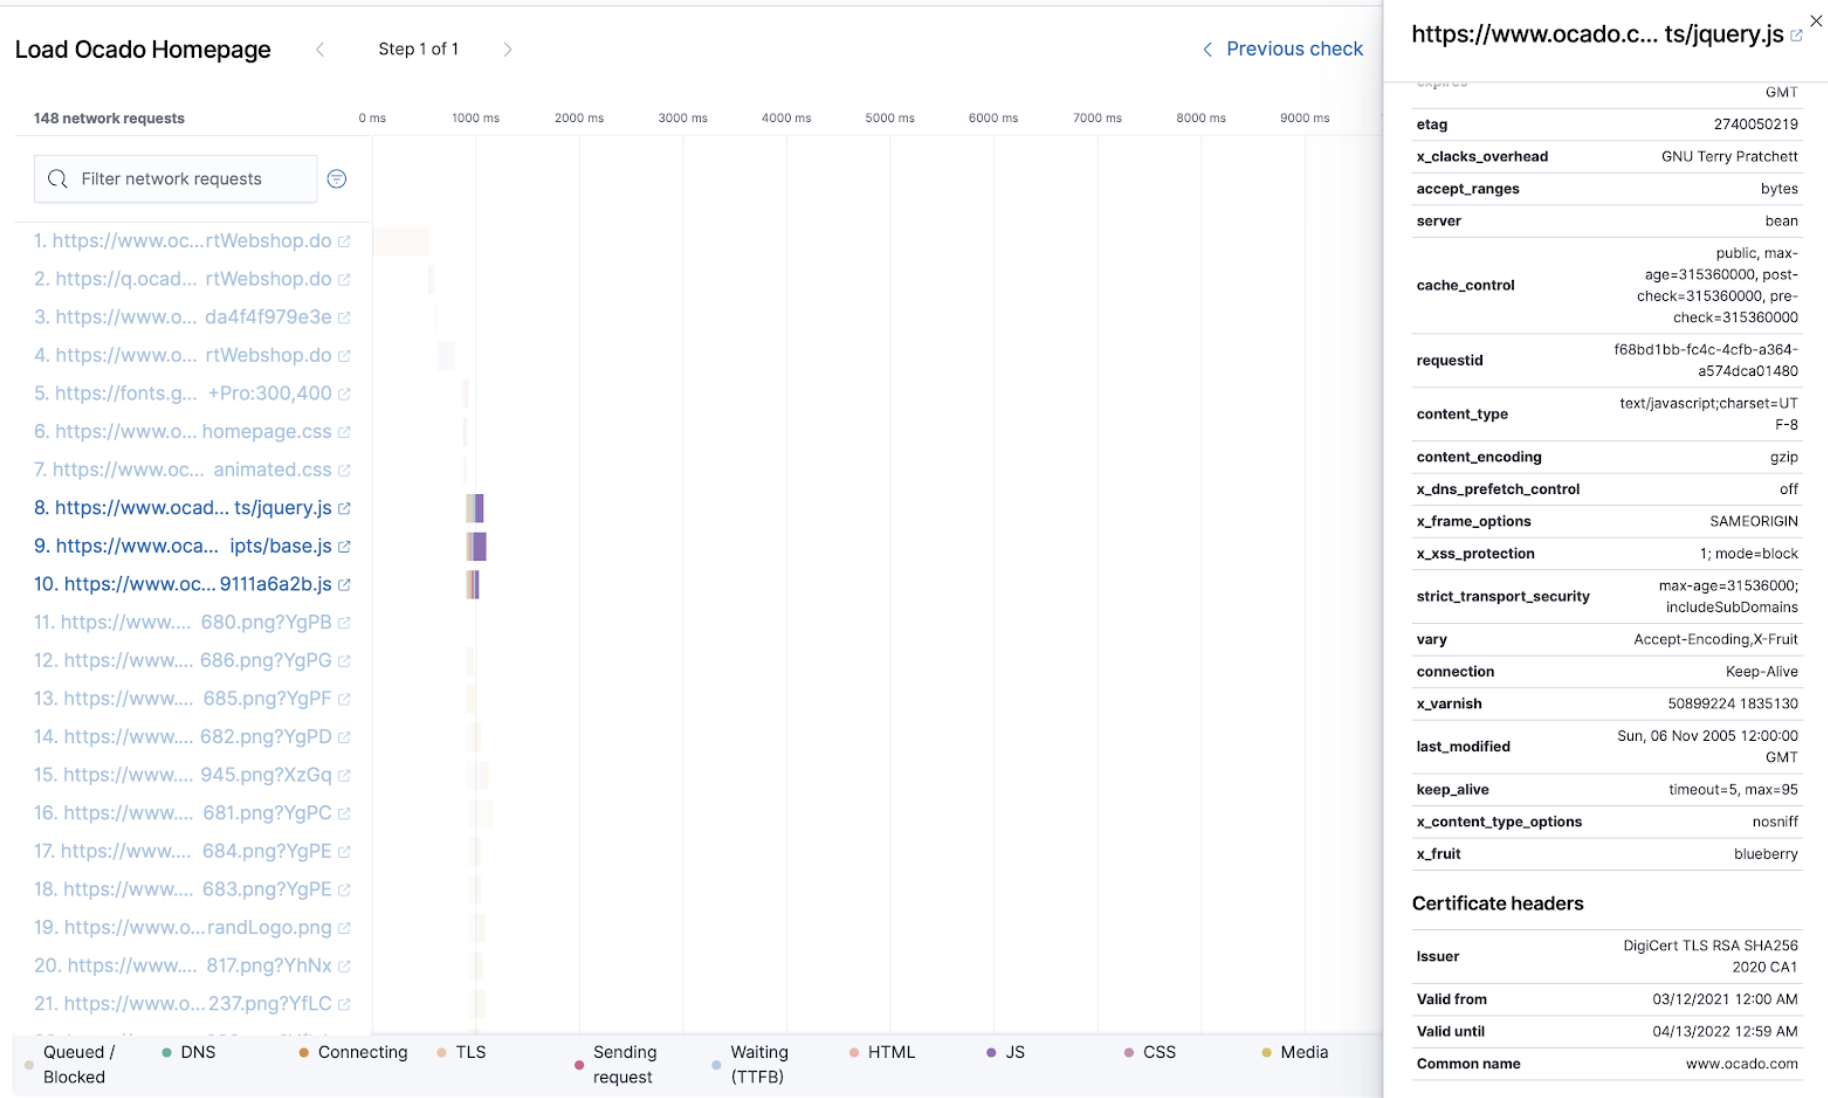
Improved waterfall experience in Synthetics
editTest run our new experimental real browser agent to capture the full page load, including detailed information about each asset and how they perform during the page load in a waterfall. One unoptimised image, bloated Javascript snippet or unreliable third party can break an entire website. It’s essential to understand this, given that these points of failure are often introduced outside of the normal release process by content management systems or tag managers.
To understand precisely what is on your website and how it’s impacting the user experience, we’ve enhanced the core waterfall capability that shipped in 7.11 by adding the ability to quickly filter the objects by MIME type that match a search string. Drilling in on objects from a specific third party or simply getting an overview of how much javascript is loading on your website is now a click away.
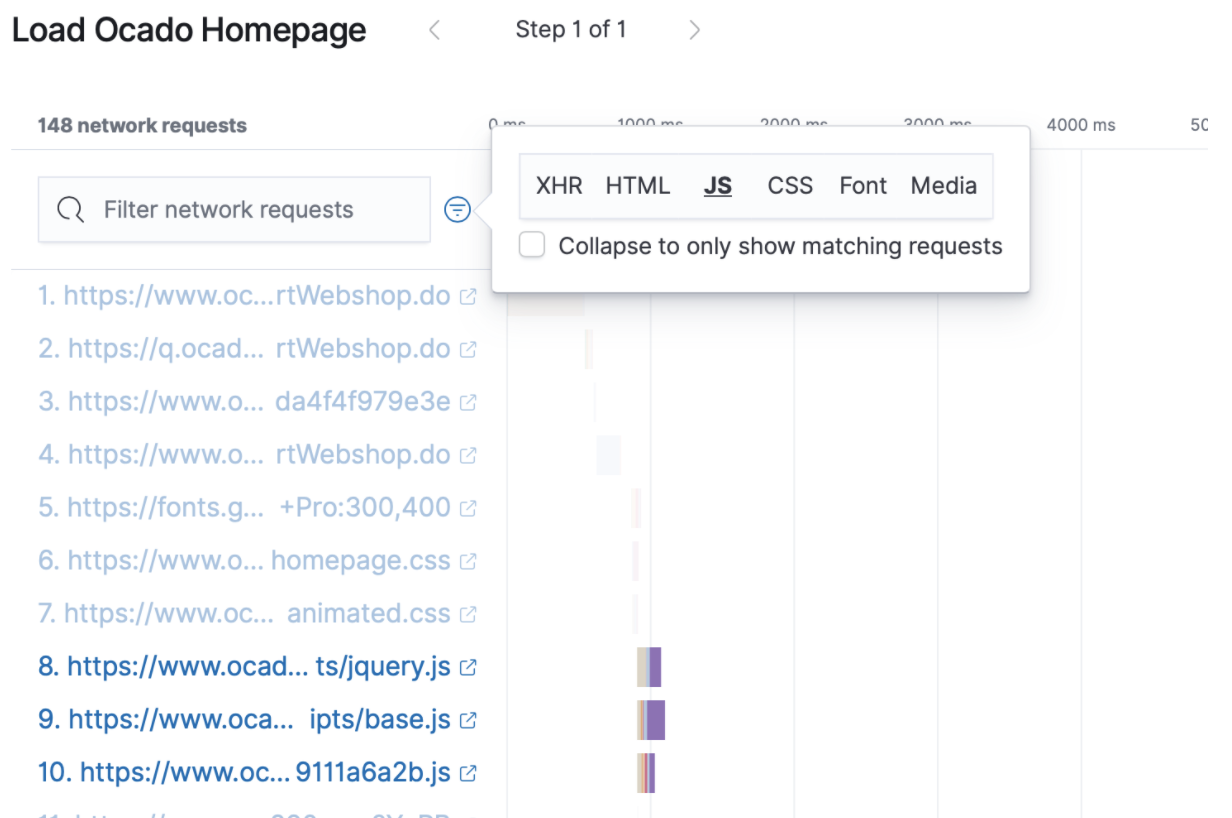
Additionally, you can now view detailed diagnostic information about any object in the page load, including headers and individual object performance, to troubleshoot and proactively spot issues. This detailed level is essential for proactively monitoring performance and reducing the time it takes to get back to normal during a period of abnormal behaviour.
Enhanced metric alerts with warning thresholds
editAlert thresholds reflect a level beyond which a monitored system is considered unhealthy. Besides the mandatory alert level (red), sometimes there’s a need to define a warning level (yellow) to classify a system performance as concerning but not critical. Such distinction is typically used to notify different groups based on alert severity or define custom routing policies for alert notifications. For example, send warning notifications to Slack and alert notifications to PagerDuty.
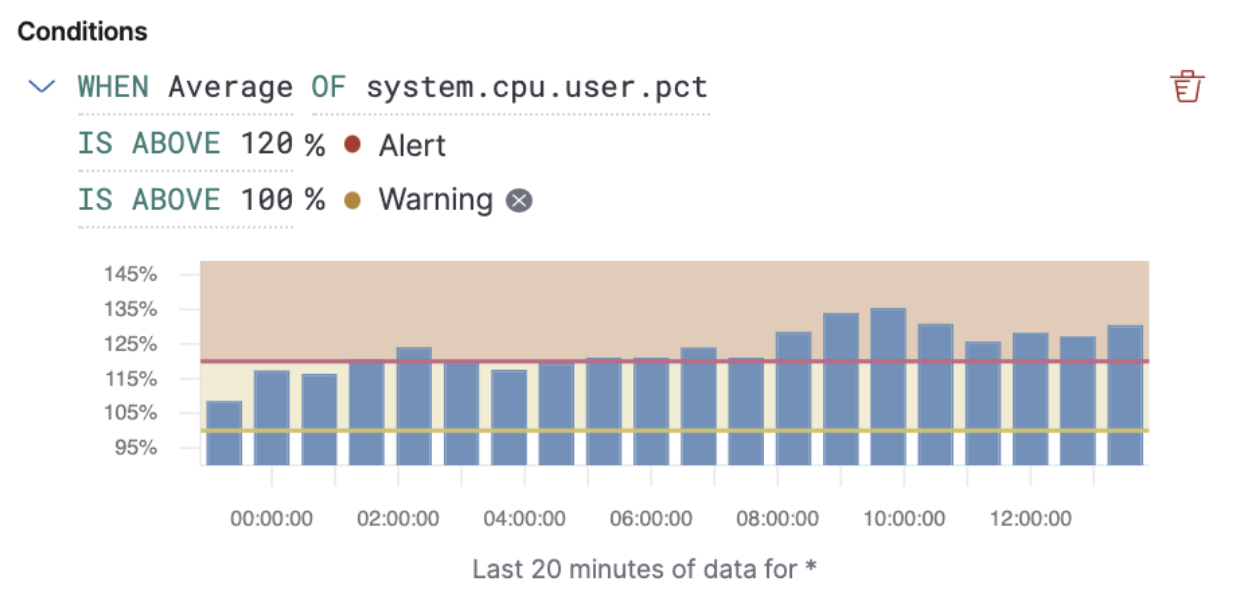
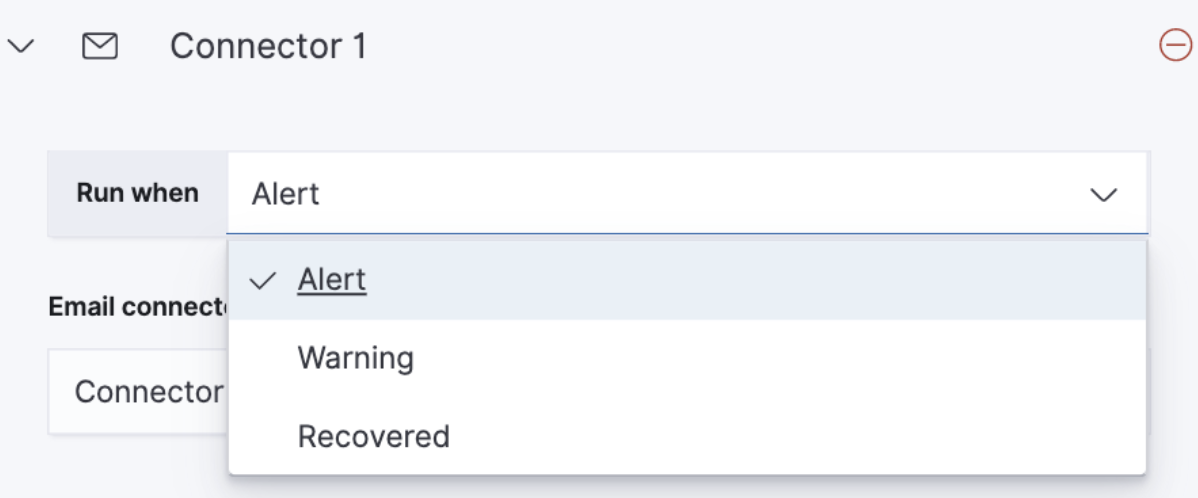
For 7.12, we’ve added the ability to define warning thresholds for Inventory and Metric threshold alerts. The new warning thresholds are optional and can be set for every condition specified in a threshold alert. You can now define alert actions for each threshold level, which will only trigger them when reached.
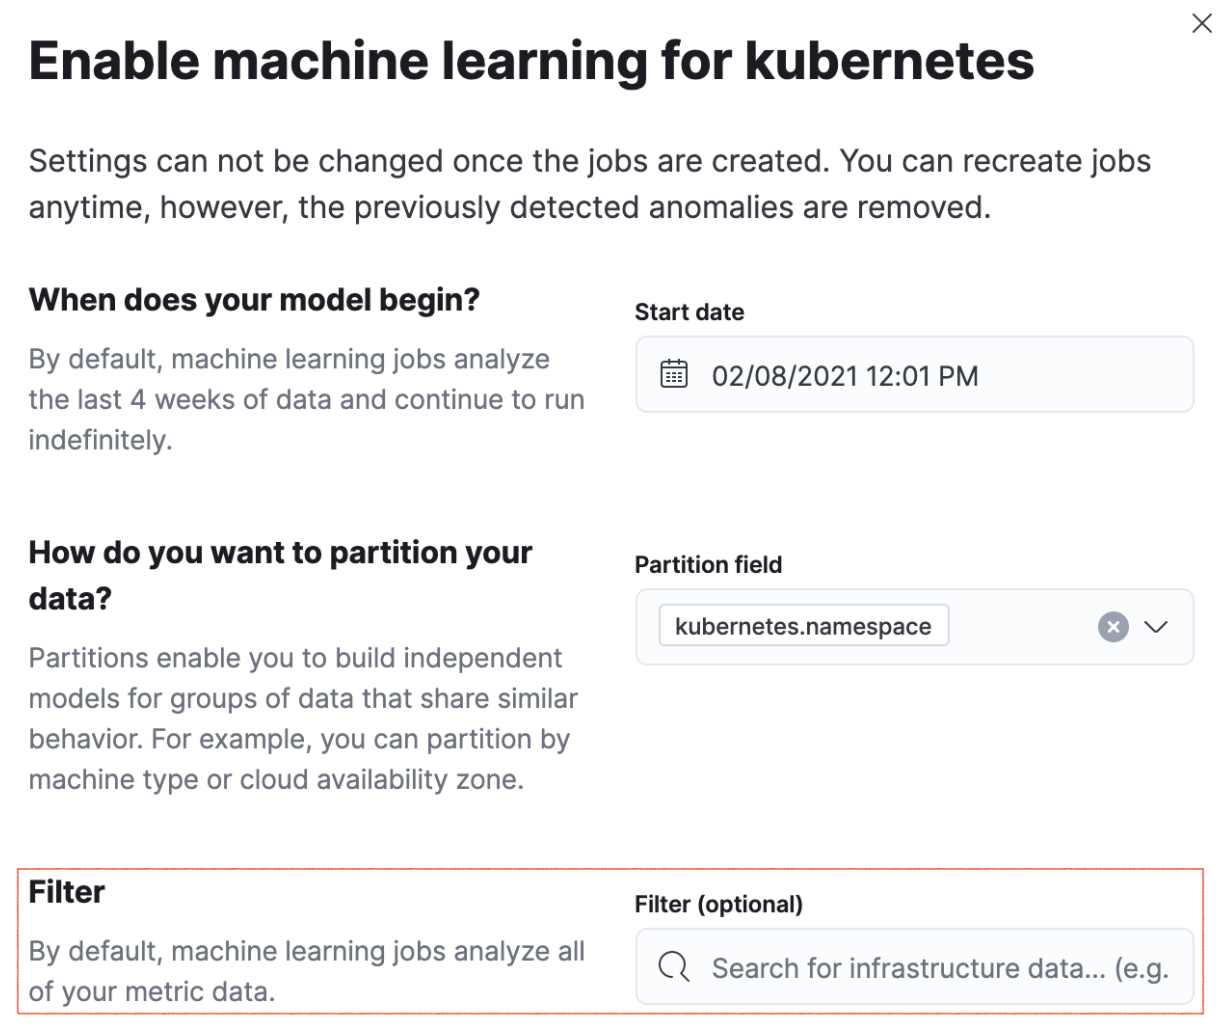
Configurable infrastructure anomaly scope and severity thresholds
editIn 7.12, we’ve added the ability to control what parts of your infrastructure anomaly detection jobs should analyze. You can now use the new filter option to set the scope for hosts and Kubernetes machine learning jobs. This way, you can configure anomaly detection to only look at your production Kubernetes clusters located in a particular cloud region or hosts that follow a specific tagging policy.
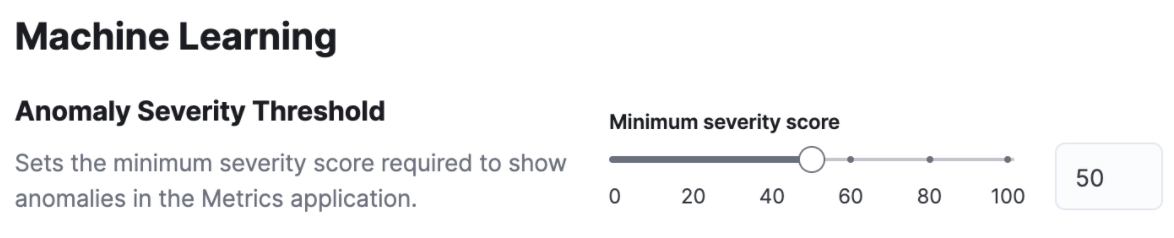
Anomaly scores are used to provide a realistic view of the anomaly detection results. The anomaly score is a value from 0 to 100, which indicates the significance of the anomaly compared to previously seen anomalies.
Not all anomalies are equally significant, so we’ve added the ability to control what anomalies are highlighted in the UI based on the anomaly severity threshold. For example, if you are only interested in critical anomalies, this setting makes it easier to visualize anomalies with a high severity score.
You can define the anomaly severity threshold on the Settings page of the Metrics app in Kibana.
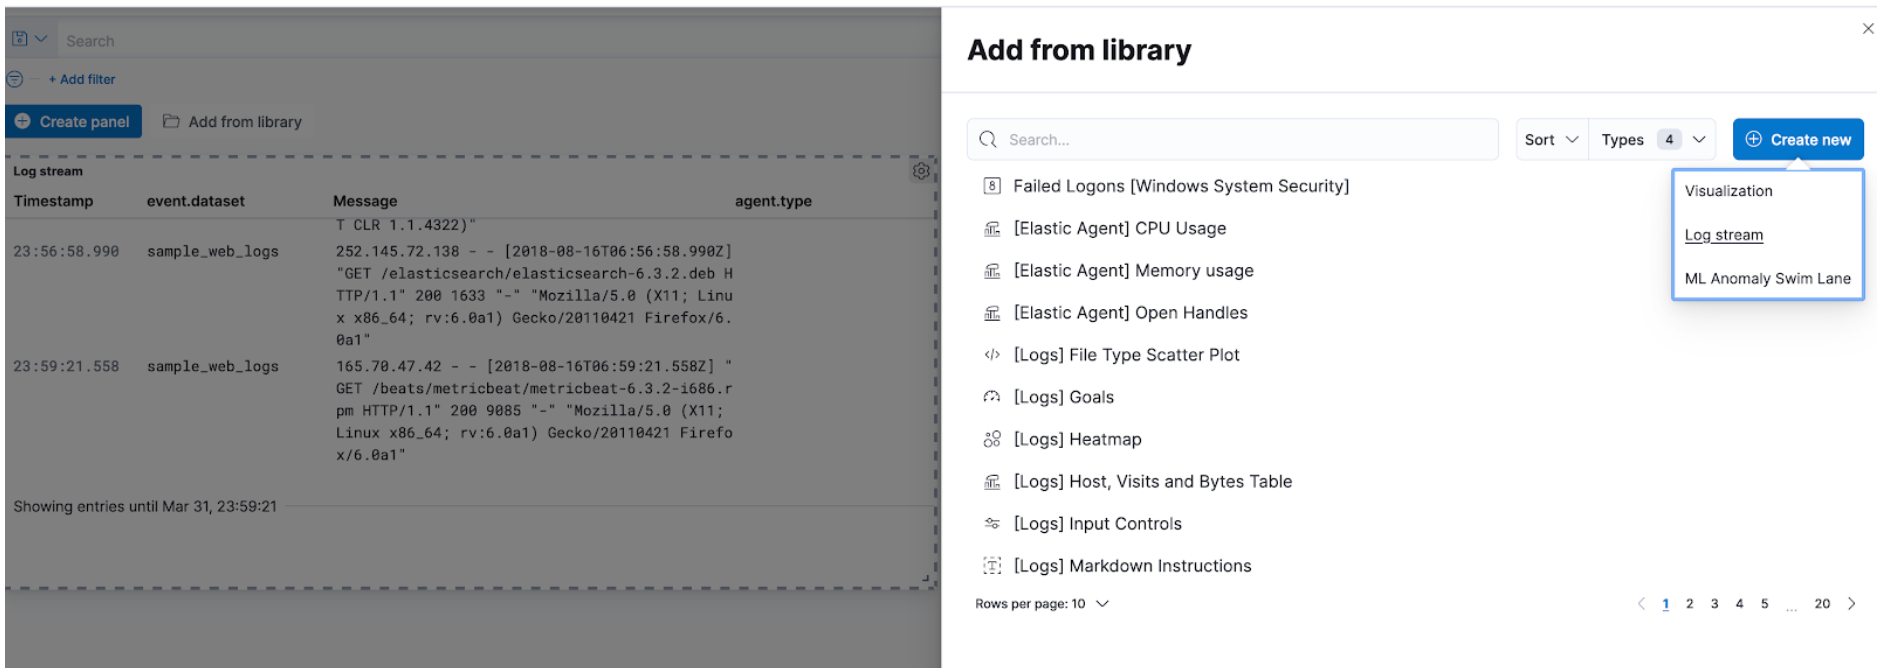
Embedded logs stream view in dashboards
editFor 7.12, we’re excited to announce that the logs stream view is now an embeddable component. So when building a new dashboard or editing an existing one, you can follow the steps below to embed the logs stream view.
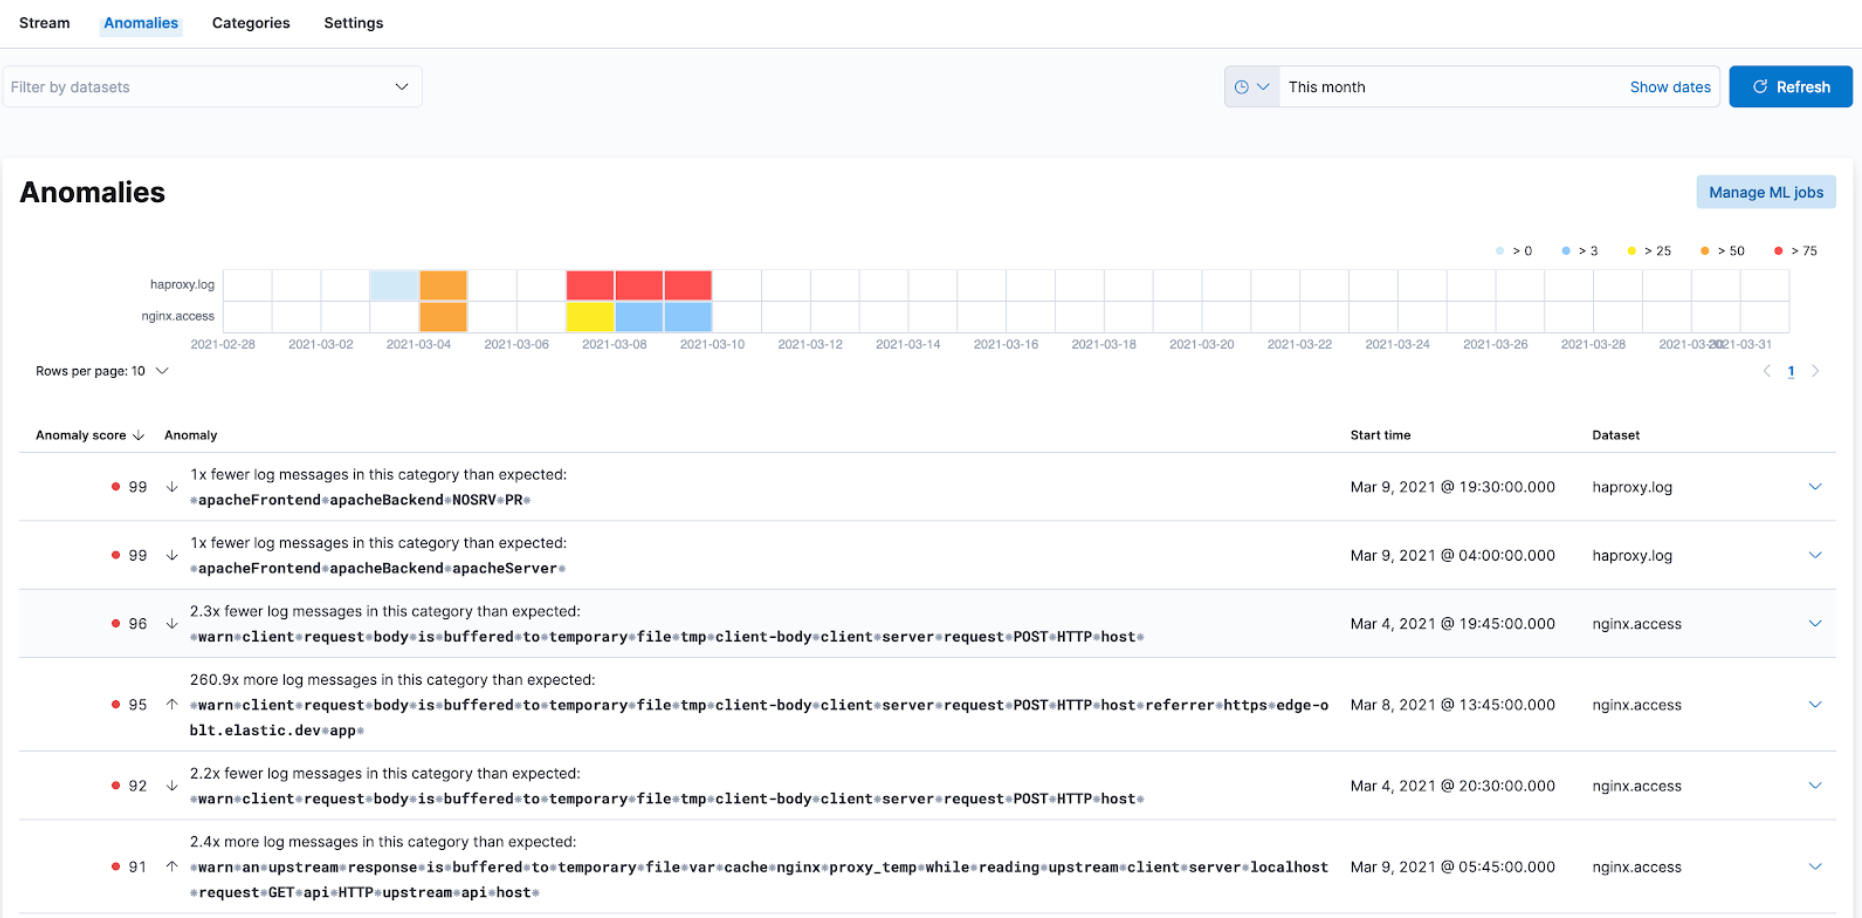
Swimlane charts for visualizing machine learning anomalies
editIn 7.12, we have replaced the anomalies visualization from bar charts to swimlane charts, similar to the anomaly explorer views in our machine learning solution. The swimlane view enables a three-dimensional visualization experience with time and dataset as first and second dimensions, and color providing the anomaly severity dimension.
Sync time across observability apps
editPreviously, when switching between the Observability apps using the left-hand navigation, we did not always persist the time range selection. In 7.12, we improved the workflow to ensure that the application’s timeframe is preserved as users navigate. This improvement dramatically increases the speed and efficiency of investigation workflows across logs, metrics, traces, and other data types.
Elastic Stack monitoring out-of-the-box alerts
editThe Elastic Stack monitoring feature provides a way to keep a pulse on the health and performance of your Elasticsearch cluster. These alerts are preconfigured based on the best practices and provide flexibility to tailor them to meet your specific needs, including changing alert conditions and actions using the setup mode.
We now have the following preconfigured alerts that are automatically created:
- CCR read exceptions
- Cluster health
- CPU usage
- Disk usage
- Elasticsearch version mismatch
- Kibana version mismatch
- License expiration
- Logstash version mismatch
- Memory usage (JVM)
- Missing monitoring data
- Nodes changed
- Shard size
- Thread pool search rejections
- Thread pool write rejections
This release adds a new alert for Shard size that notifies you when a primary shard exceeds 55 GB in size. You can apply index patterns to configure alerts for specific indices and modify the size value. The alert helps notify you when a shard grows too large because of misconfigured ILM policy or in cases where ILM policy may be running into errors. Very large shards can negatively affect the cluster’s ability to recover from failure. There is no fixed limit on how large shards can be, but a shard size of 50GB as a limit has been seen to work for a variety of use-cases.
This release also recreates stack monitoring default watches to Kibana alerts. When you visit the stack monitoring application for the first time, the following default watches are created as Kibana alerts, and the corresponding watches are deleted following a successful conversion after an upgrade:
- Cluster health
- Elasticsearch version mismatch
- Kibana version mismatch
- Logstash version mismatch
- Nodes changed
- License expiration
The default action for these out of the box alerts write to Kibana logs. You should configure additional actions to be notified when these alerts trigger using your favorite notification method.
Observability deployment auto-scaling in Elasticsearch Service and Elastic Cloud Enterprise
editAutoscaling was one of the most requested features from the Elastic Observability community, whether looking for easy ways to keep up with dynamic demands or extending instrumentation to all applications in an optimized fashion without overpaying for max capacity.
Now, you can let Elastic Cloud automatically monitor storage utilization and machine learning capacity, adjust resources, and maintain performance with autoscaling so that you can focus on running your business. Autoscaling is now available for Elastic Cloud and Elastic Cloud Enterprise 2.9. Autoscaling monitors both the storage utilization for your Elasticsearch data nodes and the available capacity for your machine learning jobs. Autoscaling automatically adjusts resource capacity to maintain node performance.
You can enable autoscaling using the API, CLI, or from the Elastic Cloud console. Your Elasticsearch data nodes’ capacity grows as you store more data. Your machine learning node’s memory and CPU capacity will grow or shrink, based on your machine learning jobs' resource requirements. You can also set thresholds to prevent runaway cluster growth.
Frozen data tier on object stores like S3 (Technical Preview)
editUnlock new value by making object stores like S3 fully searchable with the new frozen tier, which is now in technical preview. Using the new frozen tier, you can decouple compute from storage, adding the capability to search directly on object storage such as AWS’s S3, Google Cloud Storage, and Microsoft Azure Storage.
This functionality allows you to search your data at a fraction of the cost with a trade-off in performance while reducing the number of dedicated resources needed for a search. By only fetching the data required to complete a query from the object store and caching this data locally as needed, the frozen tier offers the best search experience while enabling you to store an unlimited amount of data.
With searchable snapshots, you can cost-effectively search across all of your application content and historical workplace records without breaking the bank. Store more analytics data for marketing analysis or test and release versioned application catalogs for new deployment strategies. In observability use cases, you no longer need to choose which log, metric, or APM data to delete to save money. Imagine having the ability to search year over year on application performance without needing to rehydrate your data from backup.