Find latency and error correlations
editFind latency and error correlations
editCorrelations surface attributes of your data that are potentially correlated with high-latency or erroneous transactions. By default, a number of attributes commonly known to cause performance issues, like version, infrastructure, and location, are included, but all are completely customizable to your APM data. Find something interesting? A quick click of a button will auto-query your data as you work to resolve the underlying issue.
For example, a site reliability engineer, who is responsible for keeping production systems up and running, notices an increase in latency in certain transactions. Analyzing metadata or tags that exist in high-latency transactions but not in lower-latency transactions can potentially point towards the root cause. They may find that a particular piece of hardware, like a host or pod, has failed, increasing latency. Or, perhaps set of users, based on IP address or region, is facing increased latency due to local data center issues.
View correlations
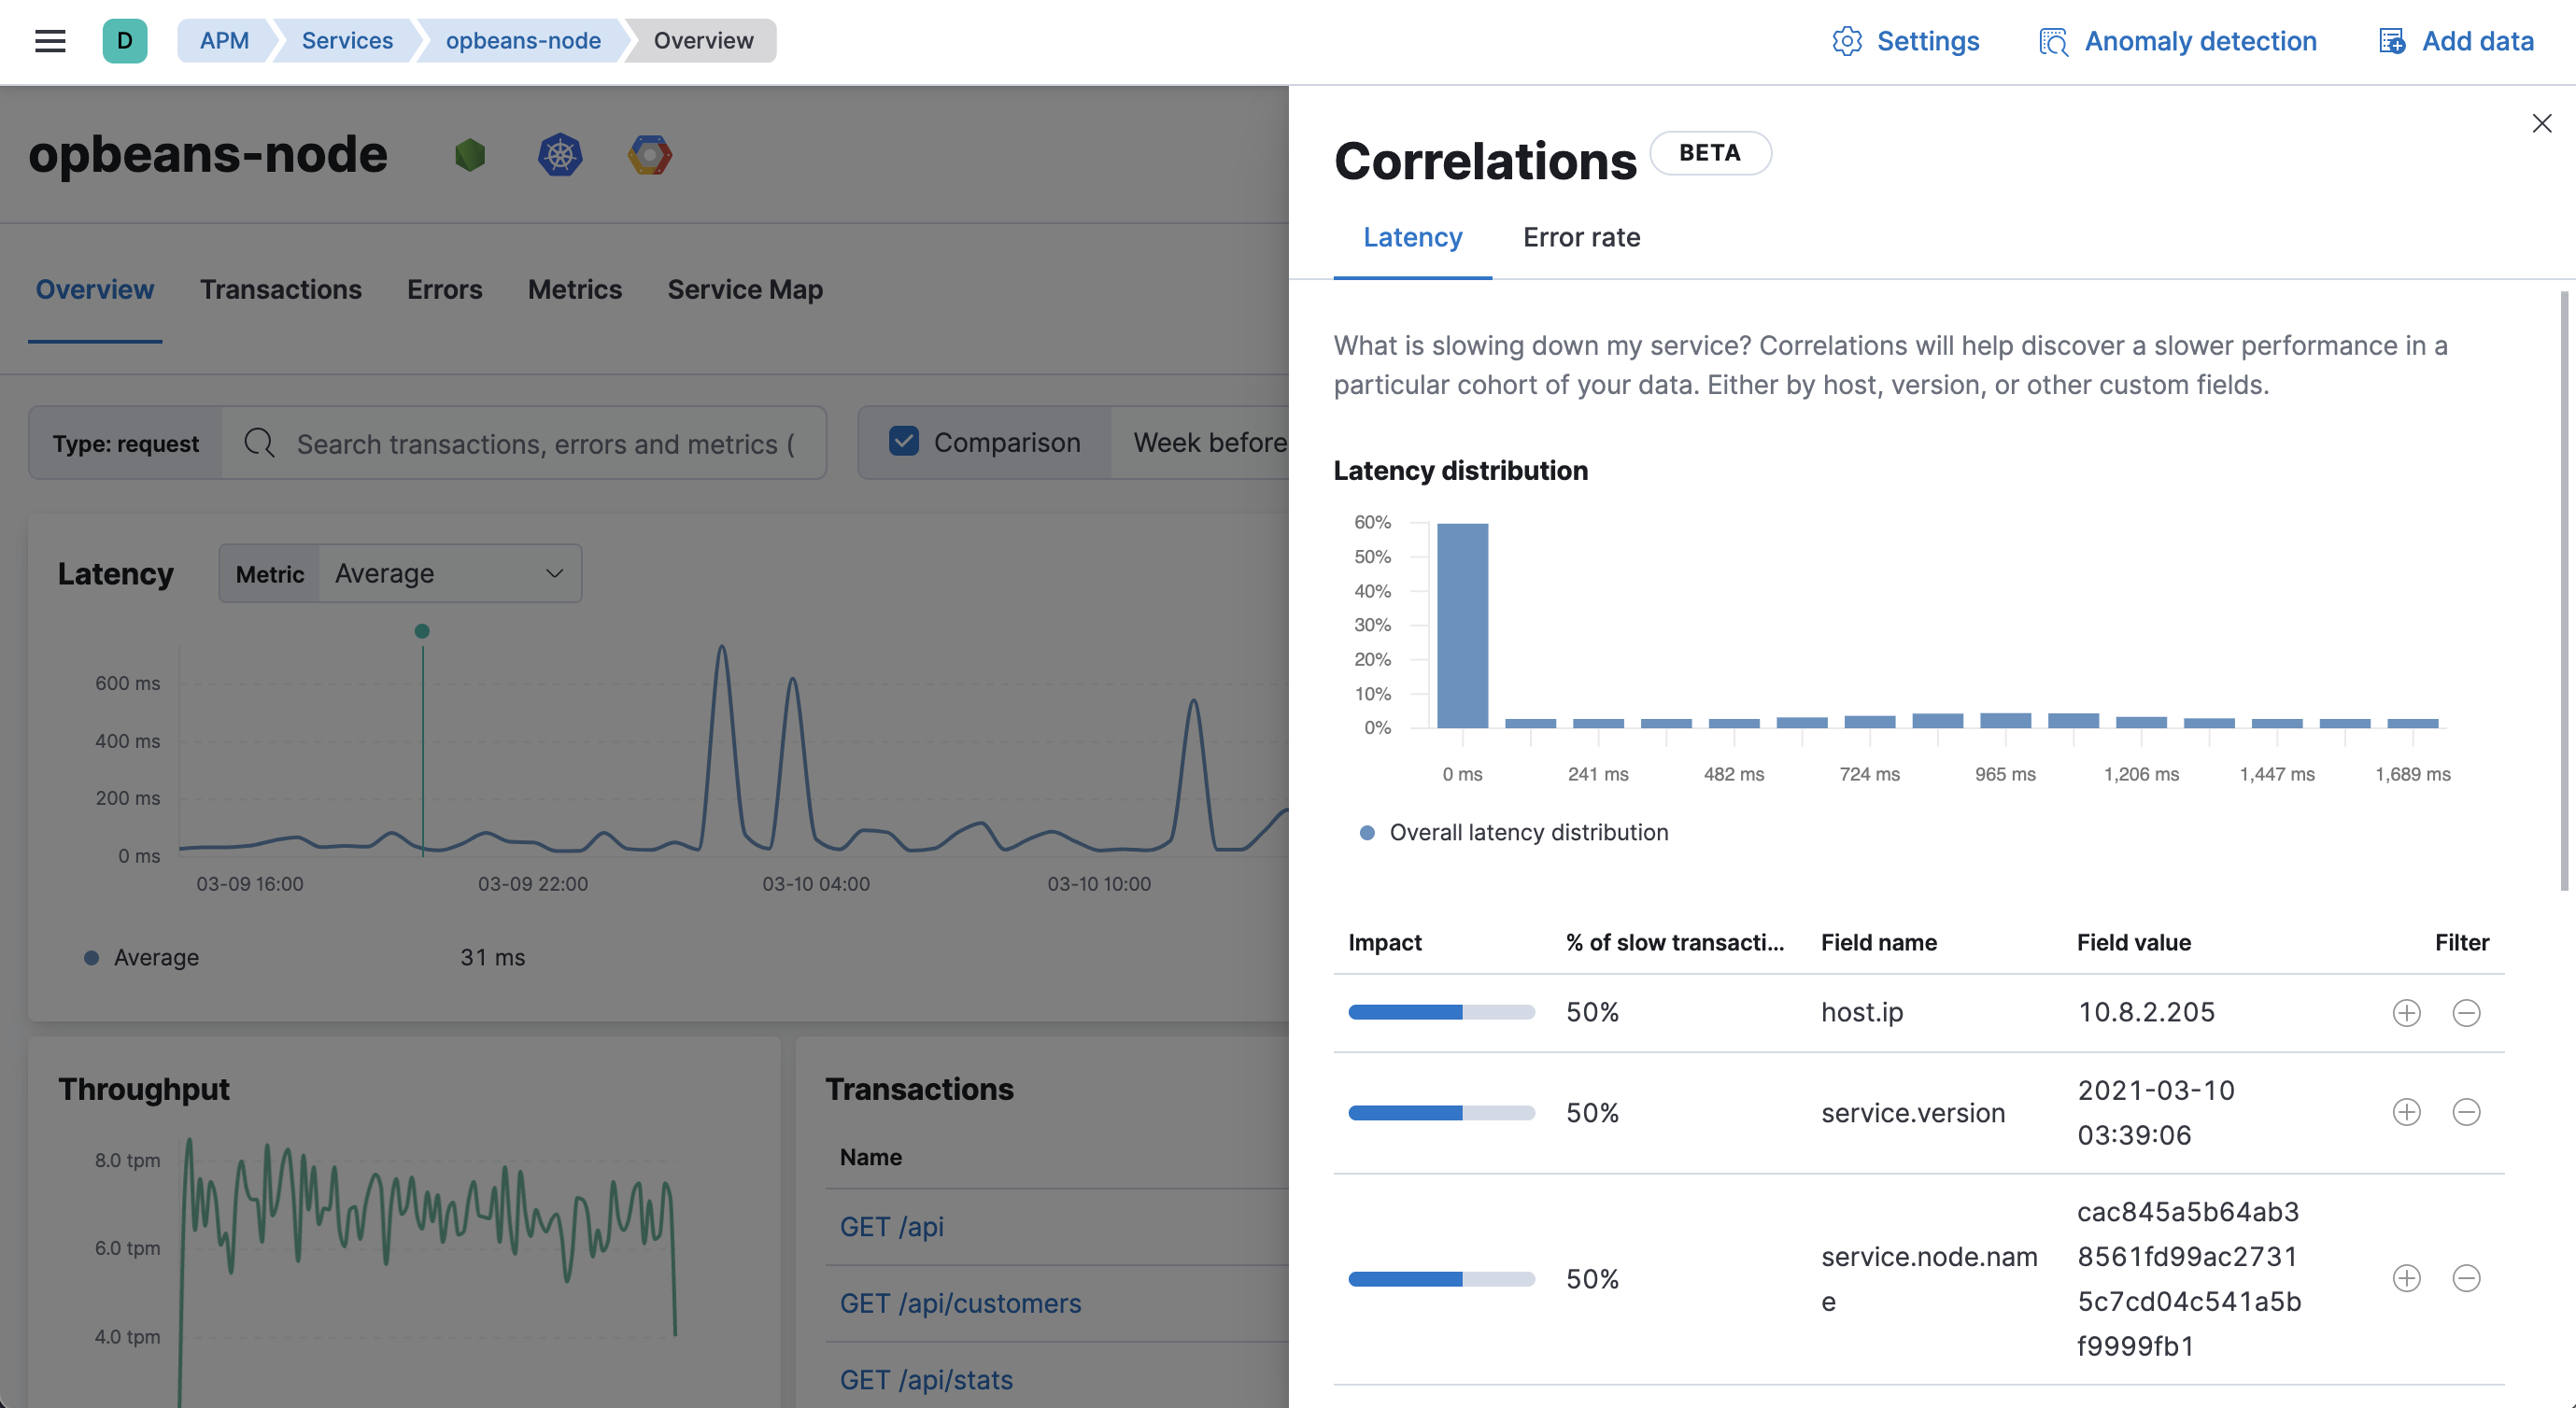
editWith a service selected, click View correlations:
Queries within the APM app apply to the correlations shown in the correlations fly-out.
If a correlated field seems noteworthy, use the Filter quick links:
-
+creates a new query in the APM app for filtering transactions containing the selected value. -
-creates a new query in the APM app to filter out transactions containing the selected value.
Find high-latency correlations
editCorrelations help you discover which fields are contributing to increased service latency.
A latency distribution chart visualizes the overall latency of the selected service’s transactions. Correlated attributes are sorted by Impact–a visual representation of the significant terms aggregation score that powers correlations. Attributes with a high impact, or attributes present in a large percentage of slow transactions, may contribute to increased latency.
To find high-latency correlations, hover over each potentially correlated attribute to compare the latency distribution of transactions with and without the selected attribute.
For example, in the screenshot below, the field user_agent.name and value HeadlessChrome
exists primarily in higher-latency transactions between 3.7 and 8.7 seconds.
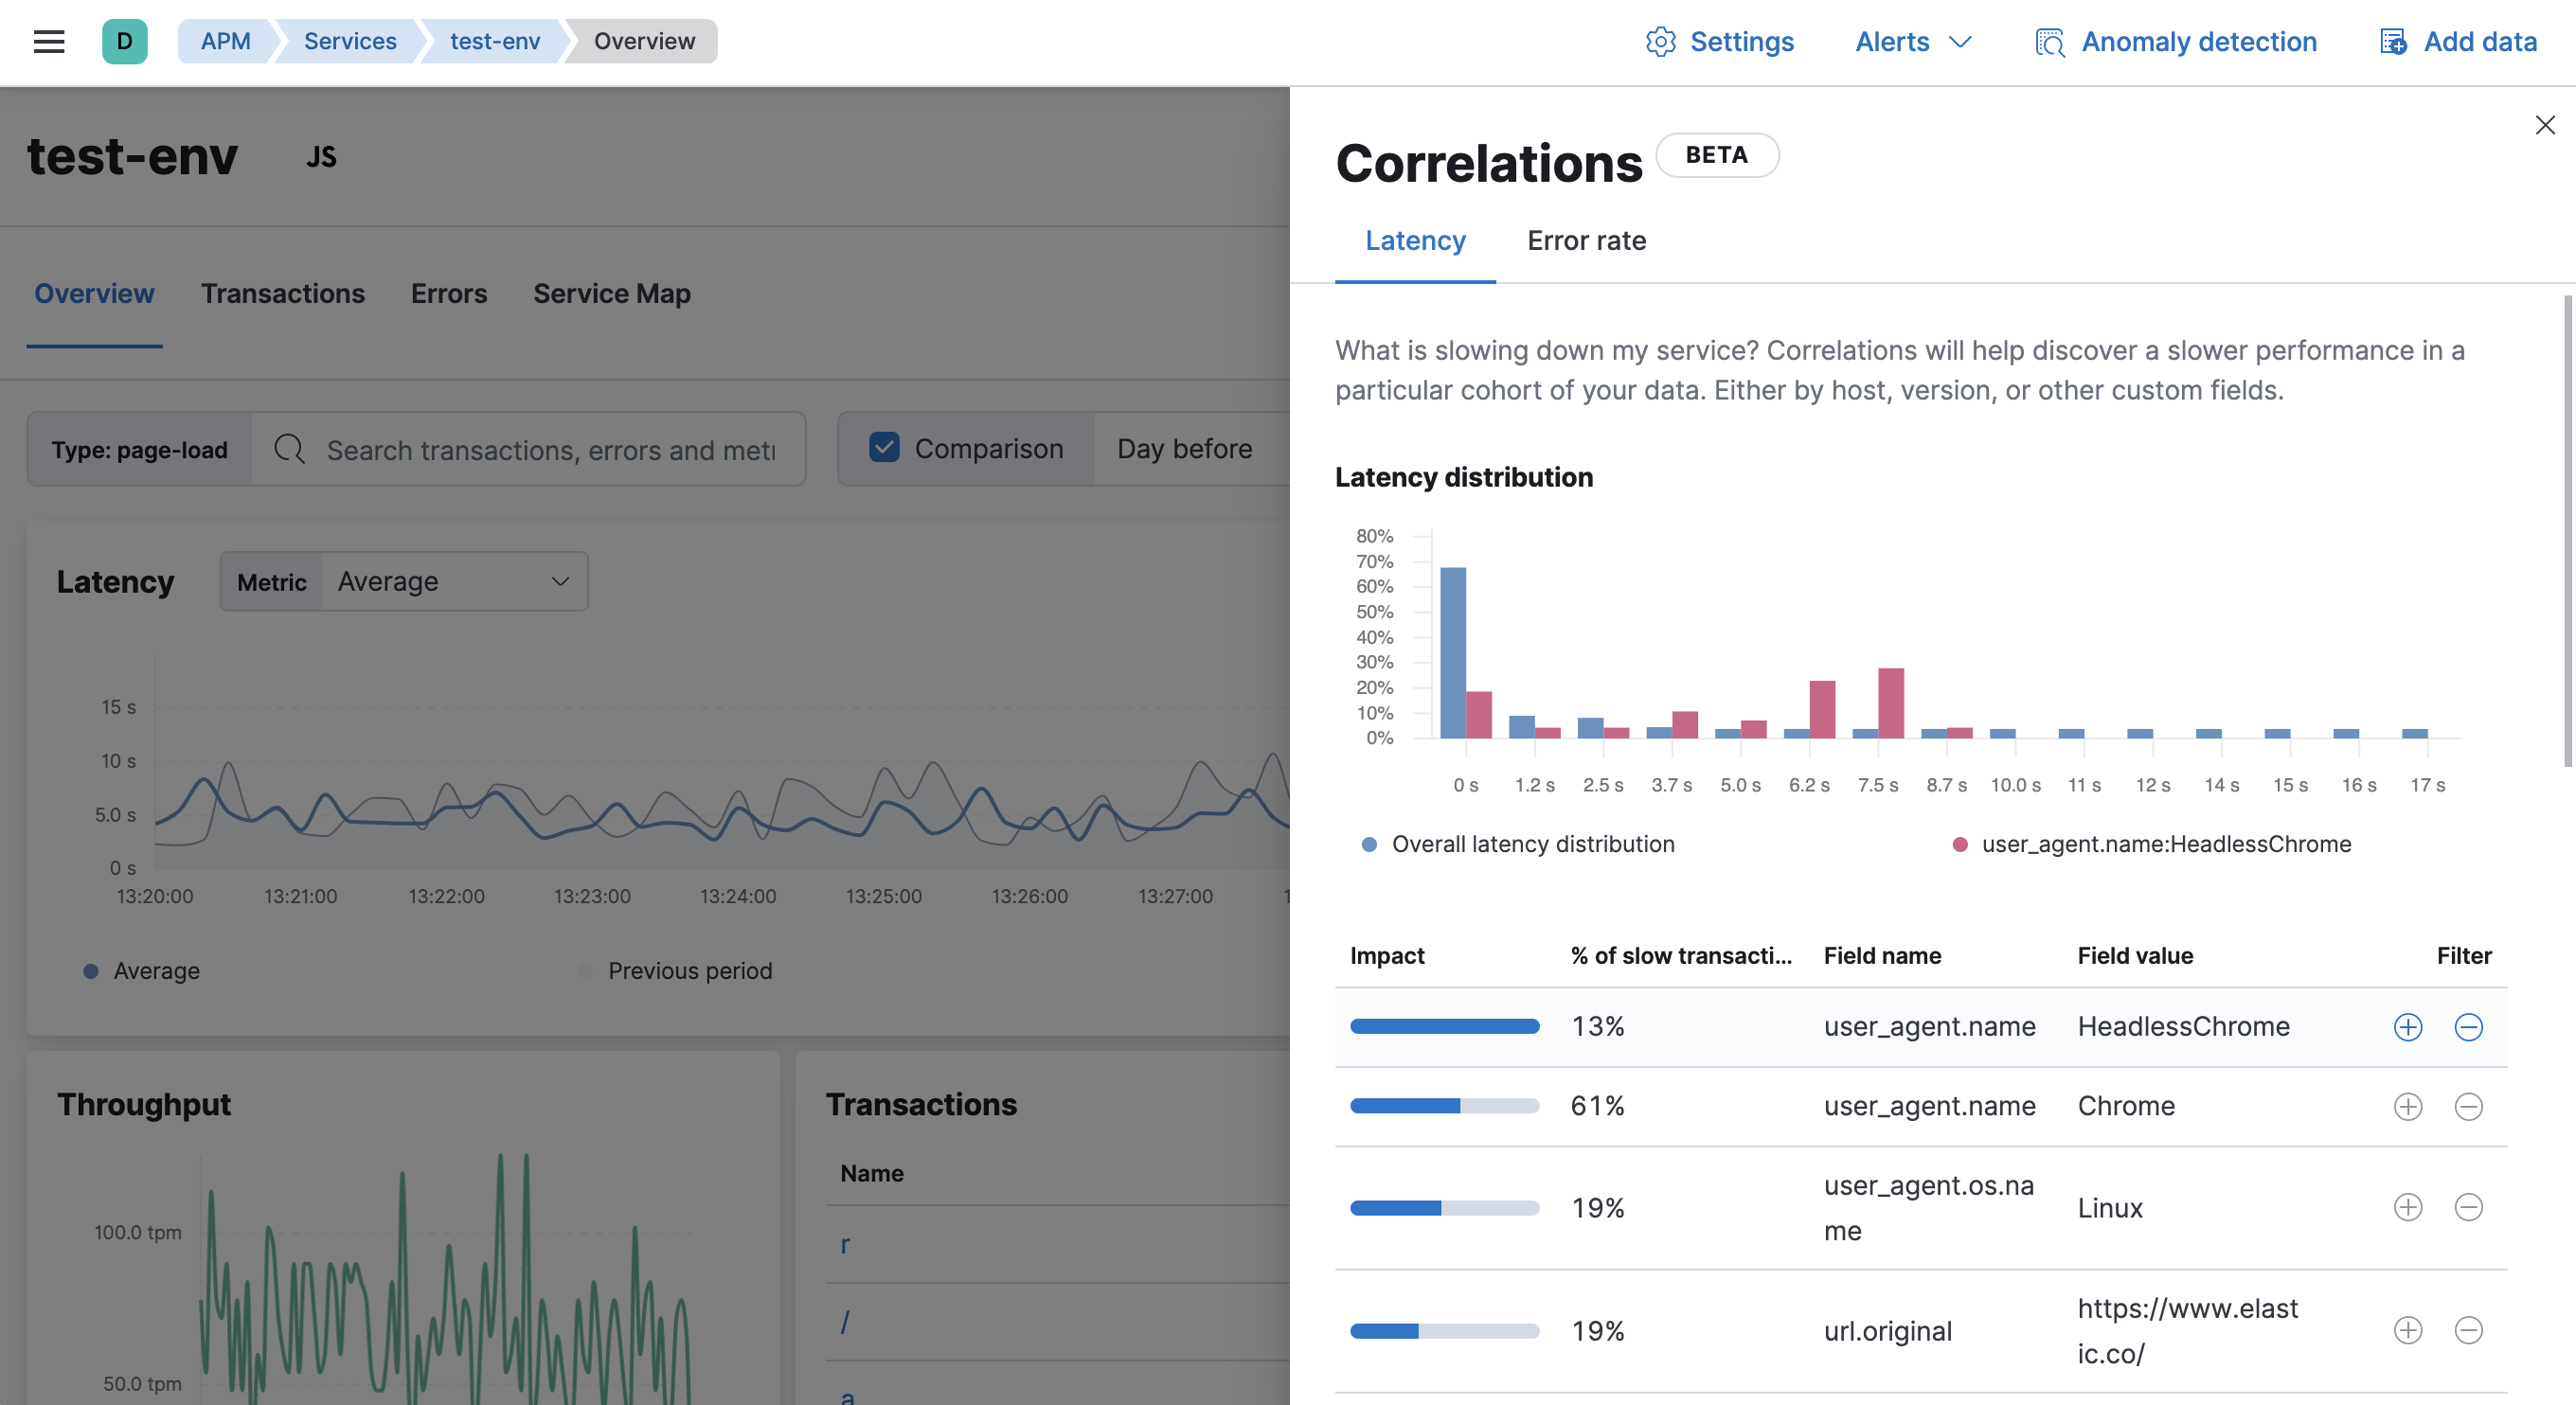
Select the + filter to create a new query in the APM app for transactions with
user_agent.name: HeadlessChrome. With the "noise" now filtered out,
you can begin viewing sample traces to continue your investigation.
As you sift through high-latency transactions, you’ll likely notice other interesting attributes. Return to the correlations fly-out and select Customize fields to search on these new attributes. You may need to do this a few times–each time filtering out more and more noise and bringing you closer to a diagnosis.
Find error rate correlations
editCorrelations help you discover which fields are contributing to failed transactions.
The Error rate over time chart visualizes the change in error rate over the selected time frame. Correlated attributes are sorted by Impact–a visual representation of the significant terms aggregation score that powers correlations. Attributes with a high impact, or attributes present in a large percentage of failed transactions, may contribute to increased error rates.
To find error rate correlations, hover over each potentially correlated attribute to compare the error rate distribution of transactions with and without the selected attribute.
For example, in the screenshot below, the field url.original and value http://localhost:3100...
existed in 100% of failed transactions between 6:00 and 10:30.
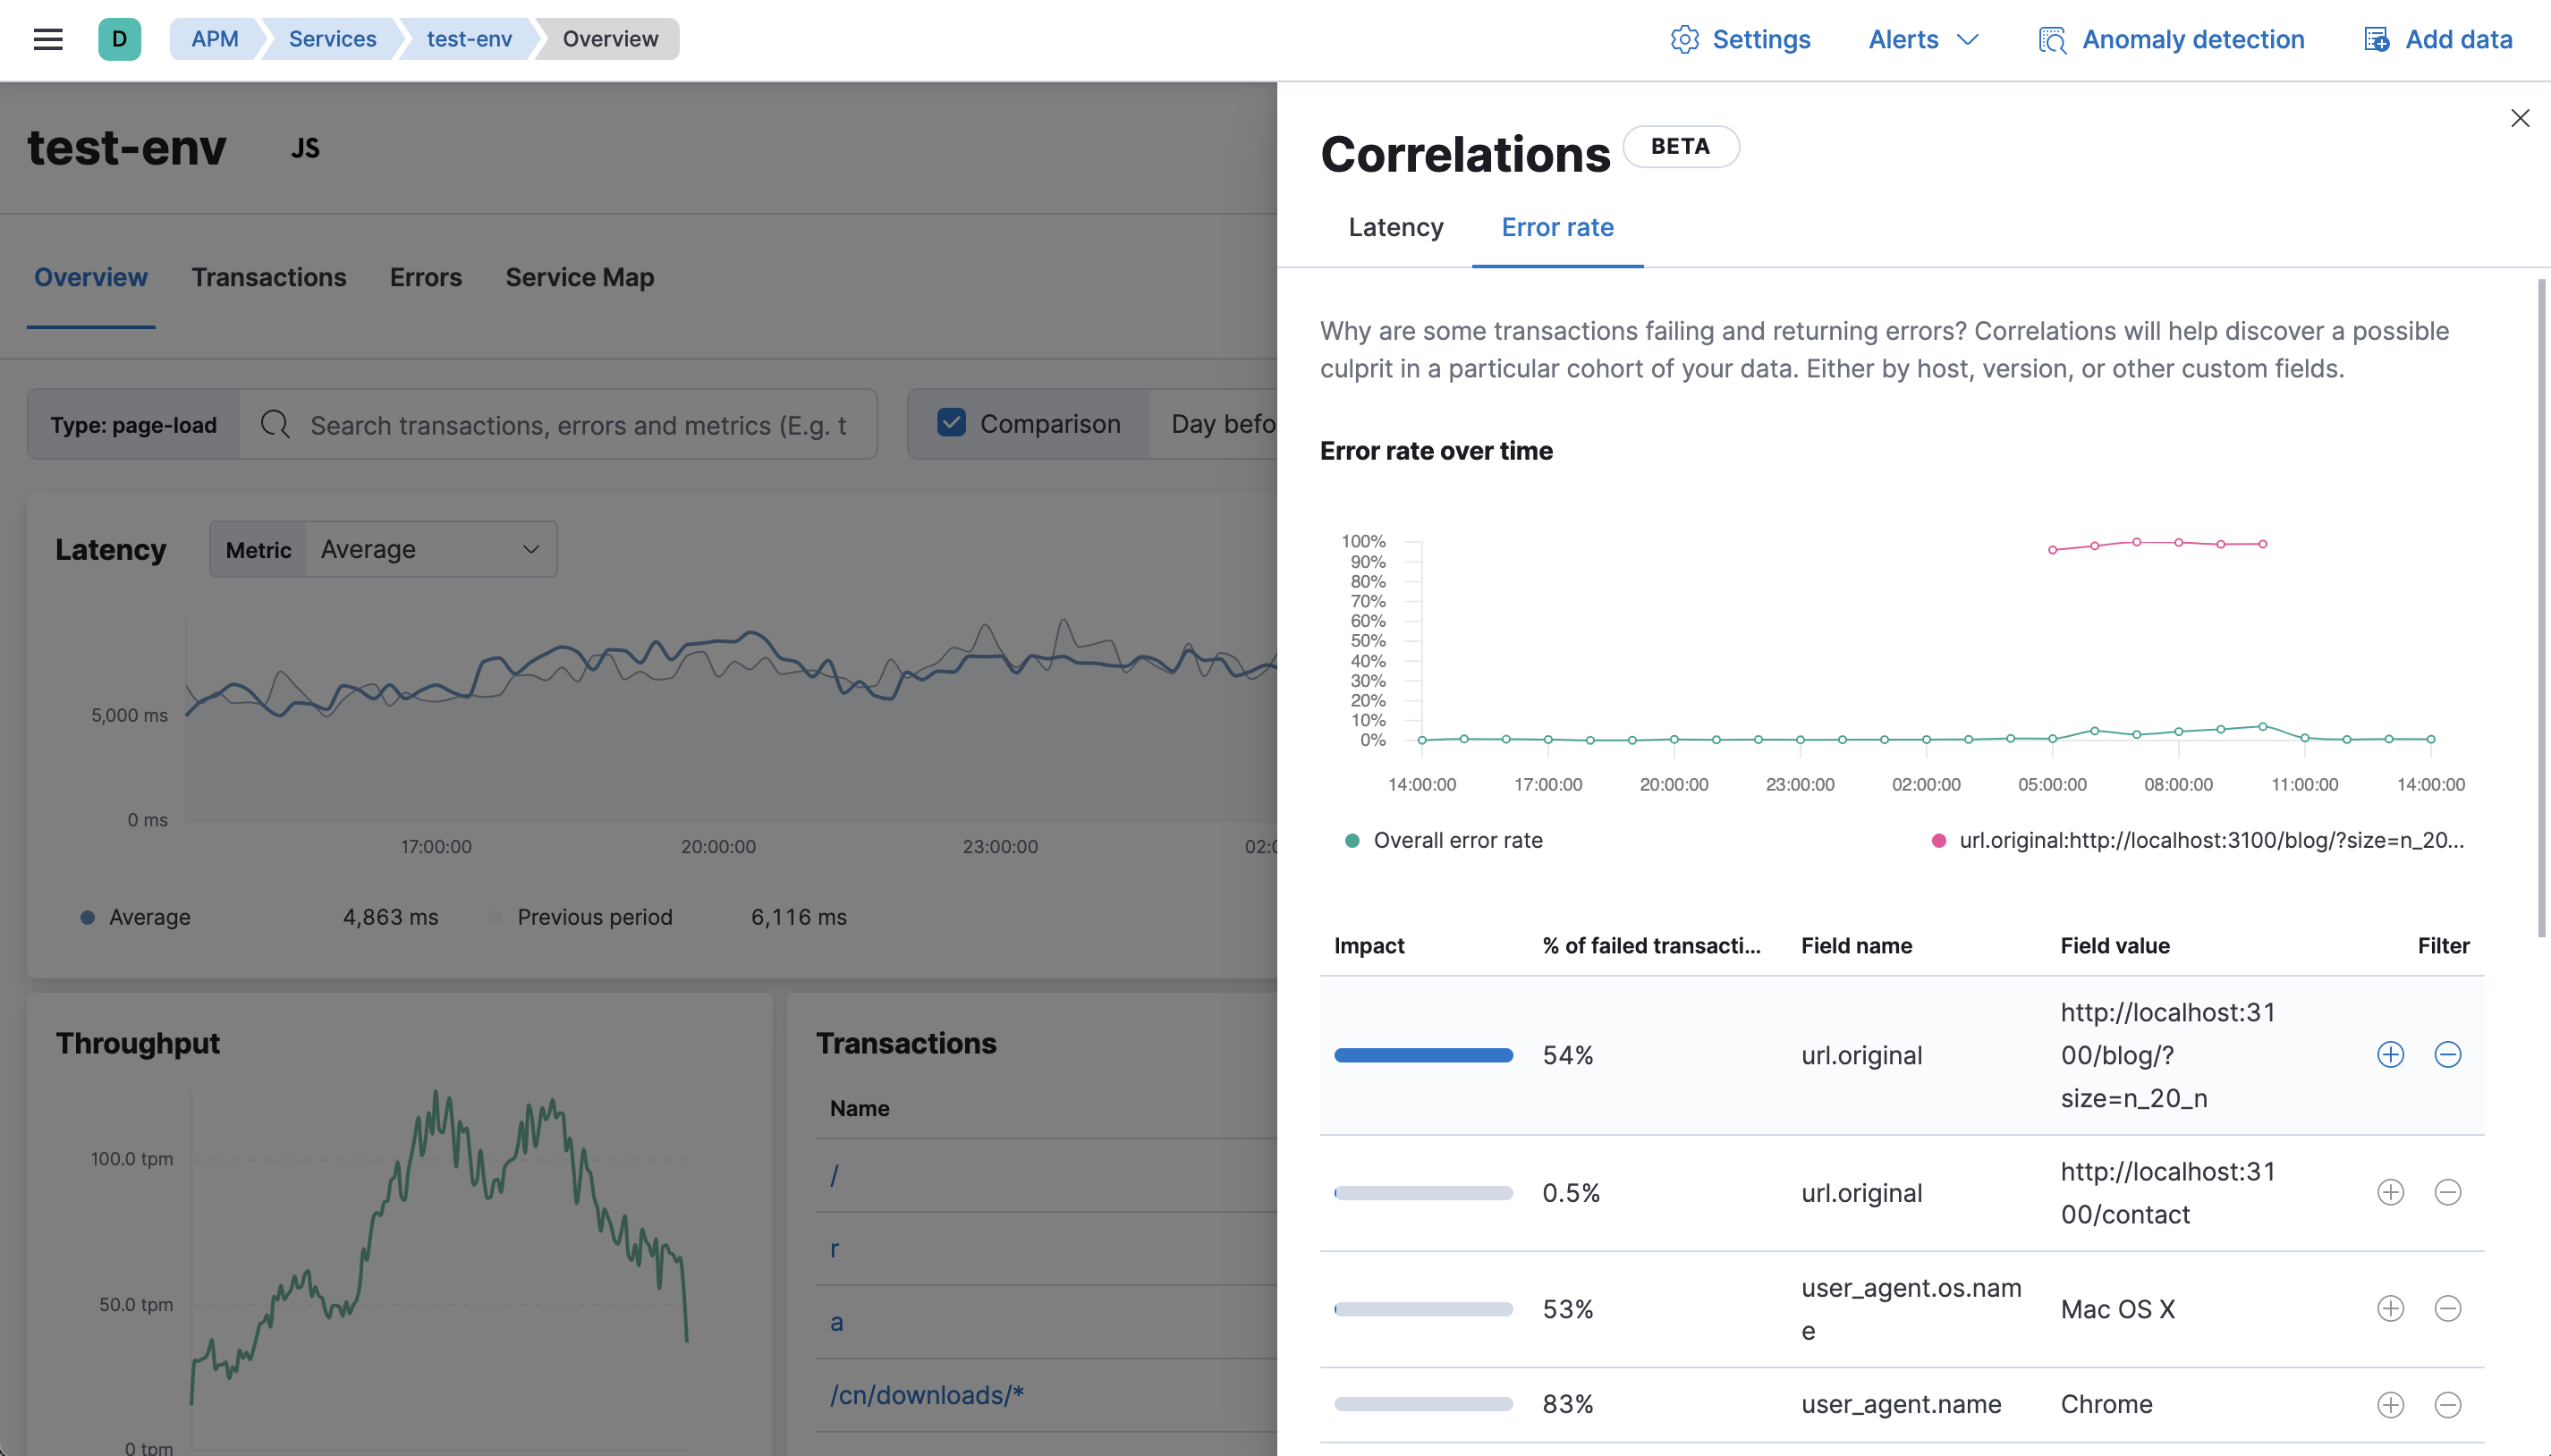
Select the + filter to create a new query in the APM app for transactions with
url.original: http://localhost:3100.... With the "noise" now filtered out,
you can begin viewing sample traces to continue your investigation.
As you sift through erroneous transactions, you’ll likely notice other interesting attributes. Return to the correlations fly-out and select Customize fields to search on these new attributes. You may need to do this a few times–each time filtering out more and more noise and bringing you closer to a diagnosis.
Customize fields
editCorrelations are only as good as the data they’re searching for. By default, a handful of attributes commonly known to cause performance issues are included. During the course of an investigation however, you may to need to add and remove fields from this list multiple times as you narrow in on a diagnosis.
Add and remove fields under the Customize fields dropdown. The following fields are selected by default. To keep the default list manageable, only the first six matching fields with wildcards are used.
Frontend (RUM) agent:
-
labels.* -
user.* -
user_agent.name -
user_agent.os.name -
url.original
Backend agents:
-
labels.* -
host.ip -
service.node.name -
service.version
Want to start over? Select reset to clear your customizations.