Observability highlights
editObservability highlights
editThis list summarizes the most important enhancements in Observability 7.10.
User experience
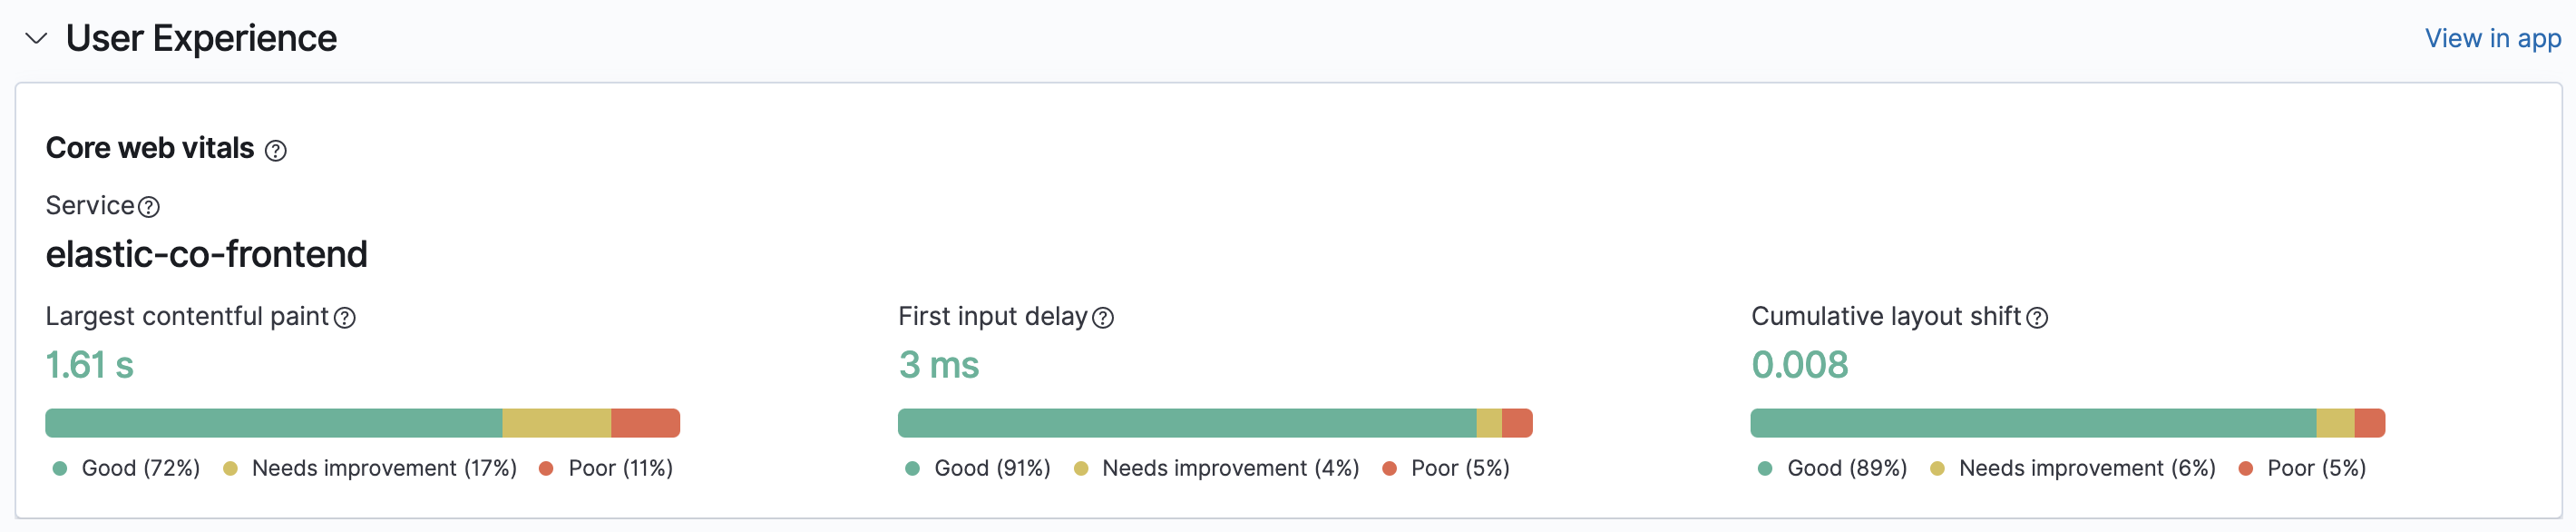
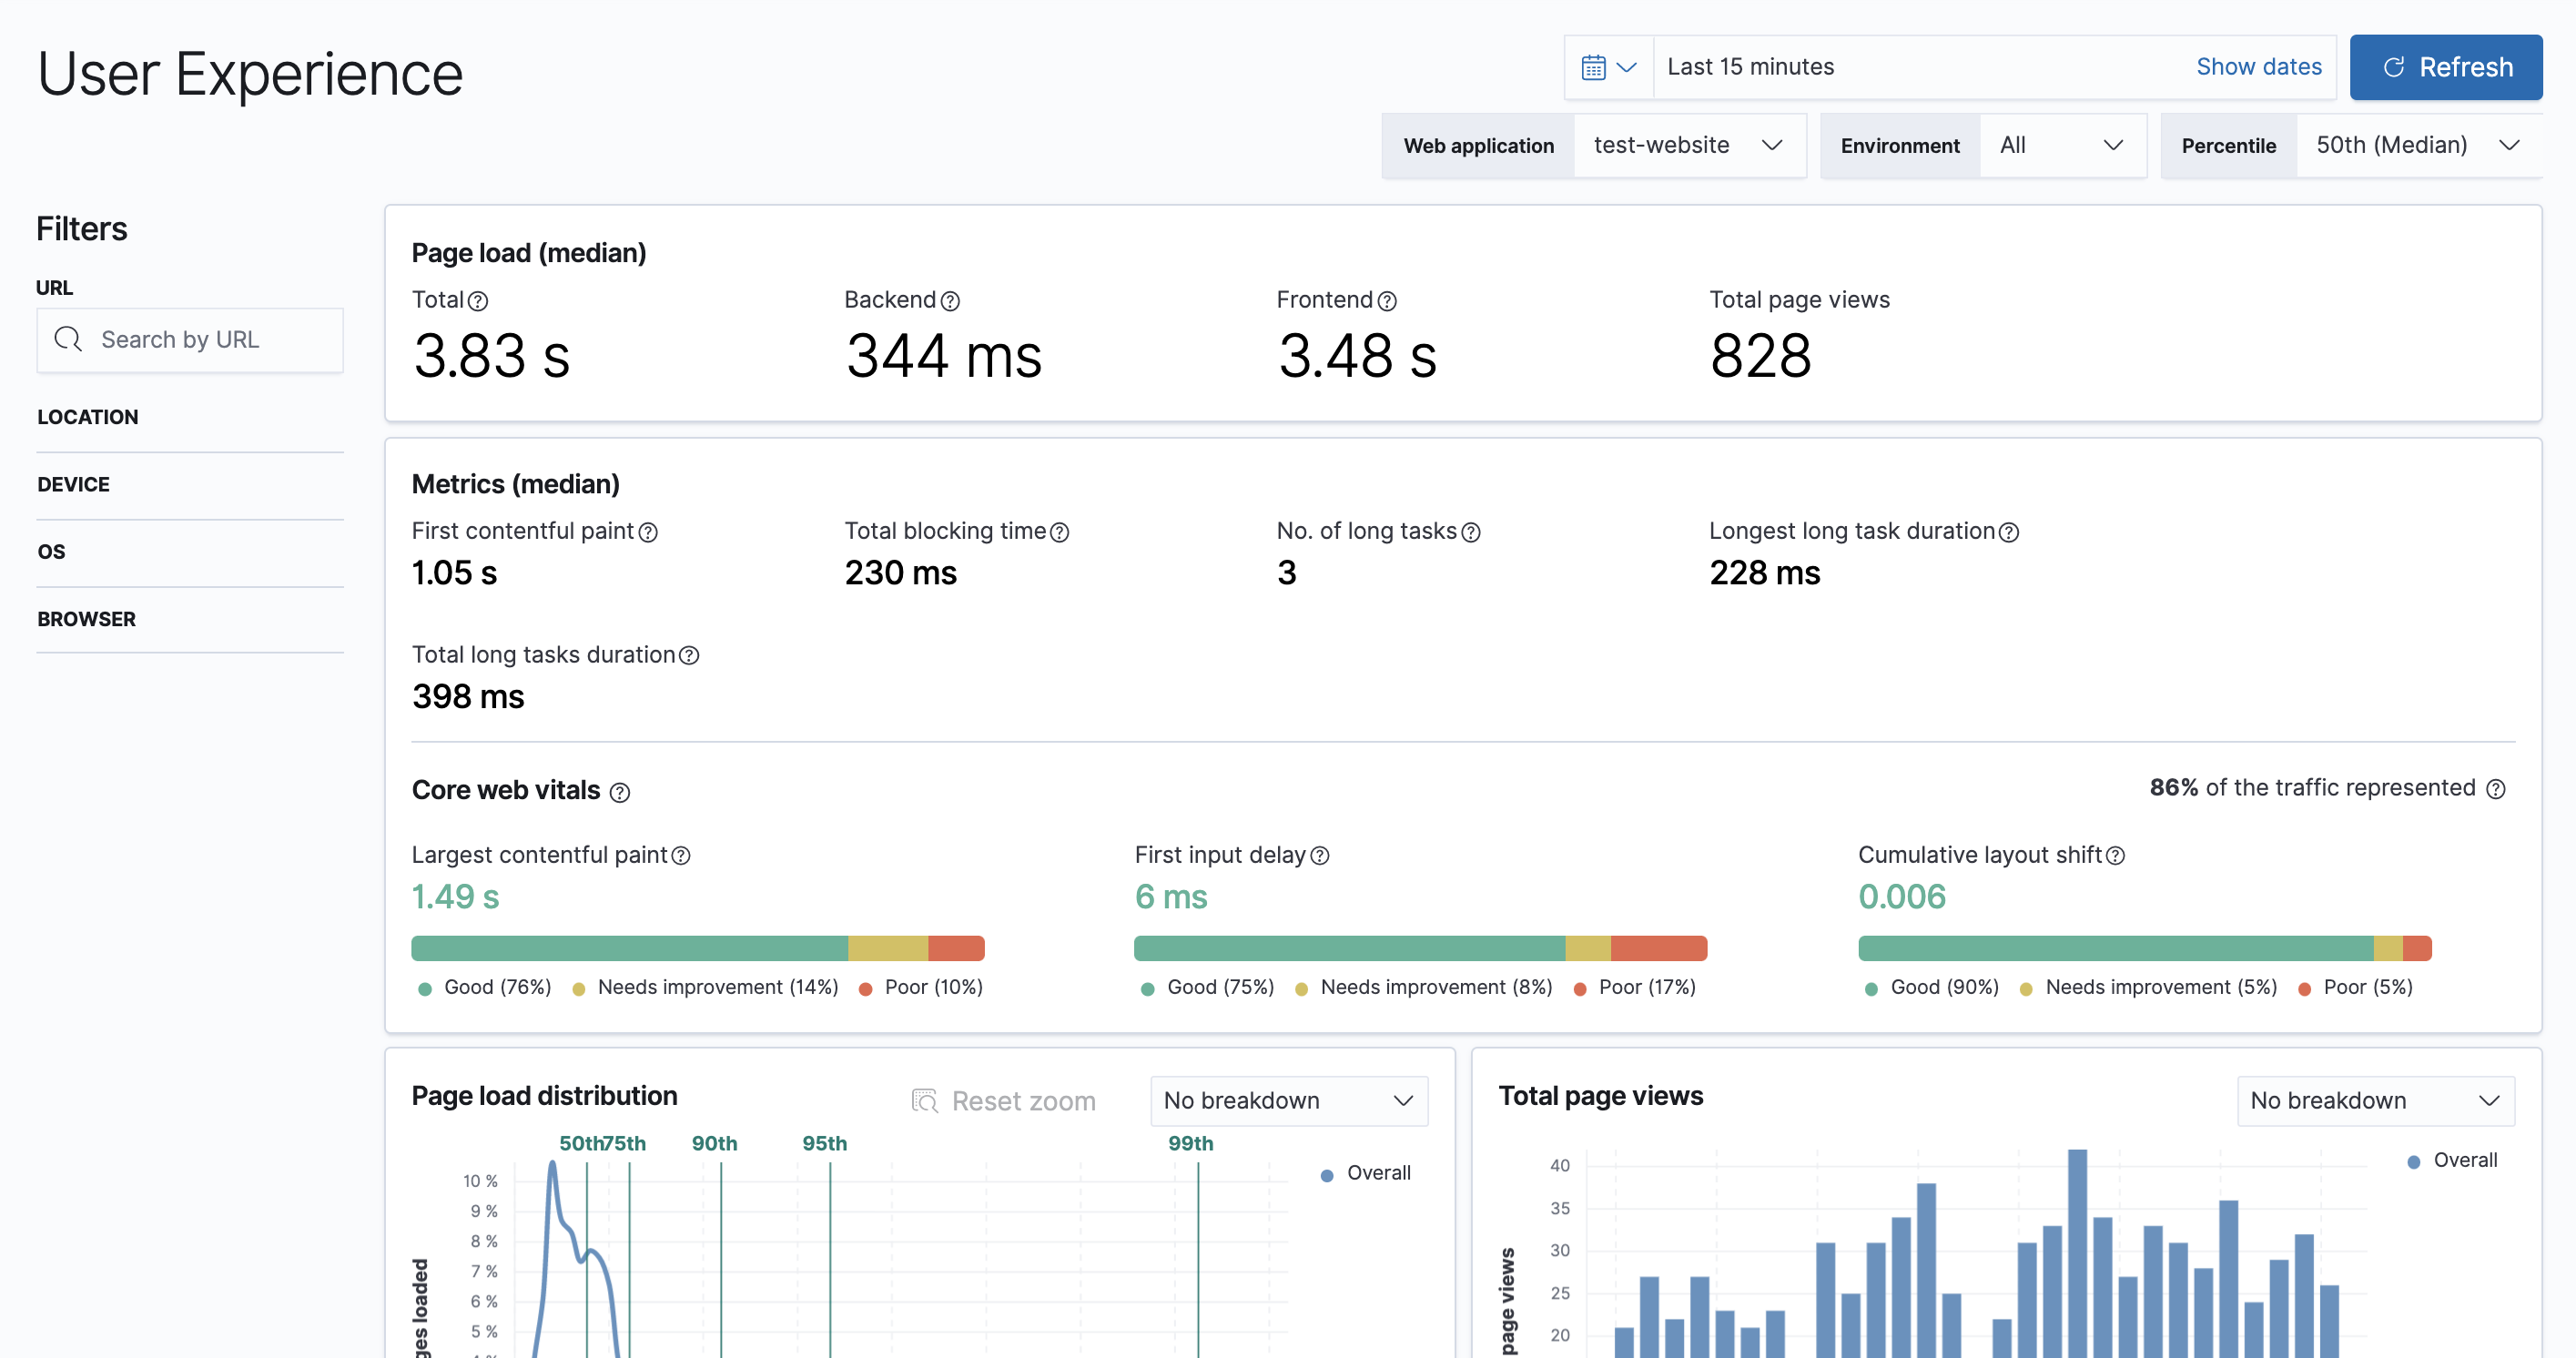
editIn 7.10, we are delighted to announce the release of User Experience monitoring capabilities featuring Google Core Web Vitals. These Core Web Vitals are based on metrics that score three crucial areas of user experience: loading performance, visual stability, and interactivity. Core Web Vitals are set to become the leading performance measurement in Google ranking factors, beginning in May 2021.
In addition to Core Web Vitals, we provide several other data points to help you understand how users are experiencing your website. You can filter and break down data to focus on the parts of your website or groups of users who are having a poor experience. For more information, see User experience.
Real-browser synthetics in Uptime (experimental)
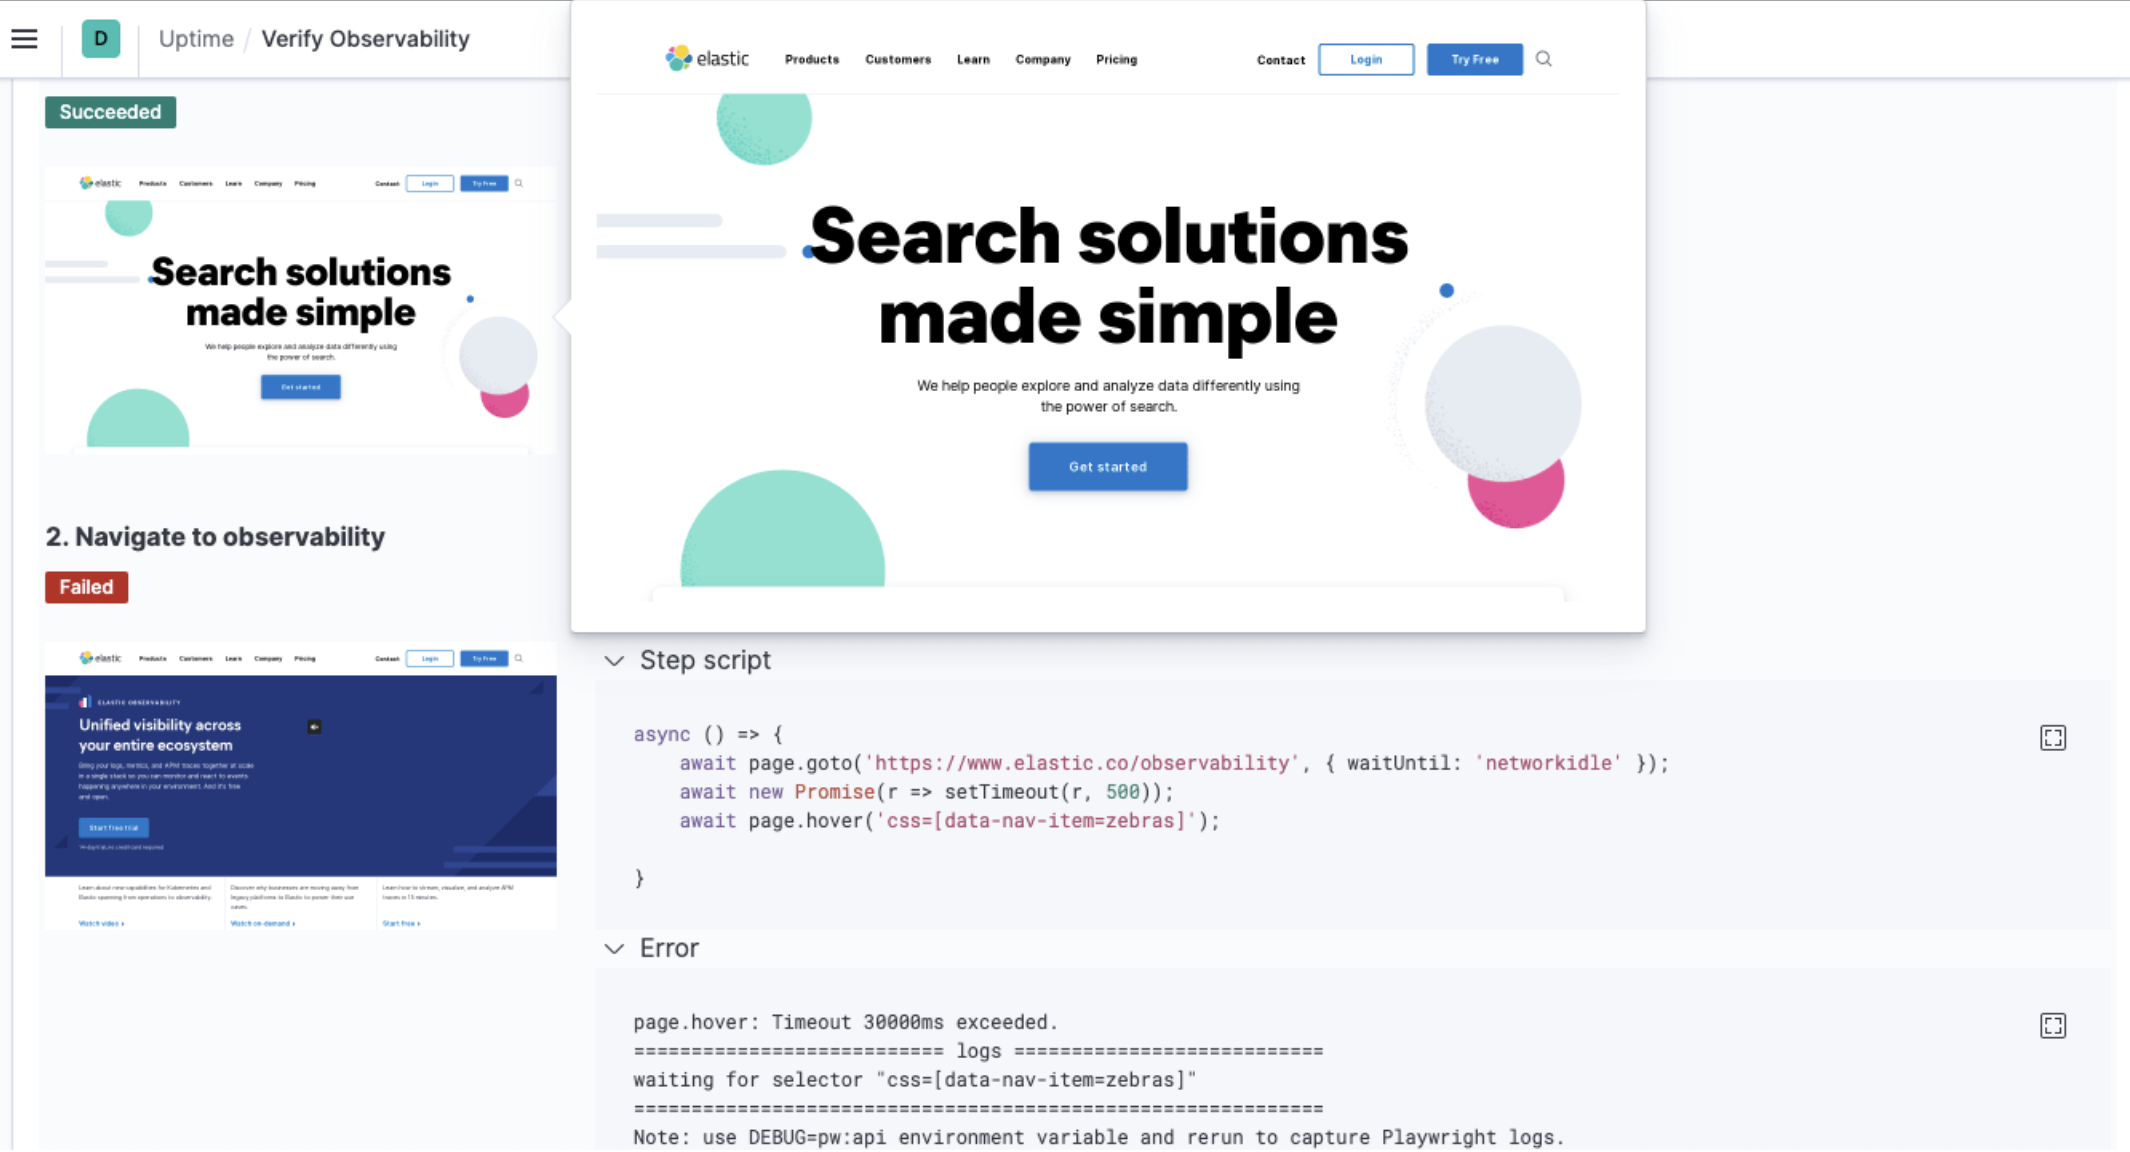
editIn 7.10, we are introducing scripted multi-step monitors to Uptime with our experimental synthetic real-browser based agent. Using simple Javascript, you can create new monitors that execute scripted journeys and interactions through critical functions of your website. You can also run the agent within your internal networks without the need to open holes in your firewalls—perfect for monitoring critical internal apps.
Our real browser synthetic agent has the same resource-based pricing as before, so no need for the per test run pricing offered by most vendors on the market.
We have also greatly improved the developer experience. With our new scripted agent, you can run tests locally and debug using Chrome dev tools. You can now write your synthetic tests alongside your web app, test locally, and then promote those tests as code alongside your production pushes—no more gaps between dev and ops. For more information, see Synthetics monitoring.
Fleet (beta 2)
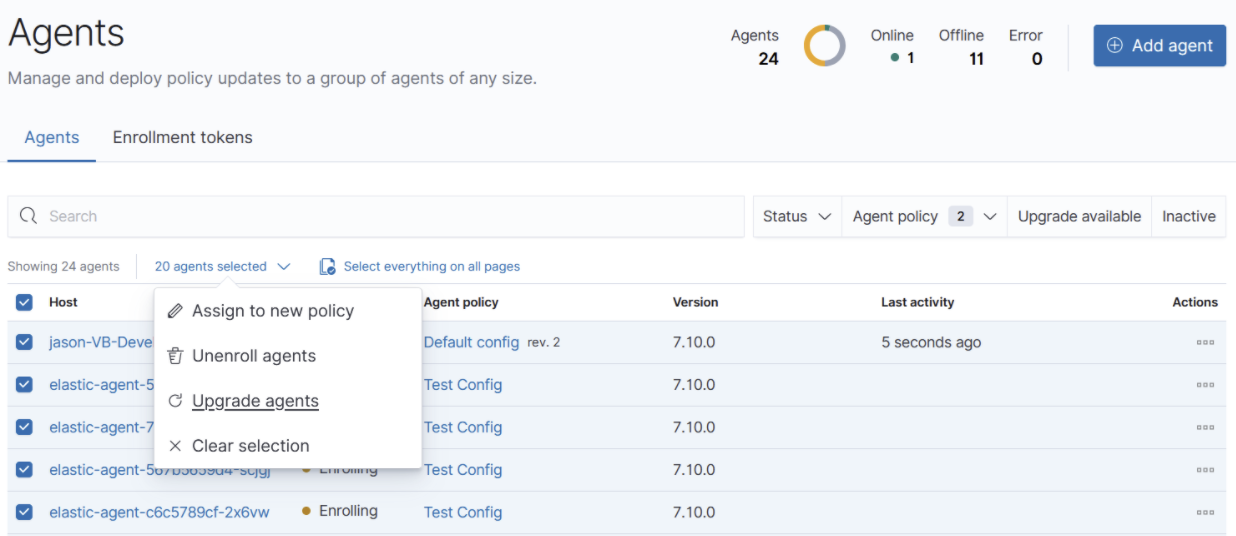
editAs of 7.10, we are releasing our second beta version of Fleet and Elastic Agent. This release includes the new capability to upgrade Elastic Agent binaries inside Fleet. You can view and select the agents that are out of date, and then select Upgrade agents to trigger the agent to download, install, and run the new version.
This approach simplifies the process of keeping your agents up to date. It also saves you time as you don’t need to manage an upgrade process using third-party tools or processes. As part of this new capability, we have released a new installer as a Basic tier feature that configures a service to start the agent on system reboot. This new installer ensures the agent binary upgrades in Fleet. It’s an experimental feature, so we’re looking forward to your feedback as you test it out.
We are also releasing new features that enable you to apply actions to multiple agents. Select any combination of agents to assign a new policy to, unenroll agents, or upgrade agent binaries. This is useful for progressive or canary deployments of agent upgrades, migrating hosts to new policies in bulk, and much more. To give you more selective control over large numbers of agents, we are releasing these features in the Gold tier.
Along with all of these new features, you can now:
- Configure a proxy in Fleet to access the internet. This feature is crucial if you run Fleet inside a secure network and you need access to the Elastic Package Registry.
- Provide additional configuration for the Elasticsearch output, such as custom certificates.
- Increase the recommended number of agents per Kibana node from 1000 to 8000.
- Configure inputs with variables and conditions, which is a foundation for our future work on autodiscovery for Kubernetes and Docker.
Anomaly detection for hosts and Kubernetes pods
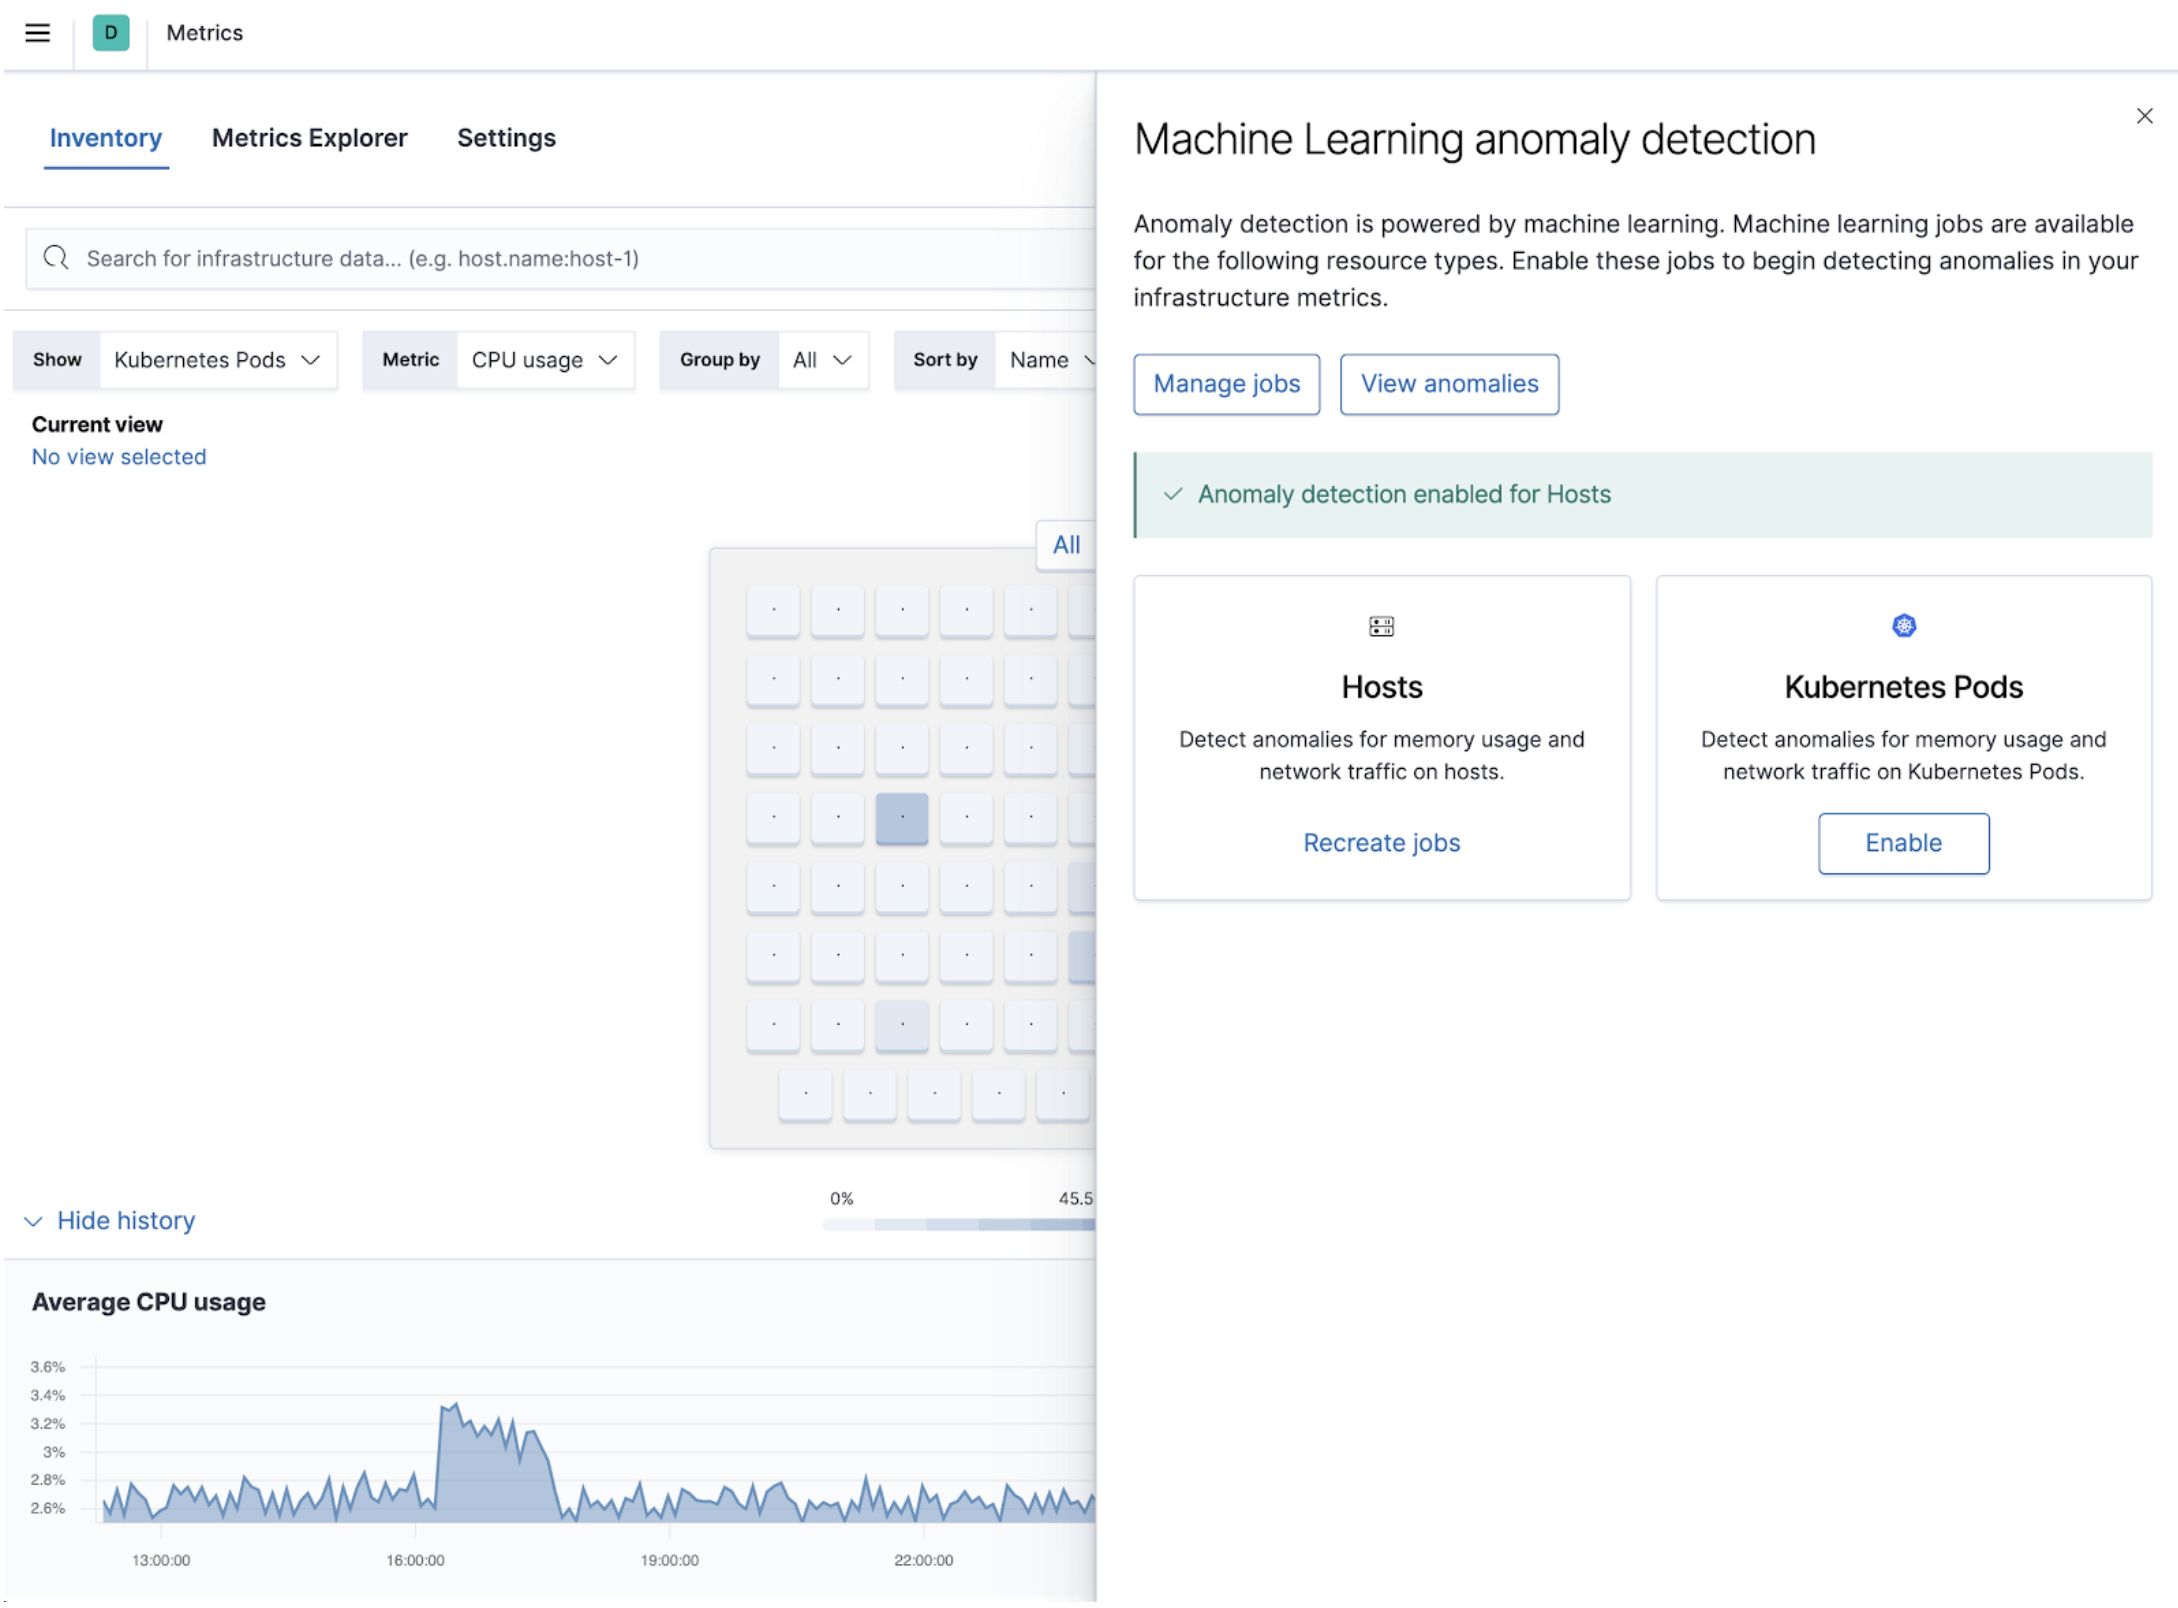
editAn essential piece of a modern monitoring solution is the ability to auto-detect any abnormal behavior in your infrastructure before something bad happens. As of 7.10, we have added out of the box anomaly detection that automatically detects if a host or a Kubernetes pod is experiencing unusual symptoms—for example, spiking CPU, anomalous outbound traffic, memory leaks, etc. This is to help your infrastructure ops teams monitor their fleet of resources, and spot failing resources with minimal manual effort.
The anomalies detected by the machine learning jobs are displayed in the infrastructure map view in the Metrics app. This makes it easier for you to spot a troubled container or namespace in a sea of resources. You can view when resources are behaving unusually versus when a metric is just high or low on an absolute scale. For example, when the CPU suddenly spikes to 50%, it may be a more worrisome signal than when the maximum CPU is at 85%.
We have also included a historical timeline in the Metrics app to help you see the full alert and anomaly timeline across your resource pool, making it easy to spot temporal trends and patterns during an incident investigation. You can use the timeline to explore the state of your infrastructure at the point in time the incident occurred. For more information, see Inspect metric anomalies.
Multi-cloud billing for AWS, Azure, and Google Cloud
editElastic already provides integrations for AWS, Azure, and Google Cloud that can be used to monitor any cloud service. As of 7.10, we have extended these cloud integrations to include billing information. You can monitor your cost and estimated charges across the cloud providers without having to switch between different cloud consoles or going through other data points.
Use the Elastic integrations for AWS, Azure, and Google Cloud to automatically collect billing information, send it to Elasticsearch, and display it in Kibana. All the integrations come with dashboards that visualize the billing and usage metrics. To see how your operations correlate with the incurred cost, you can reuse the visualizations by placing them side by side with your other operational data points.
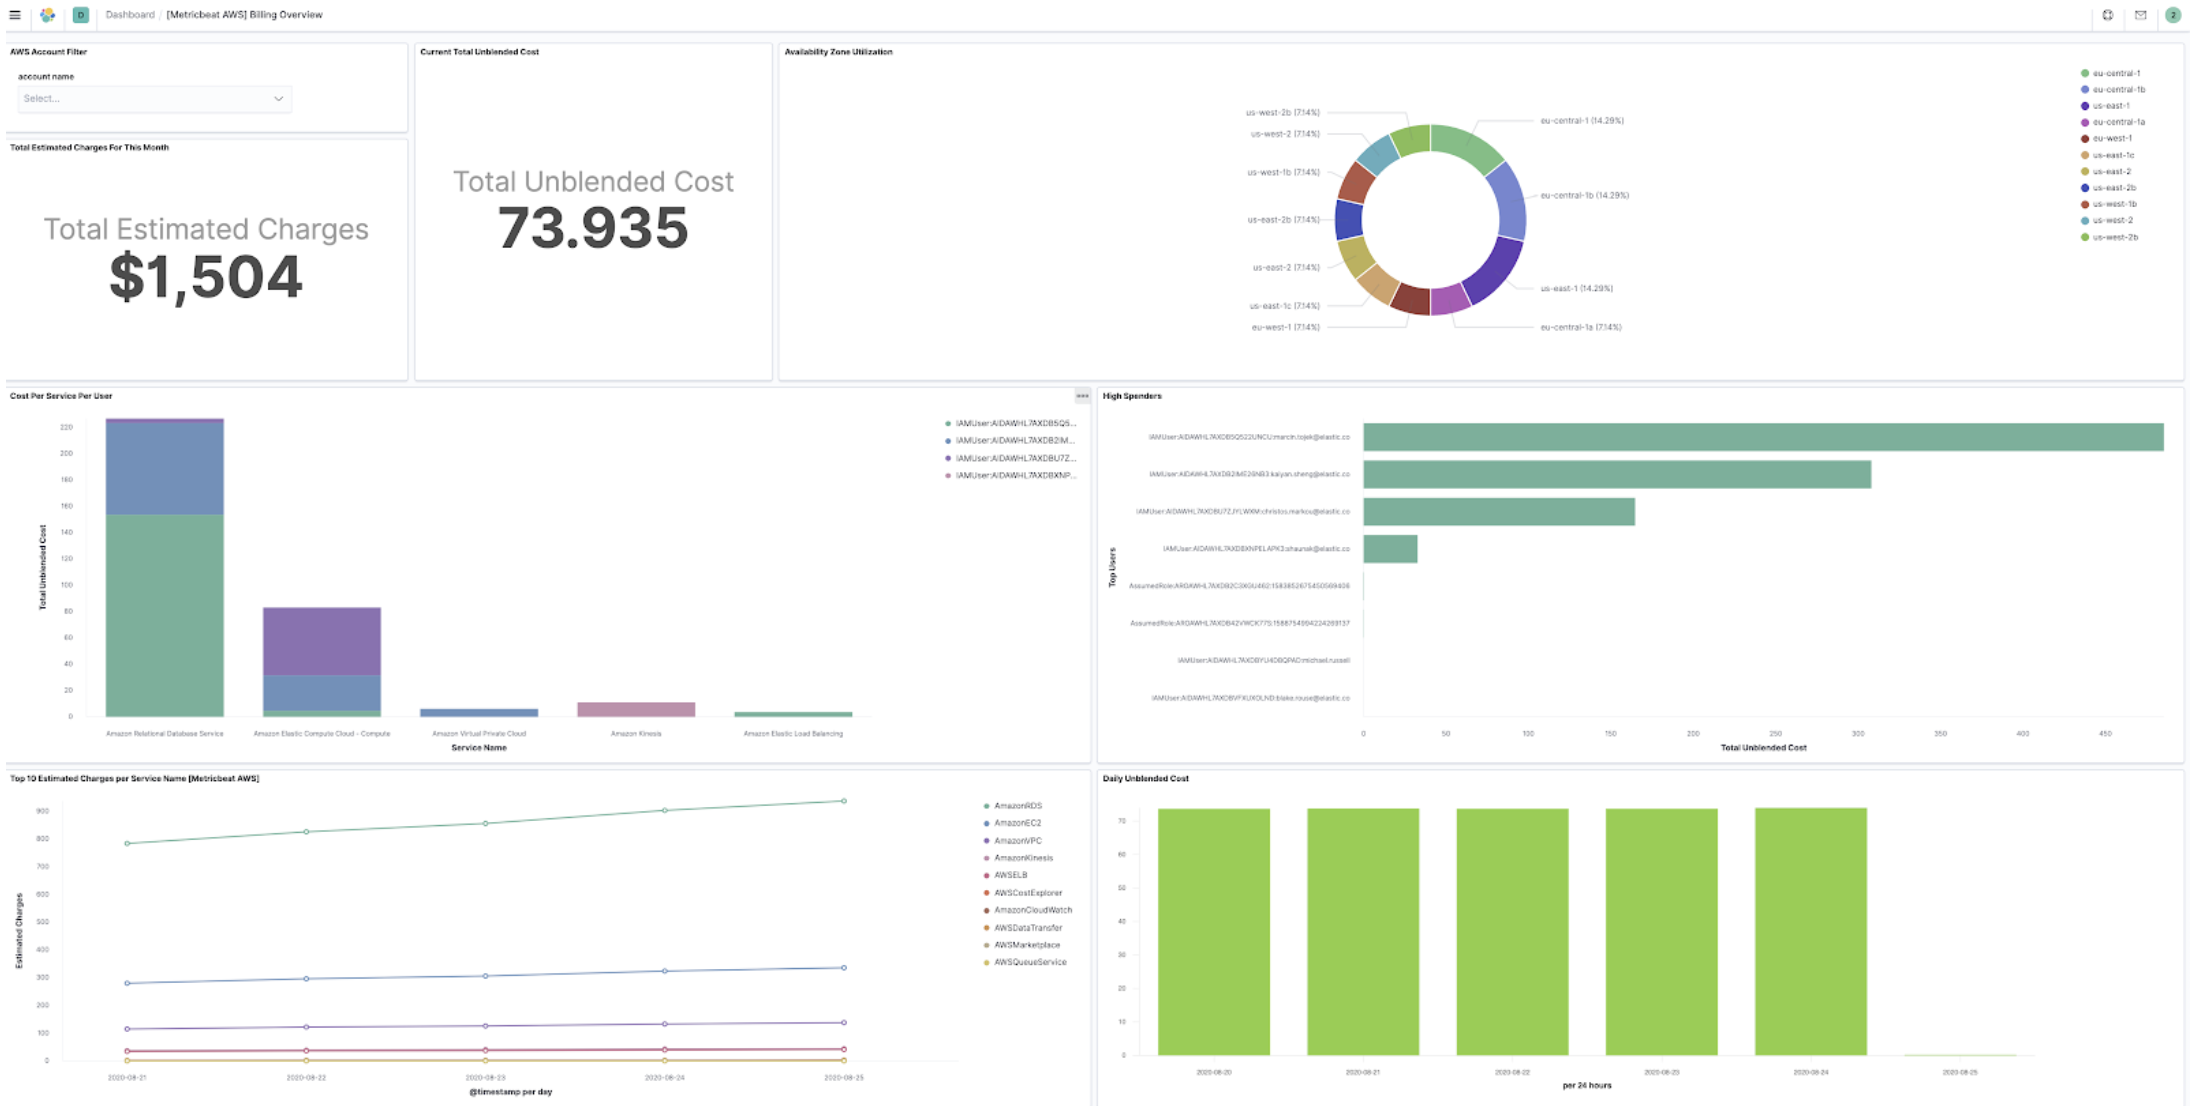
How is the data collected?
editFor AWS, the billing and usage metrics are collected from both CloudWatch and Cost Explorer. CloudWatch gives an estimated charge for each month, and Cost Explorer gives accurate daily expenses instead of an estimated value. For Azure, the data is collected from cost management. And for Google Cloud, the detailed billing data is exported to a specified BigQuery dataset before it is scraped for detailed analysis.
Logs ratio alerting
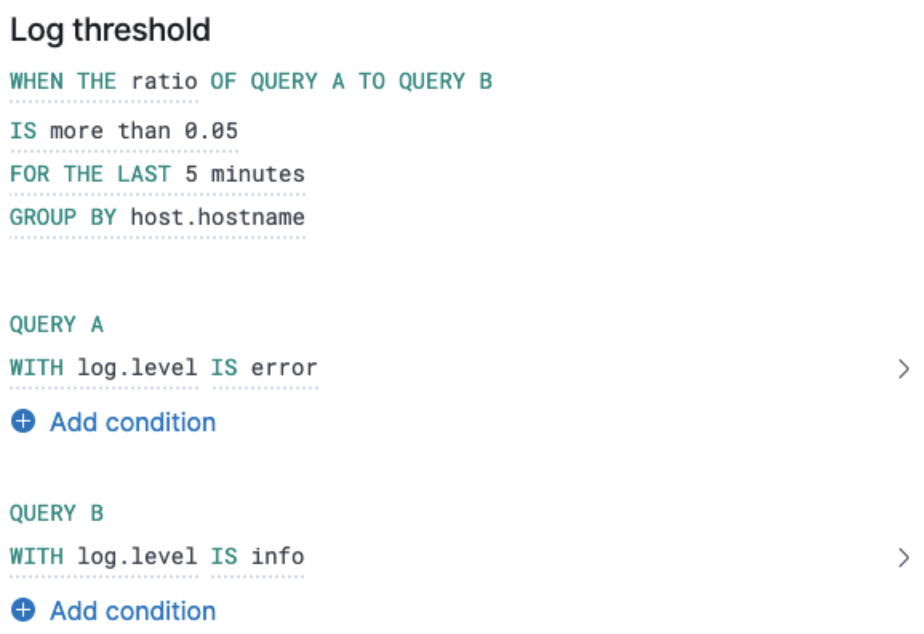
editWhen creating threshold-based alerts, you may want to weigh them by another metric. To achieve this, we have
introduced logs ratio alerting in the Logs app. For example, when detecting a genuine web server timeout problem
(504 gateway timeout errors), you can weigh them with the number of requests it handles. To help achieve this, you
create a ratio threshold like Ratio between error code 504 to the overall number of response codes is higher than a threshold.
For more information, see Alerting.
Logs alert chart previews
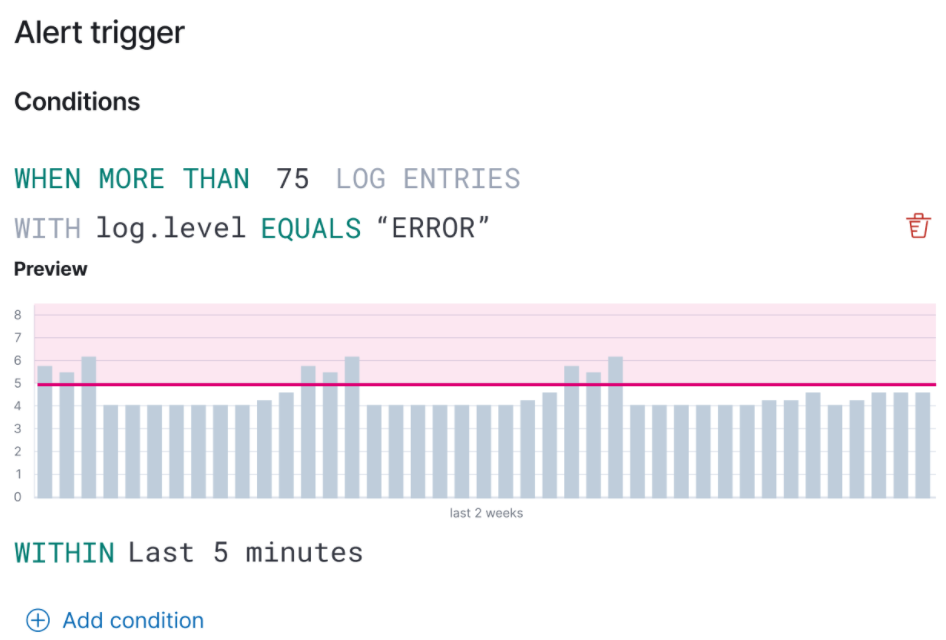
editWe have also included an alert chart preview. When creating a threshold alert, you want to set a value that triggers when it detects an outlier. The alert chart preview enables you to visualize the threshold overlaid on top of historical data. For more information, see Alerting.
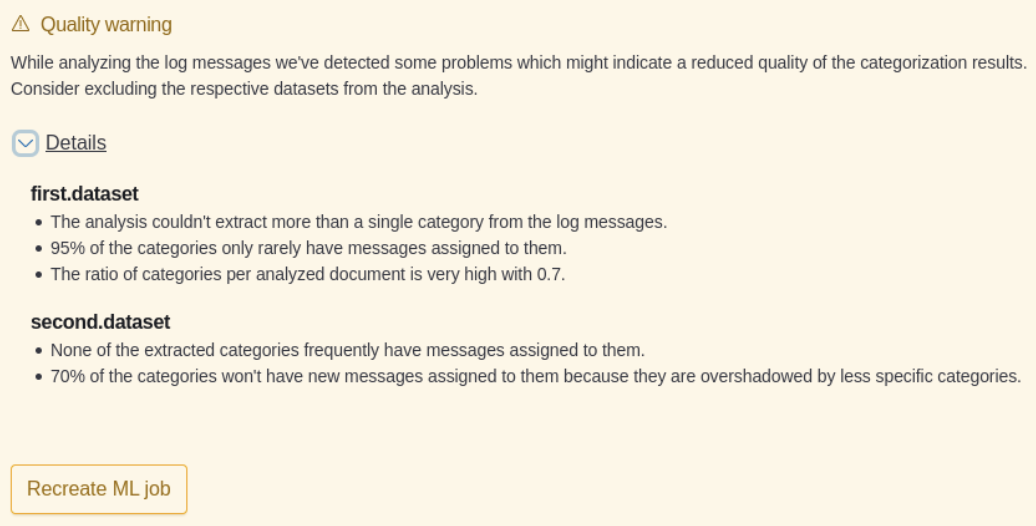
Log categorization: quality of datasets warnings
editIn 7.6.0, we introduced log categorization, a powerful tool that works well with machine-generated unstructured data and not as much for free-form text. In 7.10, we have added the ability to identify inadequate datasets for categorization. On the Categories page of the Logs app, a warning is displayed describing the specific dataset that is a misfit for categorization and provides a link to configure the job for filtering that dataset.
PCF logs integration (GA)
editIn 7.7.0 we announced the beta release of the Pivotal Cloud Foundry (PCF) integration, which included an out-of-the-box PCF operator and developer observability. As of 7.10, we have included PCF logs integration. This follows working closely with customers to test functional and scaling aspects of PCF observability.
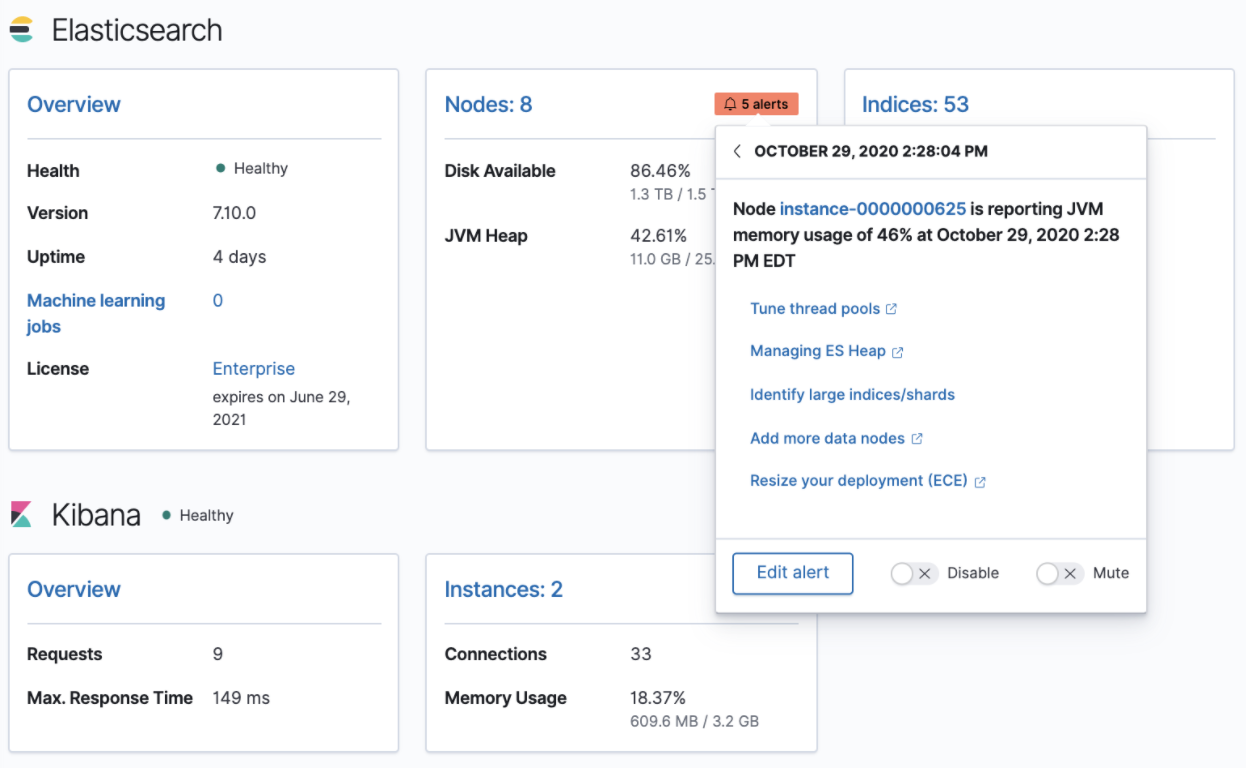
Stack monitoring alerts
editThe Elastic Stack monitoring features provide a way to keep a pulse on the health and performance of your Elasticsearch cluster. In previous releases, you could use Watcher and create custom alerts on the collected monitoring data.
As of 7.10, we have added out-of-the-box Kibana alerts to notify you of potential issues in the Elastic Stack. Within Kibana, the CPU threshold, Disk Usage, Memory Usage (JVM), and Missing monitoring data alerts are preconfigured and available for selection. The alerts are also visible alongside your existing Watcher cluster alerts in the Stack monitoring UI.
Each alert is preconfigured based on the best practices recommended by Elastic. However, you can Enter setup mode and tailor them to meet your specific needs, including alert conditions and actions. Stack monitoring not only helps you create the alerts but also provides suggestions for investigative workflows to make this a powerful debugging tool.
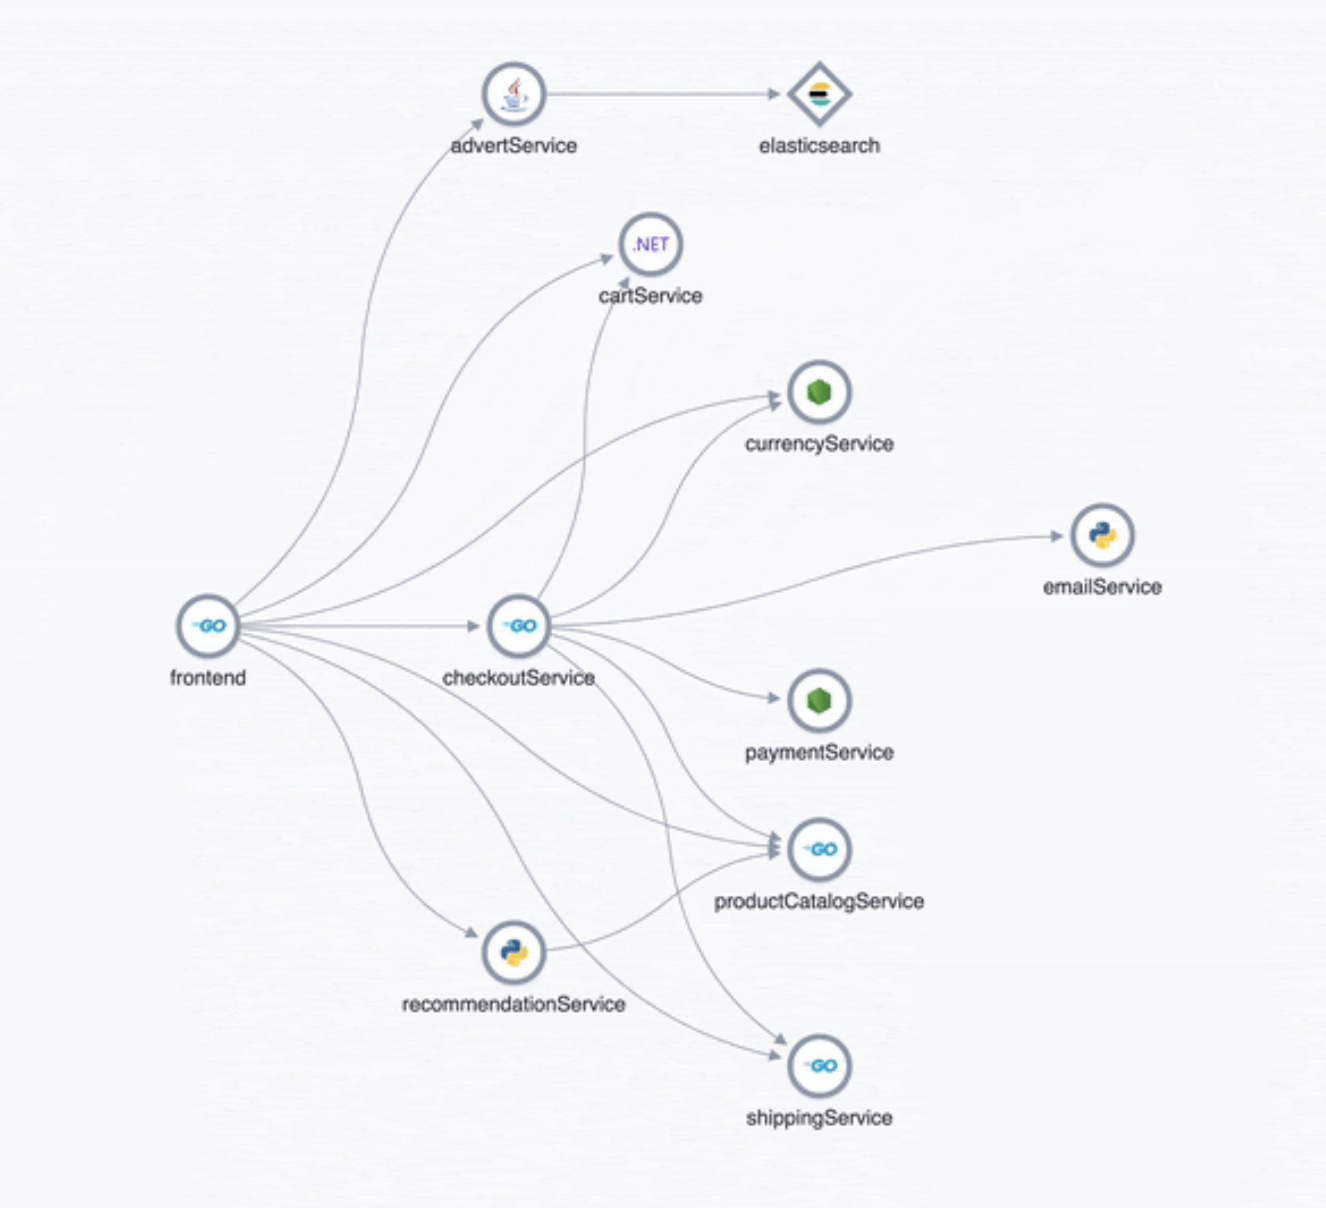
APM service maps
editIn 7.7.0, we introduced the service maps functionality into APM, and since then we have added data to make the maps more actionable. We added health indicators to make it easier for you to determine the health of your instrumented services and filtering to enable you to slice these maps based on your environments.
As of 7.10, we are delighted to announce the general availability of service maps. This release provides a new layout to the maps. Curved connectors make it easier to visualize the connections between services.
Also, you can drag nodes into a structure that is easier for you to understand. To minimize the noise on the maps and make them easier to navigate, multiple external service calls are automatically collapsed into groups to display the relationships between sets of services and external connections.
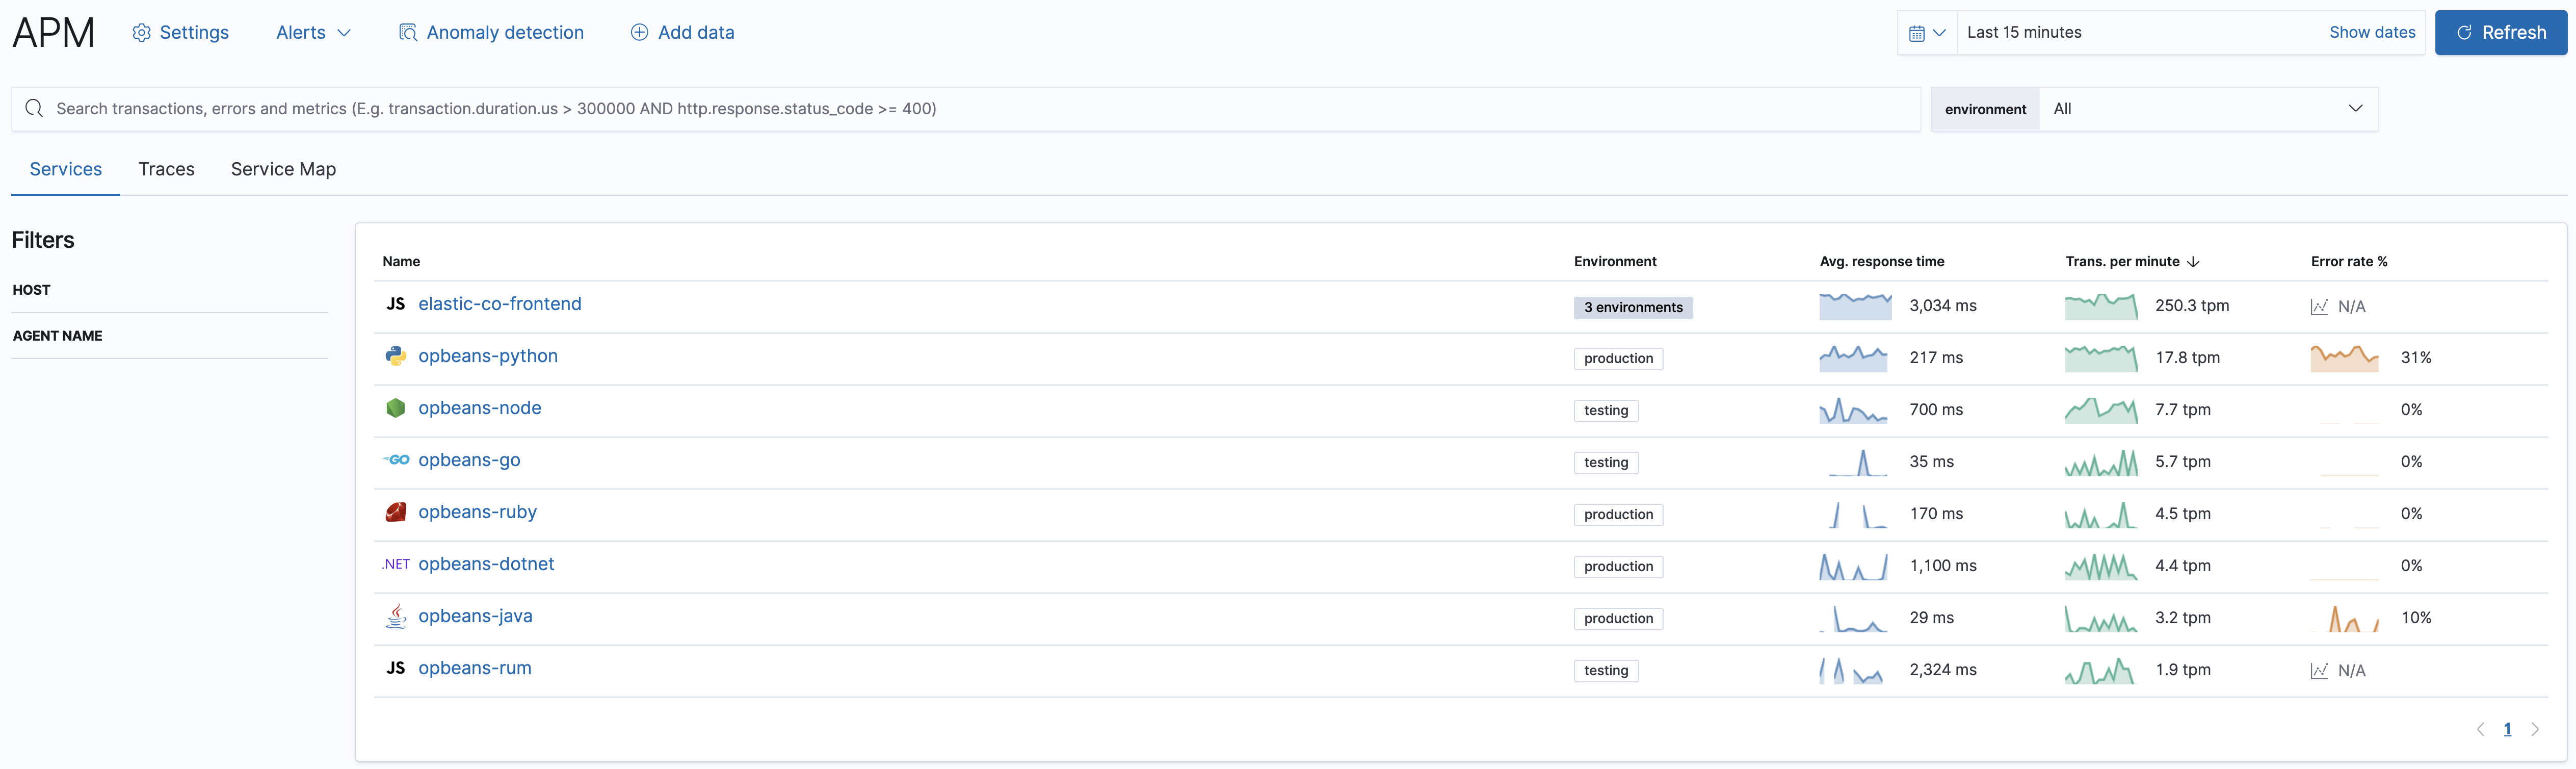
Service inventory view with sparkline charts
editIn 7.10, we have added health indicators to the service inventory view. Powered by the APM machine learning integration, these health indicators help spot services that need attention quickly. In addition to this, we have added a sparkline chart to the inventory view to help you understand the historical performance of your service.
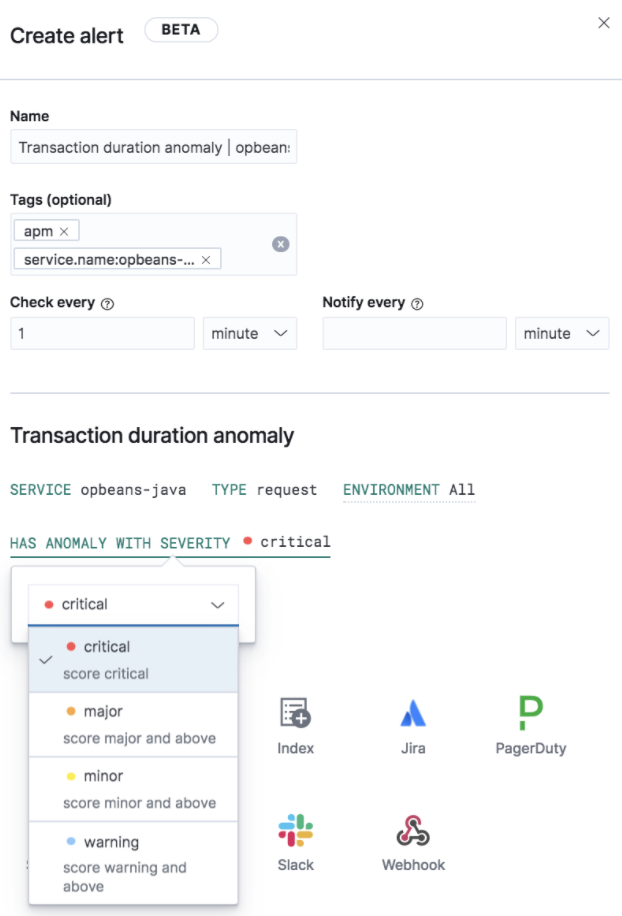
Anomaly detection alerts
editIn 7.10, we have made the APM machine learning integration more actionable by adding the capability to create alerts on this data. While static thresholds are great for creating basic alerts, they can potentially cause a lot of noise when the underlying data is expected to be bursty. The new alert based on anomaly detection enables you to create alerts that take bursty or seasonal traffic patterns into account and notify a user only when true anomalies are detected.
APM PHP agent (beta)
editWe are excited to introduce the PHP agent as a beta to Elastic APM. With this new agent, you get instant visibility into the performance of your PHP applications. The addition of the PHP agent now extends our support of all the major application development languages, which includes Java, .NET, GO, Python, Ruby, and Javascript.
APM Java agent: Micrometer integration
editWith the Java agent release 1.18.0, we have added support for automatic metrics collection from Micrometer. The metrics include cache statistics, thread pools, page hits, and also your custom business-related metrics, such as revenue which you can view in Kibana. For information on how to set up and start collecting these metrics, see our Micrometer documentation.
OpenTelemetry metrics intake
editWe extended the Elastic exporter for OpenTelemetry Collector to collect metrics and export them to the APM server. The Elastic OpenTelemetry exporter now supports both traces and metrics collection. OpenTelemetry metrics help to monitor business KPIs and technical components that are not auto instrumented by the OpenTelemetry SDK.
Capturing insightful business metrics on applications with OpenTelemetry looks like this:
// initialize metric
Meter meter = OpenTelemetry.getGlobalMeter("my-frontend");
DoubleCounter orderValueCounter = meter.doubleCounterBuilder("order_value").build();

public void createOrder(HttpServletRequest request) {

   // create order in the database
   ...
   // increment business metrics for monitoring
   orderValueCounter.add(orderPrice);
}
The collected metrics are stored in the apm-\*-metric* indices.
Note that the DoubleValueRecorder and LongValueRecorder metrics are not yet supported.
Disk spooling for Beats (beta)
editIn 7.10, we have included the beta release of a new disk queue that stores the pending events on disk rather than the main memory. This enables Beats to queue a larger number of events than what is possible with the memory queue, and also to save events when a Beat or device restarts. It provides increased availability and reliability for cases like transient errors of the output; for example, when Elasticsearch is not available for some time.
Enhanced overview page
editIn 7.10, the Observability overview page has been enhanced to include the User Experience chart.