User Experience
editUser Experience
editUser Experience provides a way to quantify and analyze the perceived performance of your web application. Unlike testing environments, User Experience data reflects real-world user experiences. Drill down further by looking at data by URL, operating system, browser, and location — all of which can impact how your application performs on end-user machines.
Powered by the APM Real user monitoring (RUM) agent, all it takes is a few lines of code to begin surfacing key user experience metrics.
Why is User Experience important?
editSearch engines are placing increasing importance on user experience when organically ranking websites. Elastic makes it easy to view your website data in the context of Google Core Web Vitals — metrics that score three key areas of user experience: loading performance, visual stability, and interactivity. These Core Web Vitals are set to become the main performance measurement in Google ranking factors. If you’re a content-based site that wants to appear in the “Top Stories” section of Google search results, you must have good Core Web Vitals.
How does User Experience work?
editUser Experience metrics are powered by the APM Real User Monitoring (RUM) agent. The RUM agent uses browser timing APIs, like Navigation Timing, Resource Timing, Paint Timing, and User Timing, to capture user experience metrics every time a user hits one of your pages. This data is stored in Elasticsearch, where it can be visualized using Kibana.
The RUM agent can be installed as a dependency to your application, or with just a few lines of JavaScript. It only takes a few minutes to get started.
User Experience in Kibana
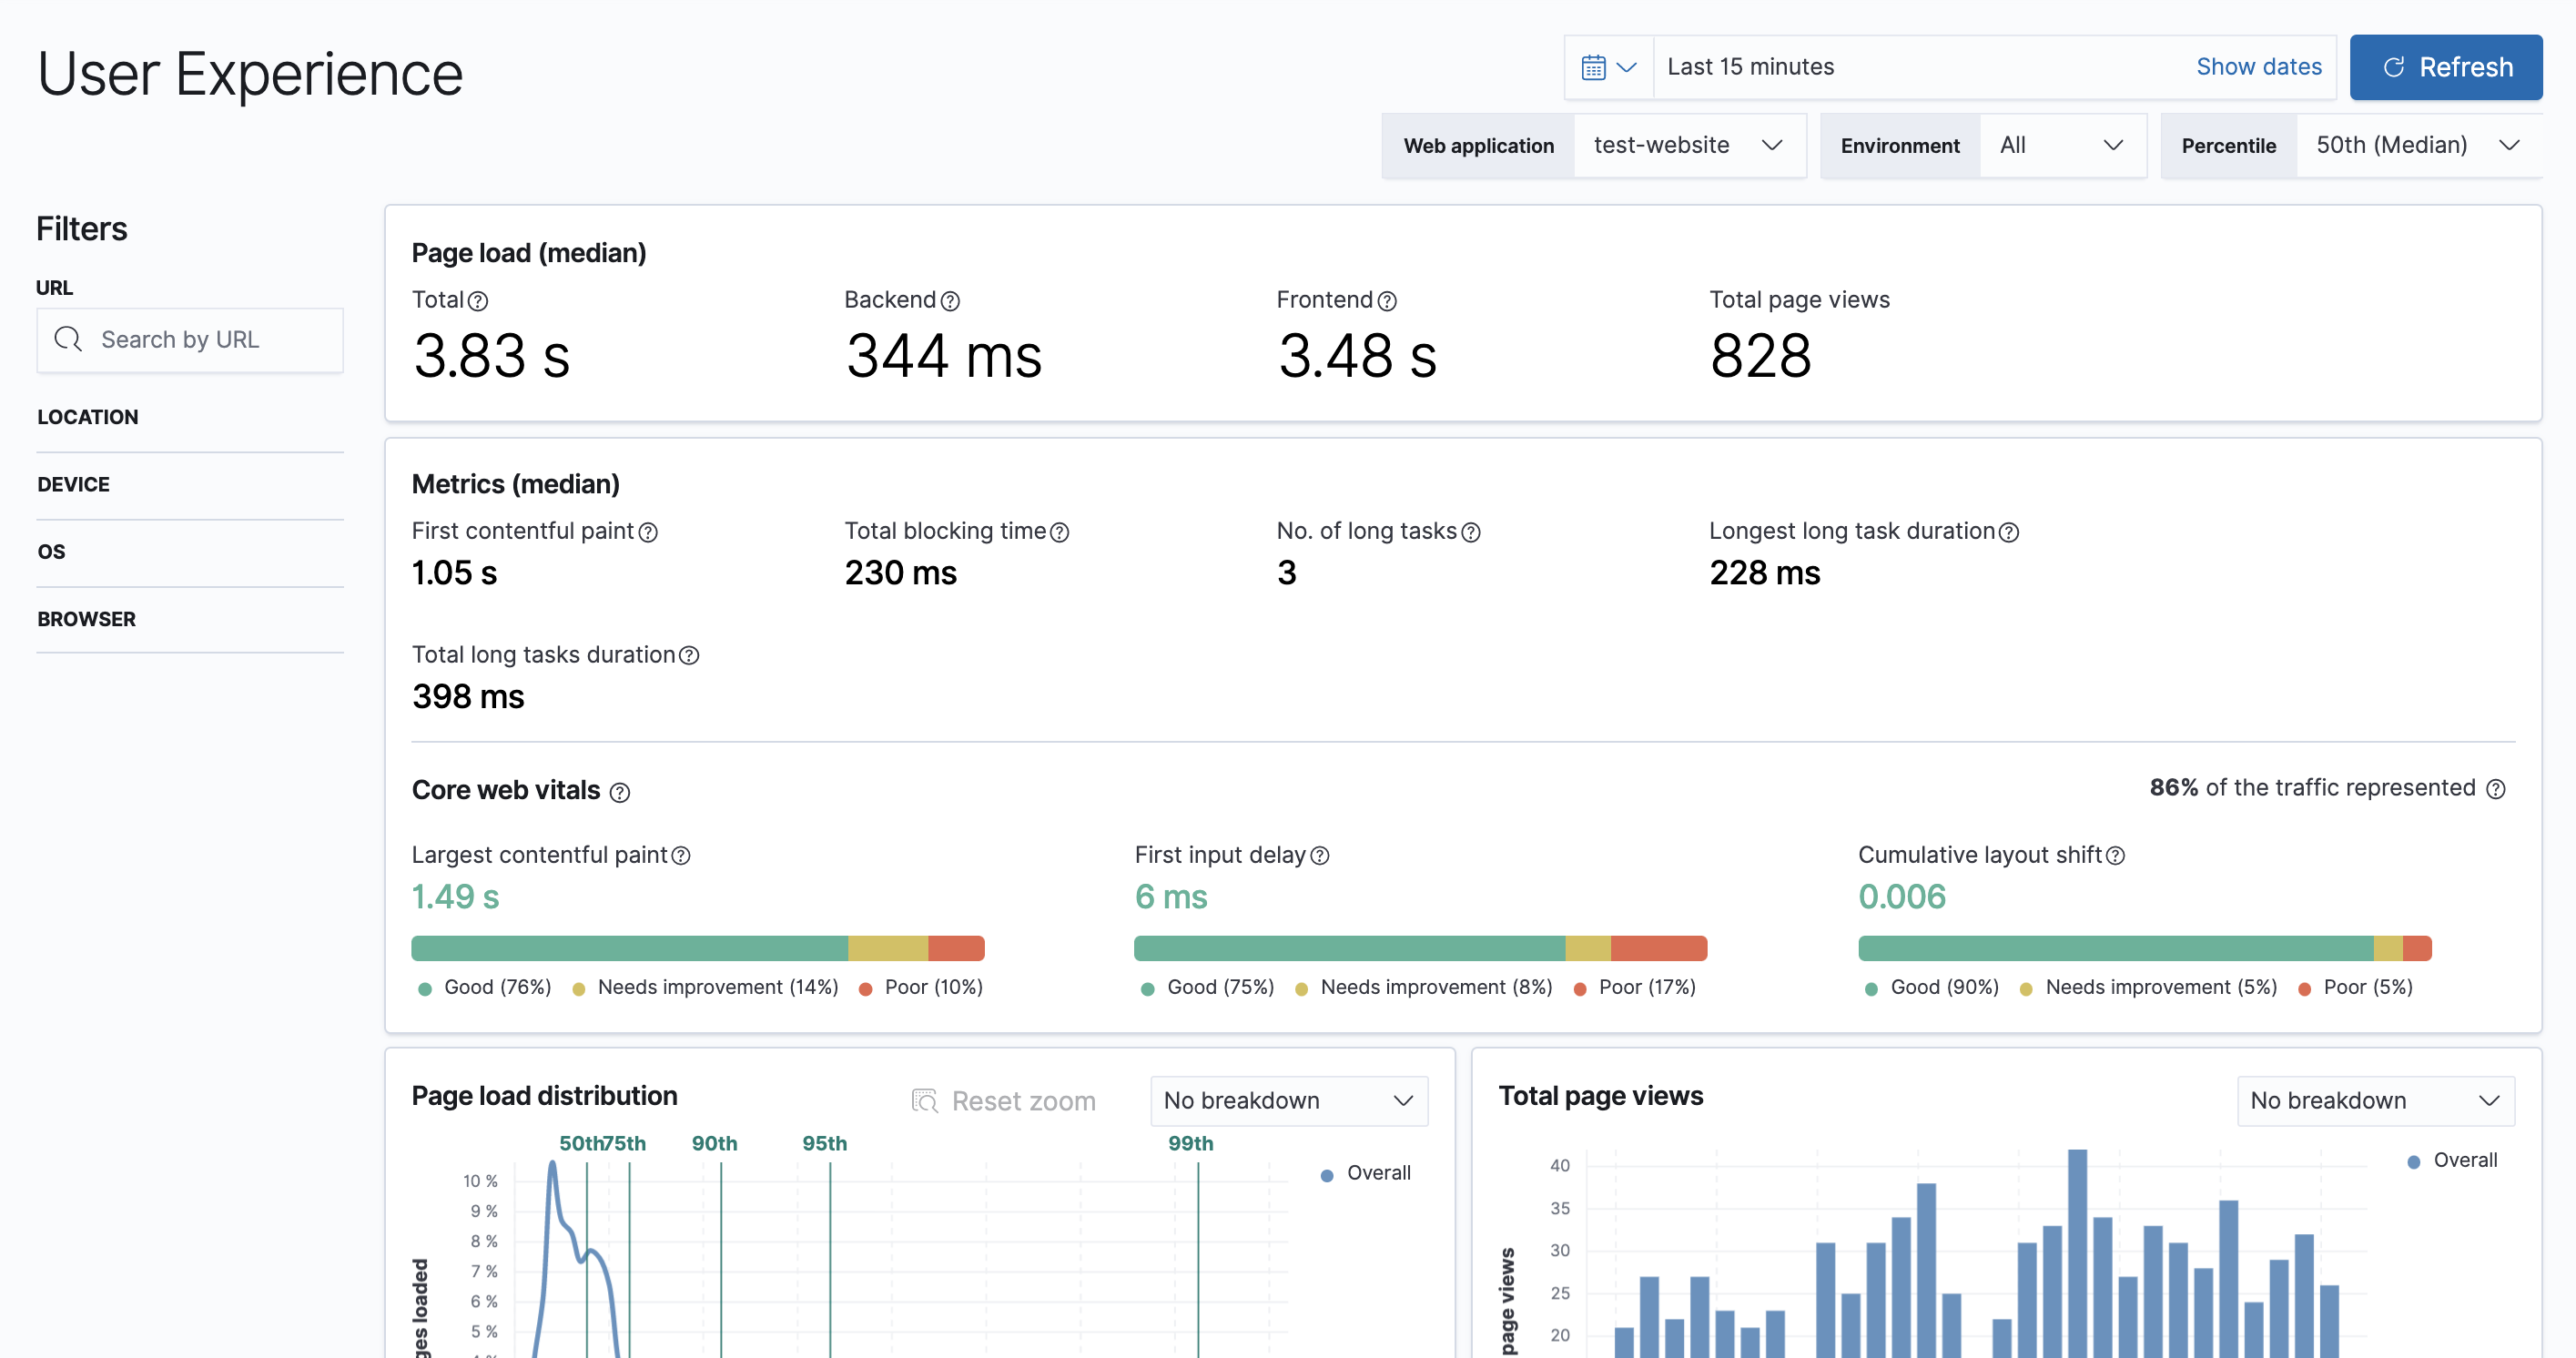
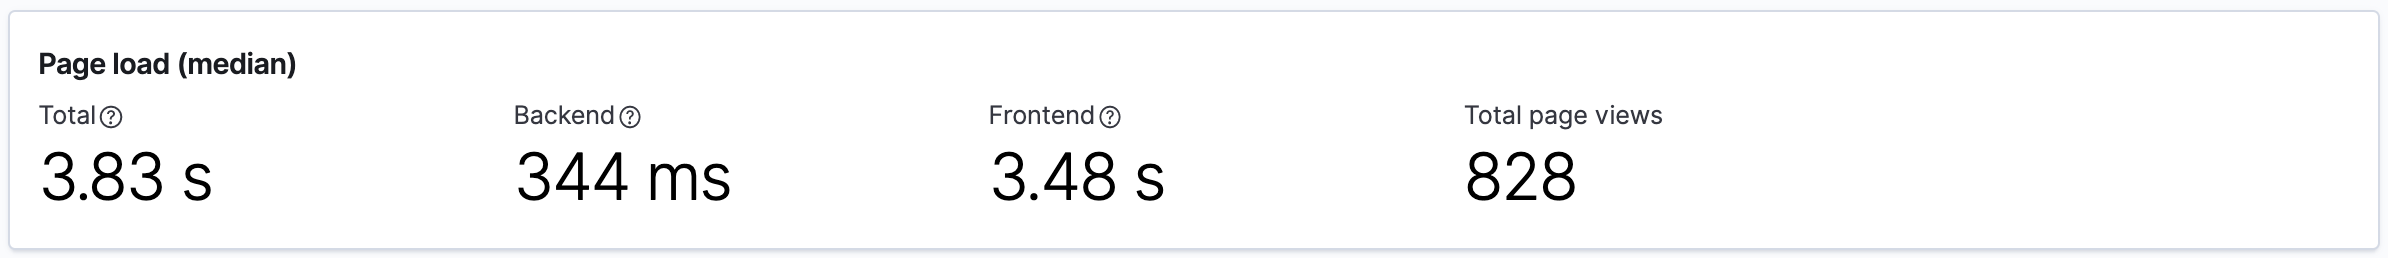
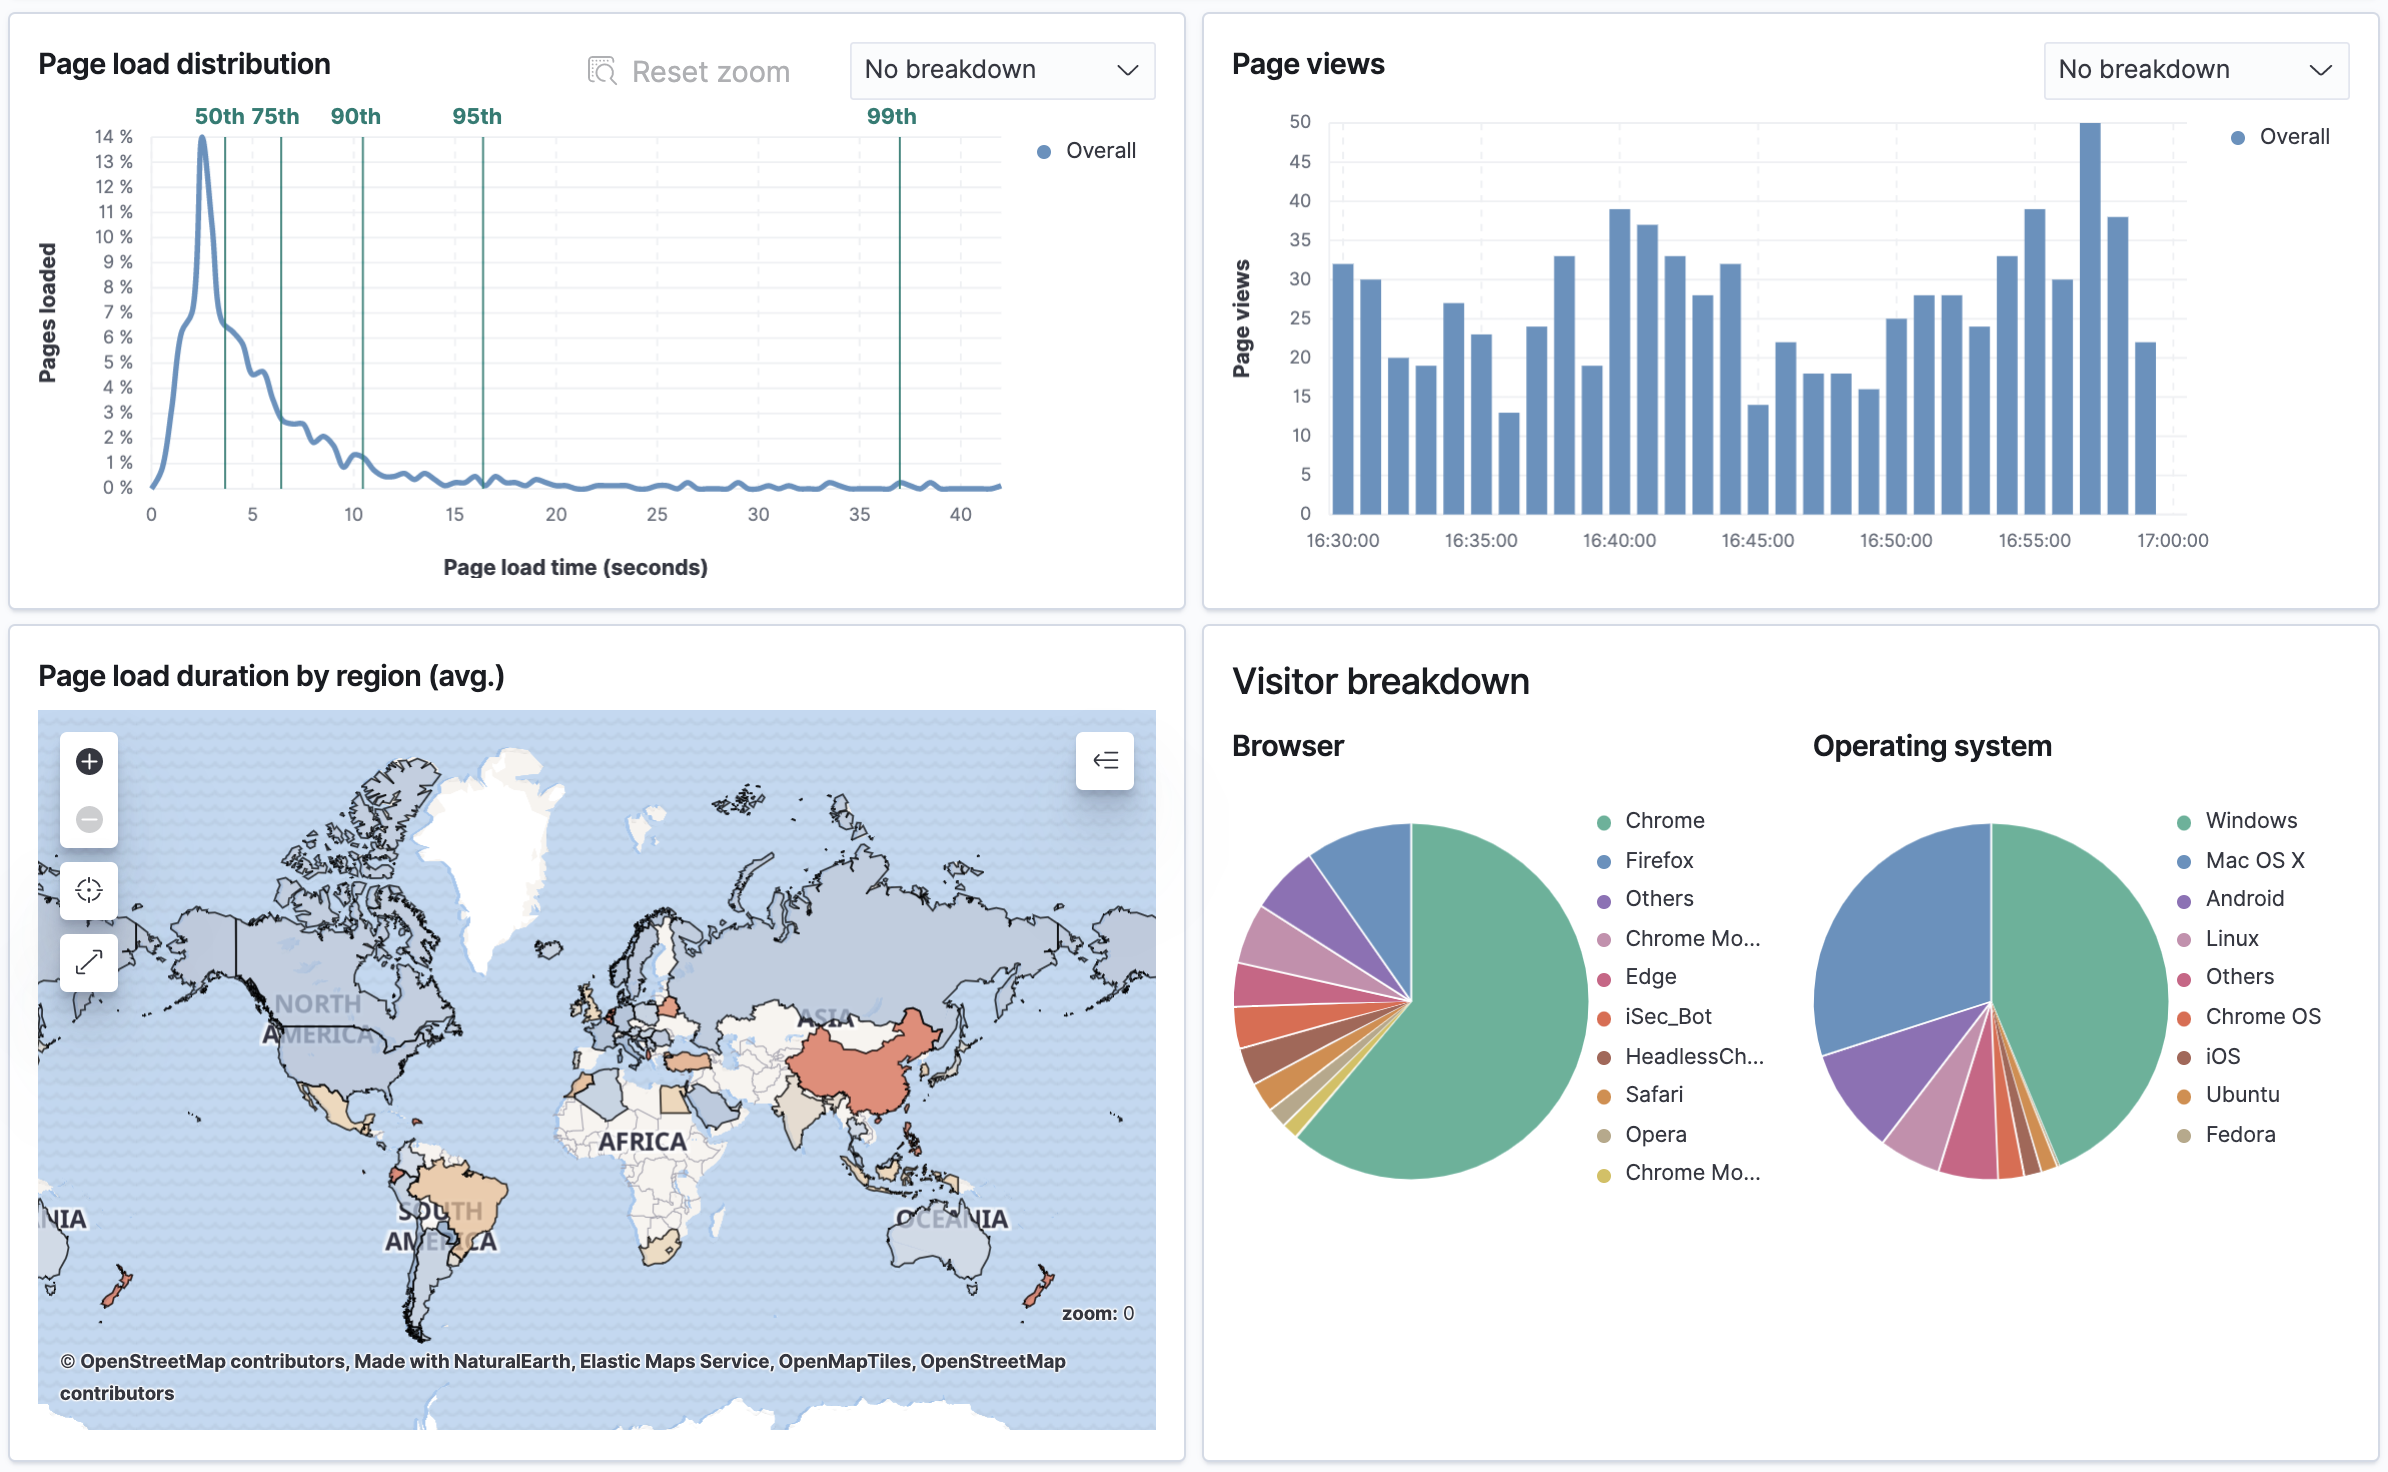
editPage load duration
editThis high-level overview is your analysis starting point and answers questions like: How long is my server taking to respond to requests? How much time is spent parsing and painting that content? How many page views has my site received?
You won’t be able to fix any problems from viewing these metrics alone, but you’ll get a sense of the big picture as you dive deeper into your data.
User Experience metrics
editUser Experience metrics help you understand the perceived performance of your website. For example, first contentful paint is the timestamp when the browser begins rendering content. In other words, it’s around this time that a user first gets feedback that the page is loading.
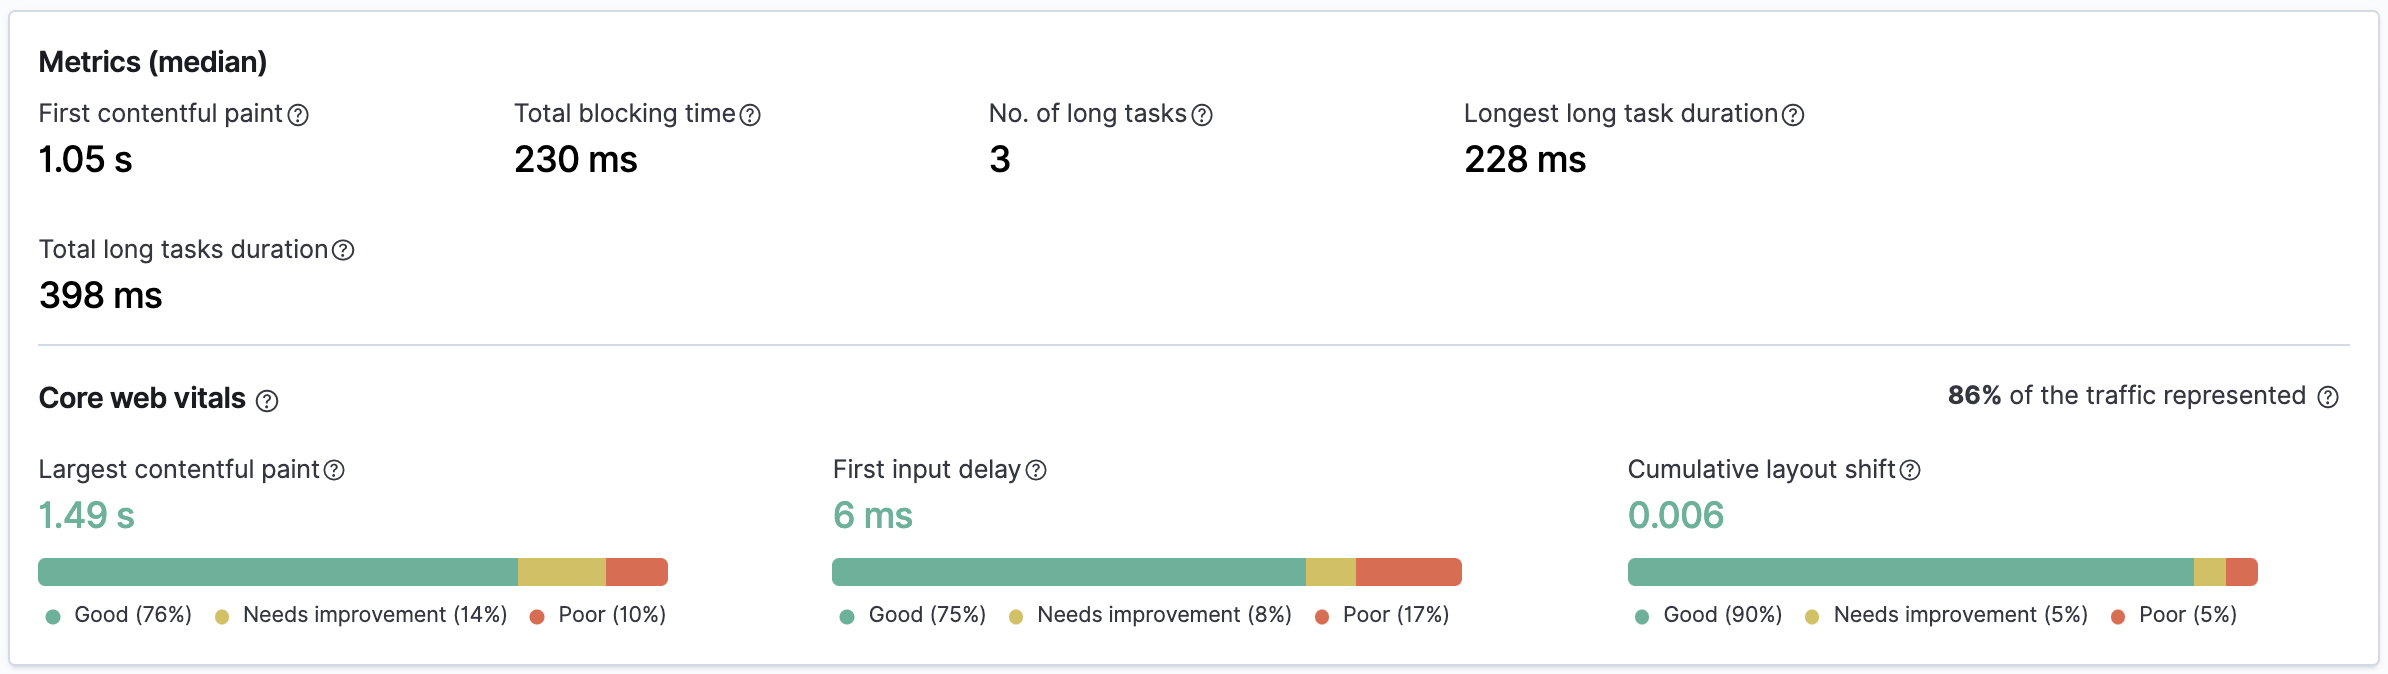
Metric reference
- First contentful paint
- Focusses on the initial rendering and measures the time from when the page starts loading to when any part of the page’s content is displayed on the screen. The agent uses the Paint timing API available in the browser to capture the timing information. [1]
- Total blocking time
- The sum of the blocking time (duration above 50 ms) for each long task that occurs between the First contentful paint and the time when the transaction is completed. Total blocking time is a great companion metric for Time to interactive (TTI) which is lab metric and not available in the field through browser APIs. The agent captures TBT based on the number of long tasks that occurred during the page load lifecycle. [2]
-
Long Tasks - A long task is any user activity or browser task that monopolize the UI thread for extended periods (greater than 50 milliseconds) and block other critical tasks (frame rate or input latency) from being executed. [3]
- Number of long tasks
- The number of long tasks.
- Longest long task duration
- Duration of the longest long task on the page.
- Total long tasks duration
- Total duration of all long tasks
These metrics tell an important story about how users experience your website. But developers shouldn’t have to become experts at interpreting and acting on these signals; they should spend their time reacting to the opportunities that these metrics present. For that reason (and many others), Elastic has embraced Google Core Web Vitals.
Core Web Vitals
editCore Web Vitals is a recent initiative from Google to introduce a new set of metrics that better categorize good and bad sites by quantifying the real-world user experience. This is done by looking at three key metrics: loading performance, visual stability, and interactivity:
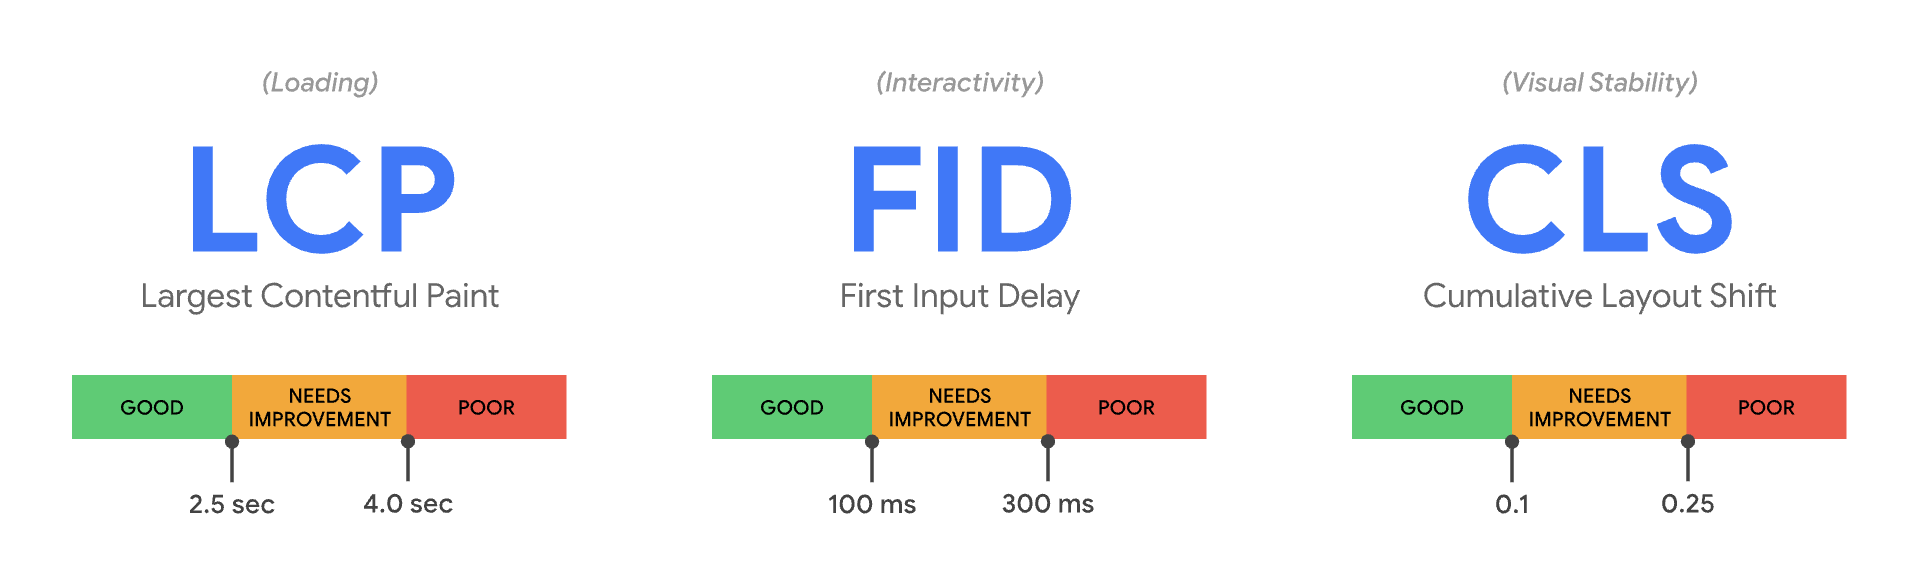
Image source: web.dev/vitals
- Largest contentful paint (LCP)
- Loading performance. LCP is the timestamp when the main content of a page has likely loaded. To users, this is the perceived loading speed of your site. To provide a good user experience, Google recommends an LCP of fewer than 2.5 seconds. [4]
- First input delay (FID)
- Load responsiveness. FID measures the time between a user’s first interaction with a page, like a click, and when the page can respond to those interactions. To provide a good user experience, Google recommends a FID of less than 100 milliseconds. [5]
- Cumulative layout shift (CLS)
-
Visual stability. Is content moving around because of async resource loading or dynamic content additions?
CLS measures these frustrating unexpected layout shifts.
To provide a good user experience, Google recommends a CLS score of less than
.1. [6]
Beginning in May 2021, Google will start using Core Web Vitals as part of their ranking algorithm and will open up the opportunity for websites to rank in the "top stories" position without needing to leverage AMP. [7]
Load/view distribution
editOperating system, browser family, and geographic location can all have a massive impact on how visitors experience your website. This data can help you understand when and where your users are visiting from, and can help you prioritize optimizations — for example, prioritizing improvements for the most popular browsers visiting your site.
Don’t forget, this data also influences search engine page rankings and placement in top stories for content sites — without requiring the use of AMP.
Error breakdown
editJavaScript errors can be detrimental to a users experience on your website. But variation in users' software and hardware makes it nearly impossible to test for every combination. And, as JavaScript continues to get more and more complex, the need for user experience monitoring and error reporting only increases. Error monitoring removes this blindspot by surfacing JavaScript errors that are occurring on your website in production.
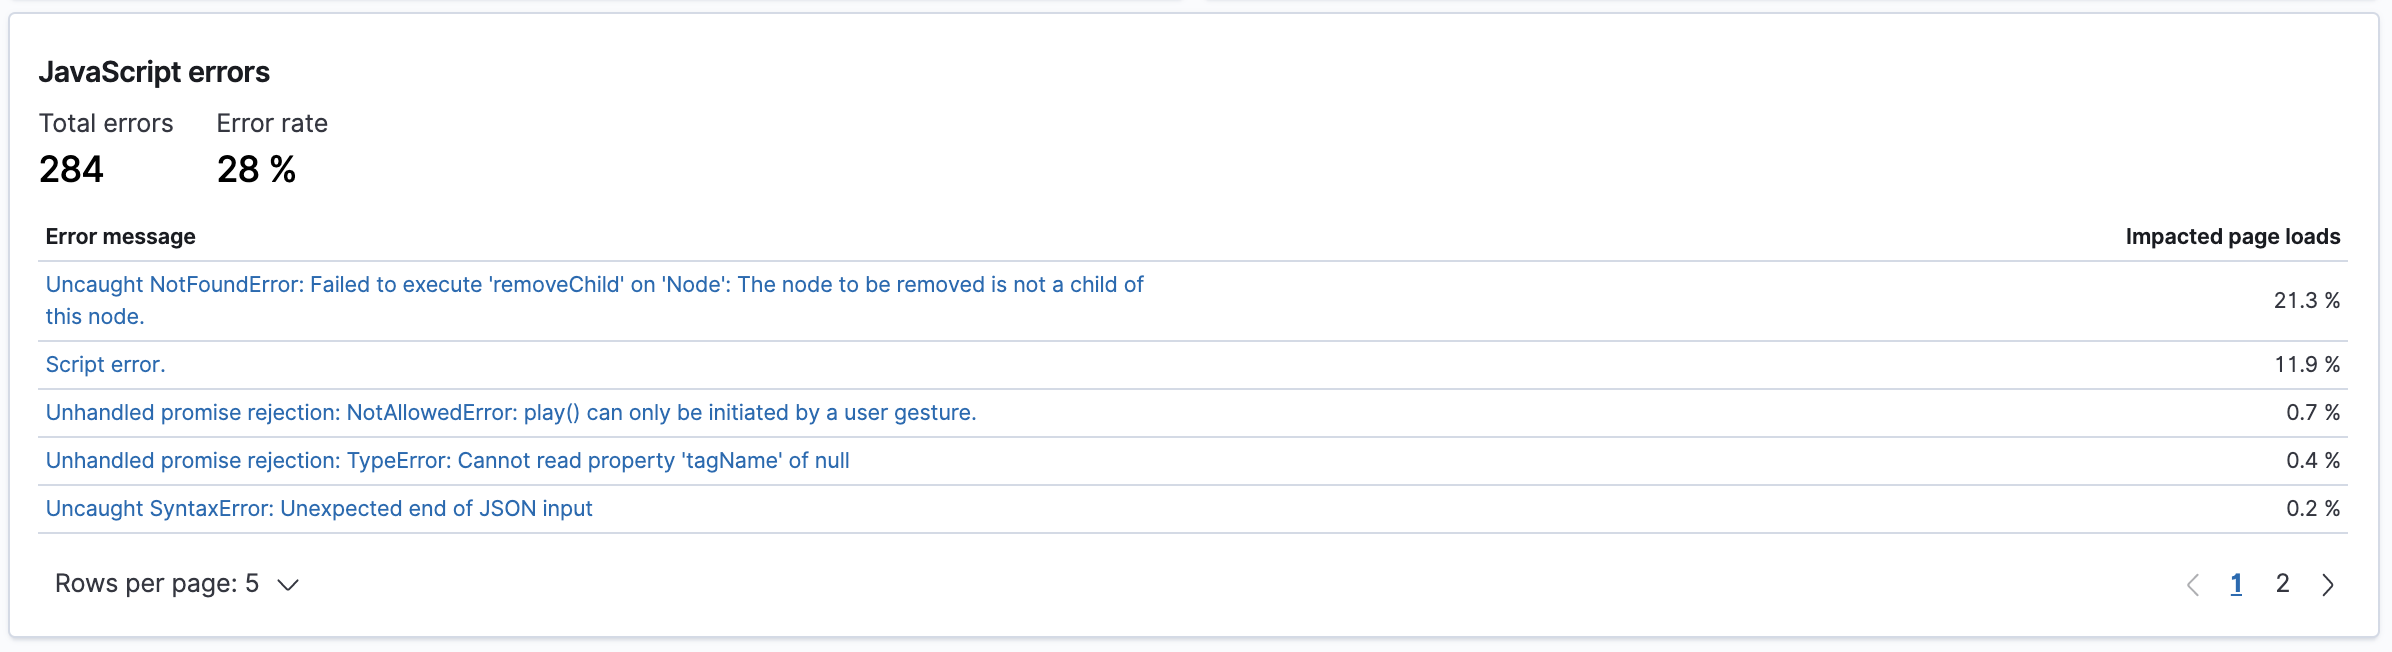
Open error messages in APM for additional analysis tools, like occurrence rates, transaction ids, user data, and more.
Feedback and troubleshooting
editHave a question? Want to leave feedback? Visit the User experience discussion forum.