It is time to say goodbye: This version of Elastic Cloud Enterprise has reached end-of-life (EOL) and is no longer supported.
The documentation for this version is no longer being maintained. If you are running this version, we strongly advise you to upgrade. For the latest information, see the current release documentation.
Ingest data from a relational database into Elastic Cloud Enterprise
editIngest data from a relational database into Elastic Cloud Enterprise
editThis guide explains how to ingest data from a relational database into Elastic Cloud Enterprise through Logstash, using the Logstash JDBC input plugin. It demonstrates how Logstash can be used to efficiently copy records and to receive updates from a relational database, and then send them into Elasticsearch in an Elastic Cloud Enterprise deployment.
The code and methods presented here have been tested with MySQL. They should work with other relational databases.
The Logstash Java Database Connectivity (JDBC) input plugin enables you to pull in data from many popular relational databases including MySQL and Postgres. Conceptually, the JDBC input plugin runs a loop that periodically polls the relational database for records that were inserted or modified since the last iteration of this loop.
This document presents:
Time required: 2 hours
Prerequisites
editFor this tutorial you need a source MySQL instance for Logstash to read from. A free version of MySQL is available from the MySQL Community Server section of the MySQL Community Downloads site.
Create a deployment
edit- Log into the Elastic Cloud Enterprise admin console.
- Click Create deployment.
- Give your deployment a name. You can leave all other settings at their default values.
- Click Create deployment and save your Elastic deployment credentials. You will need these credentials later on.
-
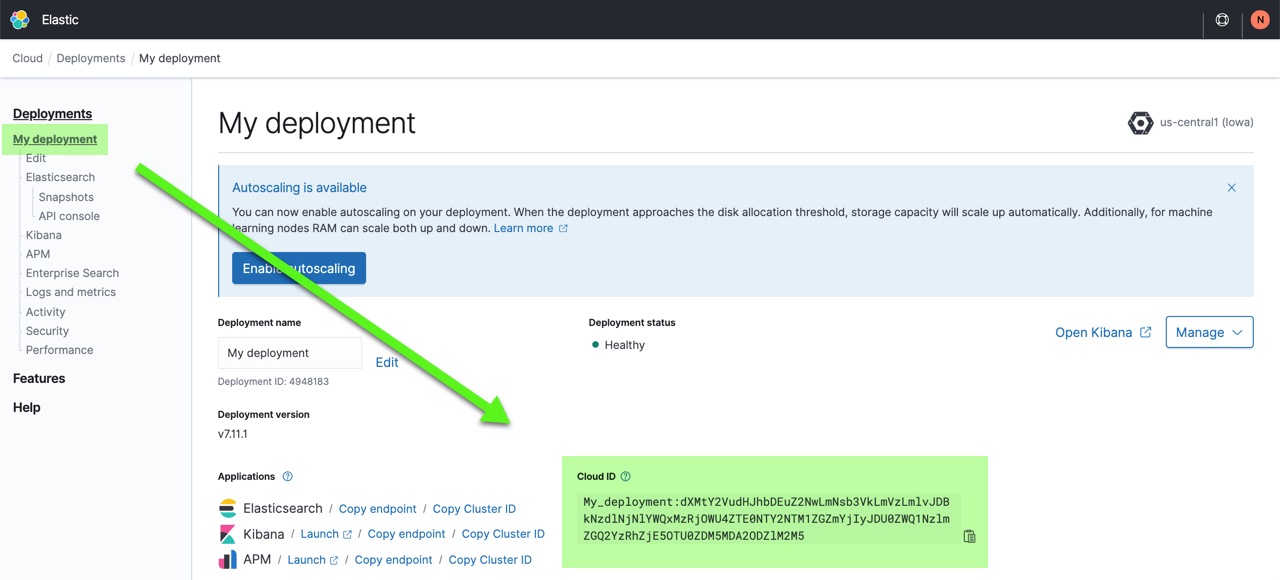
You also need the Cloud ID later on, as it simplifies sending data to Elastic Cloud Enterprise. Click on the deployment name from the Elastic Cloud Enterprise portal or the Deployments page and copy down the information under Cloud ID:
Connect securely
editWhen connecting to Elastic Cloud Enterprise you can use a Cloud ID to specify the connection details. You must pass the Cloud ID that you can find in the cloud console.
To connect to, stream data to, and issue queries with Elastic Cloud Enterprise, you need to think about authentication. Two authentication mechanisms are supported, API key and basic authentication. Here, to get you started quickly, we’ll show you how to use basic authentication, but you can also generate API keys as shown later on. API keys are safer and preferred for production environments.
- Download and unpack Logstash version 7.12.0 on the local machine that hosts MySQL or another machine granted access to the MySQL machine.
Get the MySQL JDBC driver
editThe Logstash JDBC input plugin does not include any database connection drivers. You need a JDBC driver for your relational database for the steps in the later section Configure a Logstash pipeline with the JDBC input plugin.
- Download and unpack the JDBC driver for MySQL from the Connector/J section of the MySQL Community Downloads site.
- Make a note of the driver’s location as it’s needed in the steps that follow.
Prepare a source MySQL database
editLet’s look at a simple database from which you’ll import data and send it to Elastic Cloud Enterprise. This example uses a MySQL database with timestamped records. The timestamps enable you to determine easily what’s changed in the database since the most recent data transfer to Elastic Cloud Enterprise.
Consider the database structure and design
editFor this example, let’s create a new database es_db with table es_table, as the source of our Elasticsearch data.
-
Run the following SQL statement to generate a new MySQL database with a three column table:
CREATE DATABASE es_db;
USE es_db;
DROP TABLE IF EXISTS es_table;
CREATE TABLE es_table (
  id BIGINT(20) UNSIGNED NOT NULL,
  PRIMARY KEY (id),
  UNIQUE KEY unique_id (id),
  client_name VARCHAR(32) NOT NULL,
  modification_time TIMESTAMP NOT NULL DEFAULT CURRENT_TIMESTAMP ON UPDATE CURRENT_TIMESTAMP
);
Let’s explore the key concepts in the above SQL snippet:
- es_table
- The name of the table that stores the data.
- id
- The unique identifier for records. id is defined as both a PRIMARY KEY and UNIQUE KEY to guarantee that each id appears only once in the current table. This is translated to _id for updating or inserting the document into Elasticsearch.
- client_name
- The data that will ultimately be ingested into Elasticsearch. For simplicity, this example includes only a single data field.
- modification_time
- The timestamp of when the record was inserted or last updated. Further in, you can use this timestamp to determine what has changed since the last data transfer into Elasticsearch.
-
Consider how to handle deletions and how to notify Elasticsearch about them. Often, deleting a record results in its immediate removal from the MySQL database. There’s no record of that deletion. The change isn’t detected by Logstash, so that record remains in Elasticsearch.
There are two possible ways to address this:
- You can use "soft deletes" in your source database. Essentially, a record is first marked for deletion through a boolean flag. Other programs that are currently using your source database would have to filter out "soft deletes" in their queries. The "soft deletes" are sent over to Elasticsearch, where they can be processed. After that, your source database and Elasticsearch must both remove these "soft deletes."
- You can periodically clear the Elasticsearch indices that are based off of the database, and then refresh Elasticsearch with a fresh ingest of the contents of the database.
-
Log in to your MySQL server and add three records to your new database:
use es_db
INSERT INTO es_table (id, client_name)
VALUES (1,"Targaryen"),
(2,"Lannister"),
(3,"Stark");
-
Verify your data with a SQL statement:
select * from es_table;
The output should look similar to the following:
+----+-------------+---------------------+
| id | client_name | modification_time   |
+----+-------------+---------------------+
|  1 | Targaryen   | 2021-04-21 12:17:16 |
|  2 | Lannister   | 2021-04-21 12:17:16 |
|  3 | Stark       | 2021-04-21 12:17:16 |
+----+-------------+---------------------+
Now, let’s go back to Logstash and configure it to ingest this data.
Configure a Logstash pipeline with the JDBC input plugin
editLet’s set up a sample Logstash input pipeline to ingest data from your new JDBC Plugin and MySQL database. Beyond MySQL, you can input data from any database that supports JDBC.
-
In
<localpath>/logstash-7.12.0/, create a new text file namedjdbc.conf. -
Copy and paste the following code into this new text file. This code creates a Logstash pipeline through a JDBC plugin.
input {
  jdbc {
    jdbc_driver_library => "<driverpath>/mysql-connector-java-<versionNumber>.jar"
    jdbc_driver_class => "com.mysql.jdbc.Driver"
    jdbc_connection_string => "jdbc:mysql://<MySQL host>:3306/es_db"
    jdbc_user => "<myusername>"
    jdbc_password => "<mypassword>"
    jdbc_paging_enabled => true
    tracking_column => "unix_ts_in_secs"
    use_column_value => true
    tracking_column_type => "numeric"
    schedule => "*/5 * * * * *"
    statement => "SELECT *, UNIX_TIMESTAMP(modification_time) AS unix_ts_in_secs FROM es_table WHERE (UNIX_TIMESTAMP(modification_time) > :sql_last_value AND modification_time < NOW()) ORDER BY modification_time ASC"
  }
}
filter {
  mutate {
    copy => { "id" => "[@metadata][_id]"}
    remove_field => ["id", "@version", "unix_ts_in_secs"]
  }
}
output {
  stdout { codec =>  "rubydebug"}
}
Specify the full path to your local JDBC driver .jar file (including version number). For example:
jdbc_driver_library => "/usr/share/mysql/mysql-connector-java-8.0.24.jar"Provide the IP address or hostname and the port of your MySQL host. For example,
jdbc_connection_string => "jdbc:mysql://127.0.0.1:3306/es_db"Provide your MySQL credentials. The username and password must both be enclosed in quotation marks.
If you are using MariaDB (a popular open source community fork of MySQL), there are a couple of things that you need to do differently:
In place of the MySQL JDBC driver, download and unpack the JDBC driver for MariaDB.
Substitute the following lines in the
jdbc.confcode, including theANSI_QUOTESsnippet in the last line:jdbc_driver_library => "<driverPath>/mariadb-java-client-<versionNumber>.jar" jdbc_driver_class => "org.mariadb.jdbc.Driver" jdbc_connection_string => "jdbc:mariadb://<mySQLHost>:3306/es_db?sessionVariables=sql_mode=ANSI_QUOTES"
Following are some additional details about the Logstash pipeline code:
- jdbc_driver_library
-
The Logstash JDBC plugin does not come packaged with JDBC driver libraries. The JDBC driver library must be passed explicitly into the plugin using the
jdbc_driver_libraryconfiguration option. - tracking_column
-
This parameter specifies the field
unix_ts_in_secsthat tracks the last document read by Logstash from MySQL, stored on disk in logstash_jdbc_last_run. The parameter determines the starting value for documents that Logstash requests in the next iteration of its polling loop. The value stored inlogstash_jdbc_last_runcan be accessed in a SELECT statement assql_last_value. - unix_ts_in_secs
-
The field generated by the SELECT statement, which contains the
modification_timeas a standard Unix timestamp (seconds since the epoch). The field is referenced by thetracking column. A Unix timestamp is used for tracking progress rather than a normal timestamp, as a normal timestamp may cause errors due to the complexity of correctly converting back and forth between UMT and the local timezone. - sql_last_value
-
This is a built-in parameter containing the starting point of the current iteration of the Logstash polling loop, and it is referenced in the SELECT statement line of the JDBC input configuration. This parameter is set to the most recent value of
unix_ts_in_secs, which is read from.logstash_jdbc_last_run. This value is the starting point for documents returned by the MySQL query that is executed in the Logstash polling loop. Including this variable in the query guarantees that we’re not resending data that is already stored in Elasticsearch. - schedule
-
This uses cron syntax to specify how often Logstash should poll MySQL for changes. The specification
*/5 * * * * *tells Logstash to contact MySQL every 5 seconds. Input from this plugin can be scheduled to run periodically according to a specific schedule. This scheduling syntax is powered by rufus-scheduler. The syntax is cron-like with some extensions specific to Rufus (for example, timezone support). - modification_time < NOW()
- This portion of the SELECT is explained in detail in the next section.
- filter
-
In this section, the value
idis copied from the MySQL record into a metadata field called_id, which is later referenced in the output to ensure that each document is written into Elasticsearch with the correct_idvalue. Using a metadata field ensures that this temporary value does not cause a new field to be created. Theid,@version, andunix_ts_in_secsfields are also removed from the document, since they don’t need to be written to Elasticsearch. - output
- This section specifies that each document should be written to the standard output using the rubydebug output to help with debugging.
-
Launch Logstash with your new JDBC configuration file:
bin/logstash -f jdbc.conf
Logstash outputs your MySQL data through standard output (
stdout), your command line interface. The results for the initial data load should look similar to the following:[INFO ] 2021-04-21 12:32:32.816 [Ruby-0-Thread-15: :1] jdbc - (0.009082s) SELECT * FROM (SELECT *, UNIX_TIMESTAMP(modification_time) AS unix_ts_in_secs FROM es_table WHERE (UNIX_TIMESTAMP(modification_time) > 0 AND modification_time < NOW()) ORDER BY modification_time ASC) AS 't1' LIMIT 100000 OFFSET 0 { "client_name" => "Targaryen", "modification_time" => 2021-04-21T12:17:16.000Z, "@timestamp" => 2021-04-21T12:17:16.923Z } { "client_name" => "Lannister", "modification_time" => 2021-04-21T12:17:16.000Z, "@timestamp" => 2021-04-21T12:17:16.961Z } { "client_name" => "Stark", "modification_time" => 2021-04-21T12:17:16.000Z, "@timestamp" => 2021-04-21T12:17:16.963Z }The Logstash results periodically display SQL SELECT statements, even when there’s nothing new or modified in the MySQL database:
[INFO ] 2021-04-21 12:33:30.407 [Ruby-0-Thread-15: :1] jdbc - (0.002835s) SELECT count(*) AS 'count' FROM (SELECT *, UNIX_TIMESTAMP(modification_time) AS unix_ts_in_secs FROM es_table WHERE (UNIX_TIMESTAMP(modification_time) > 1618935436 AND modification_time < NOW()) ORDER BY modification_time ASC) AS 't1' LIMIT 1
-
Open your MySQL console. Let’s insert another record into that database using the following SQL statement:
use es_db
INSERT INTO es_table (id, client_name)
VALUES (4,"Baratheon");
Switch back to your Logstash console. Logstash detects the new record and the console displays results similar to the following:
[INFO ] 2021-04-21 12:37:05.303 [Ruby-0-Thread-15: :1] jdbc - (0.001205s) SELECT * FROM (SELECT *, UNIX_TIMESTAMP(modification_time) AS unix_ts_in_secs FROM es_table WHERE (UNIX_TIMESTAMP(modification_time) > 1618935436 AND modification_time < NOW()) ORDER BY modification_time ASC) AS 't1' LIMIT 100000 OFFSET 0 { "client_name" => "Baratheon", "modification_time" => 2021-04-21T12:37:01.000Z, "@timestamp" => 2021-04-21T12:37:05.312Z } -
Review the Logstash output results to make sure your data looks correct. Use
CTRL + Cto shut down Logstash.
Output to Elasticsearch
editIn this section, we configure Logstash to send the MySQL data to Elasticsearch. We modify the configuration file created in the section Configure a Logstash pipeline with the JDBC input plugin so that data is output directly to Elasticsearch. We start Logstash to send the data, and then log into Elastic Cloud Enterprise to verify the data in Kibana.
-
Open the
jdbc.conffile in the Logstash folder for editing. -
Update the output section with the one that follows:
output {
  elasticsearch {
    index => "rdbms_idx"
    ilm_enabled => false
    cloud_id => "<DeploymentName>:<ID>"
    cloud_auth => "elastic:<Password>"
    ssl => true
    cacert => '/path/to/the/elastic-ece-ca-cert.pem'
    # api_key => "<myAPIid:myAPIkey>"
  }
}
Use the Cloud ID of your Elastic Cloud Enterprise deployment. You can include or omit the
<DeploymentName>:prefix at the beginning of the Cloud ID. Both versions work fine.the default usename is
elastic. It is not recommended to use theelasticaccount for ingesting data as this is a superuser. We recommend using a user with reduced permissions, or an API Key with permissions specific to the indices or data streams that will be written to. See Configuring security in Logstash for information on roles and API Keys. Use the password provided when you created the deployment if using theelasticuser, or the password used when creating a new ingest user with the roles specified in the Configuring security in Logstash documentation.This line is only used when you have a self signed certificate for your Elastic Cloud Enterprise proxy. If needed, specify the full path to the PEM formatted root cetificate (Root CA) used for the Elastic Cloud Enterprise proxy. You can retrieve the certificate chain from your ECE system by following the instructions in Get existing ECE security certificates. Save the final certificate in the chain to a file. In the example above the file is named
elastic-ece-ca-cert.pem.Following are some additional details about the configuration file settings:
- index
-
The name of the Elasticsearch index,
rdbms_idx, to associate the documents. - api_key
- If you choose to use an API key to authenticate (as discussed in the next step), you can provide it here.
-
Optional: For additional security, you can generate an Elasticsearch API key through the Elastic Cloud Enterprise console and configure Logstash to use the new key to connect securely to Elastic Cloud Enterprise.
- Log into the Cloud UI.
-
On the deployments page, select your deployment.
Narrow the list by name, ID, or choose from several other filters. To further define the list, use a combination of filters.
- From your deployment menu, click Elasticsearch and the API Console.
-
Select Post from the drop-down list and enter
/_security/api_keyin the field. -
Enter the following JSON request:
{
 "name": "logstash-apikey",
 "role_descriptors": {
   "logstash_read_write": {
     "cluster": ["manage_index_templates", "monitor"],
     "index": [
       {
         "names": ["logstash-*","rdbms_idx"],
         "privileges": ["create_index", "write", "read", "manage"]
       }
     ]
   }
 }
}
This creates an API key with the cluster
monitorprivilege which gives read-only access for determining the cluster state, andmanage_index_templatesallows all operations on index templates. Some additional privileges also allowcreate_index,write, andmanageoperations for the specified index. The indexmanageprivilege is added to enable index refreshes. -
Click Submit. The output should be similar to the following:
{ "api_key": "tV1dnfF-GHI59ykgv4N0U3", "id": "2TBR42gBabmINotmvZjv", "name": "logstash_api_key" } -
Enter your new
api_keyvalue into the Logstashjdbc.conffile, in the format<id>:<api_key>. If your results were as shown in this example, you would enter2TBR42gBabmINotmvZjv:tV1dnfF-GHI59ykgv4N0U3. Remember to remove the pound (#) sign to uncomment the line, and comment out theusernameandpasswordlines:output { elasticsearch { index => "rdbms_idx" cloud_id => "<myDeployment>" ssl => true ilm_enabled => false api_key => "2TBR42gBabmINotmvZjv:tV1dnfF-GHI59ykgv4N0U3" # user => "<Username>" # password => "<Password>" } }
-
At this point, if you simply restart Logstash as is with your new output, then no MySQL data is sent to our Elasticsearch index.
Why? Logstash retains the previous
sql_last_valuetimestamp and sees that no new changes have occurred in the MySQL database since that time. Therefore, based on the SQL query that we configured, there’s no new data to send to Logstash.Solution: Add
clean_run => trueas a new line in the JDBC input section of thejdbc.conffile. When set totrue, this parameter resetssql_last_valueback to zero.input { jdbc { ... clean_run => true ... } }After running Logstash once with
sql_last_valueset totrueyou can remove theclean_runline, unless you prefer the reset behavior to happen again at each restart of Logstash -
Open a command line interface instance, go to your Logstash installation path, and start Logstash:
bin/logstash -f jdbc.conf
-
Logstash outputs the MySQL data to your Elastic Cloud Enterprise deployment. Let’s take a look in Kibana and verify that data:
- Log into the Cloud UI.
-
On the deployments page, select your deployment.
Narrow the list by name, ID, or choose from several other filters. To further define the list, use a combination of filters.
- From your deployment menu, click Kibana and then Launch.
- Open the side-menu panel by clicking the three vertical line button.
- Scroll down and expand Management.
- Click Management and then Dev Tools.
-
Copy and paste the following API GET request into the Console pane, and then click the Play arrow. This queries all records in the new
rdbms_idxindex.GET rdbms_idx/_search { "query": { "match_all": {} } } -
The Results pane lists the
client_namerecords originating from your MySQL database, similar to those shown below: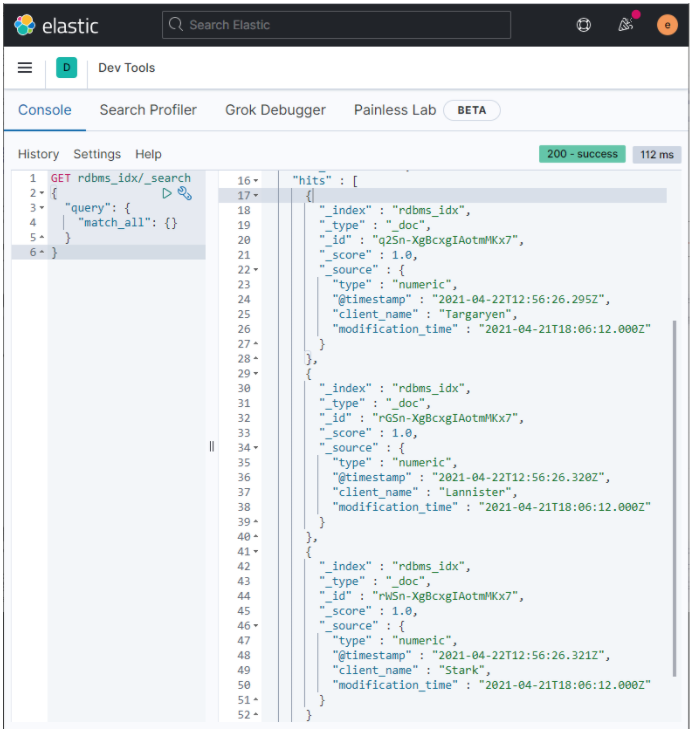
Now, you should have a good understanding of how to configure Logstash to ingest data from your relational database through the JDBC Plugin. You have some design considerations to track records that are new, modified, and deleted. You should have the basics needed to begin experimenting with your own database and Elasticsearch.