Iptables module
editIptables module
editThis is a module for iptables and ip6tables logs. It parses logs received over the network via syslog or from a file. Also, it understands the prefix added by some Ubiquiti firewalls, which includes the rule set name, rule number and the action performed on the traffic (allow/deny).
When you run the module, it performs a few tasks under the hood:
-
Sets the default input to
syslogand binds tolocalhostport9001(but don’t worry, you can override the defaults). - Uses ingest node to parse and process the log lines, shaping the data into a structure suitable for visualizing in Kibana.
- Deploys dashboards for visualizing the log data.
Set up and run the module
editBefore doing these steps, verify that Elasticsearch and Kibana are running and that Elasticsearch is ready to receive data from Filebeat.
If you’re running our hosted Elasticsearch Service on Elastic Cloud, or you’ve enabled security in Elasticsearch and Kibana, you need to specify additional connection information before setting up and running the module. See Quick start: modules for common log formats for the complete setup.
To set up and run the module:
-
Enable the module:
deb and rpm:
filebeat modules enable iptables
mac:
./filebeat modules enable iptables
brew:
filebeat modules enable iptables
linux:
./filebeat modules enable iptables
win:
PS > .\filebeat.exe modules enable iptables
This command enables the module config defined in the
modules.ddirectory. See Specify which modules to run for other ways to enable modules.To see a list of enabled and disabled modules, run:
deb and rpm:
filebeat modules list
mac:
./filebeat modules list
brew:
filebeat modules list
linux:
./filebeat modules list
win:
PS > .\filebeat.exe modules list
-
Set up the initial environment:
deb and rpm:
filebeat setup -e
mac:
./filebeat setup -e
linux:
./filebeat setup -e
brew:
filebeat setup -e
win:
PS > .\filebeat.exe setup -e
The
setupcommand loads the recommended index template for writing to Elasticsearch and deploys the sample dashboards (if available) for visualizing the data in Kibana. This is a one-time setup step.The
-eflag is optional and sends output to standard error instead of syslog.The ingest pipelines used to parse log lines are set up automatically the first time you run the module, assuming the Elasticsearch output is enabled. If you’re sending events to Logstash, or plan to use Beats central management, also see Load ingest pipelines manually.
-
Run Filebeat.
If your logs aren’t in the default location, see Configure the module, then run Filebeat after you’ve set the paths variable.
deb and rpm:
service filebeat start
mac:
./filebeat -e
brew:
filebeat -e
linux:
./filebeat -e
win:
PS > Start-Service filebeat
If the module is configured correctly, you’ll see
INFO Harvester startedmessages for each file specified in the config.Depending on how you’ve installed Filebeat, you might see errors related to file ownership or permissions when you try to run Filebeat modules. See Config File Ownership and Permissions in the Beats Platform Reference for more information.
-
Explore your data in Kibana:
-
Open your browser and navigate to the Dashboard overview in Kibana:
http://localhost:5601/app/kibana#/dashboards.
Replace
localhostwith the name of the Kibana host. If you’re using an Elastic Cloud instance, log in to your cloud account, then navigate to the Kibana endpoint in your deployment. - If necessary, log in with your Kibana username and password.
-
Enter the module name in the search box, then open a dashboard and explore the visualizations for your parsed logs.
If you don’t see data in Kibana, try changing the date range to a larger range. By default, Kibana shows the last 15 minutes.
-
Open your browser and navigate to the Dashboard overview in Kibana:
http://localhost:5601/app/kibana#/dashboards.
Replace
Example dashboard
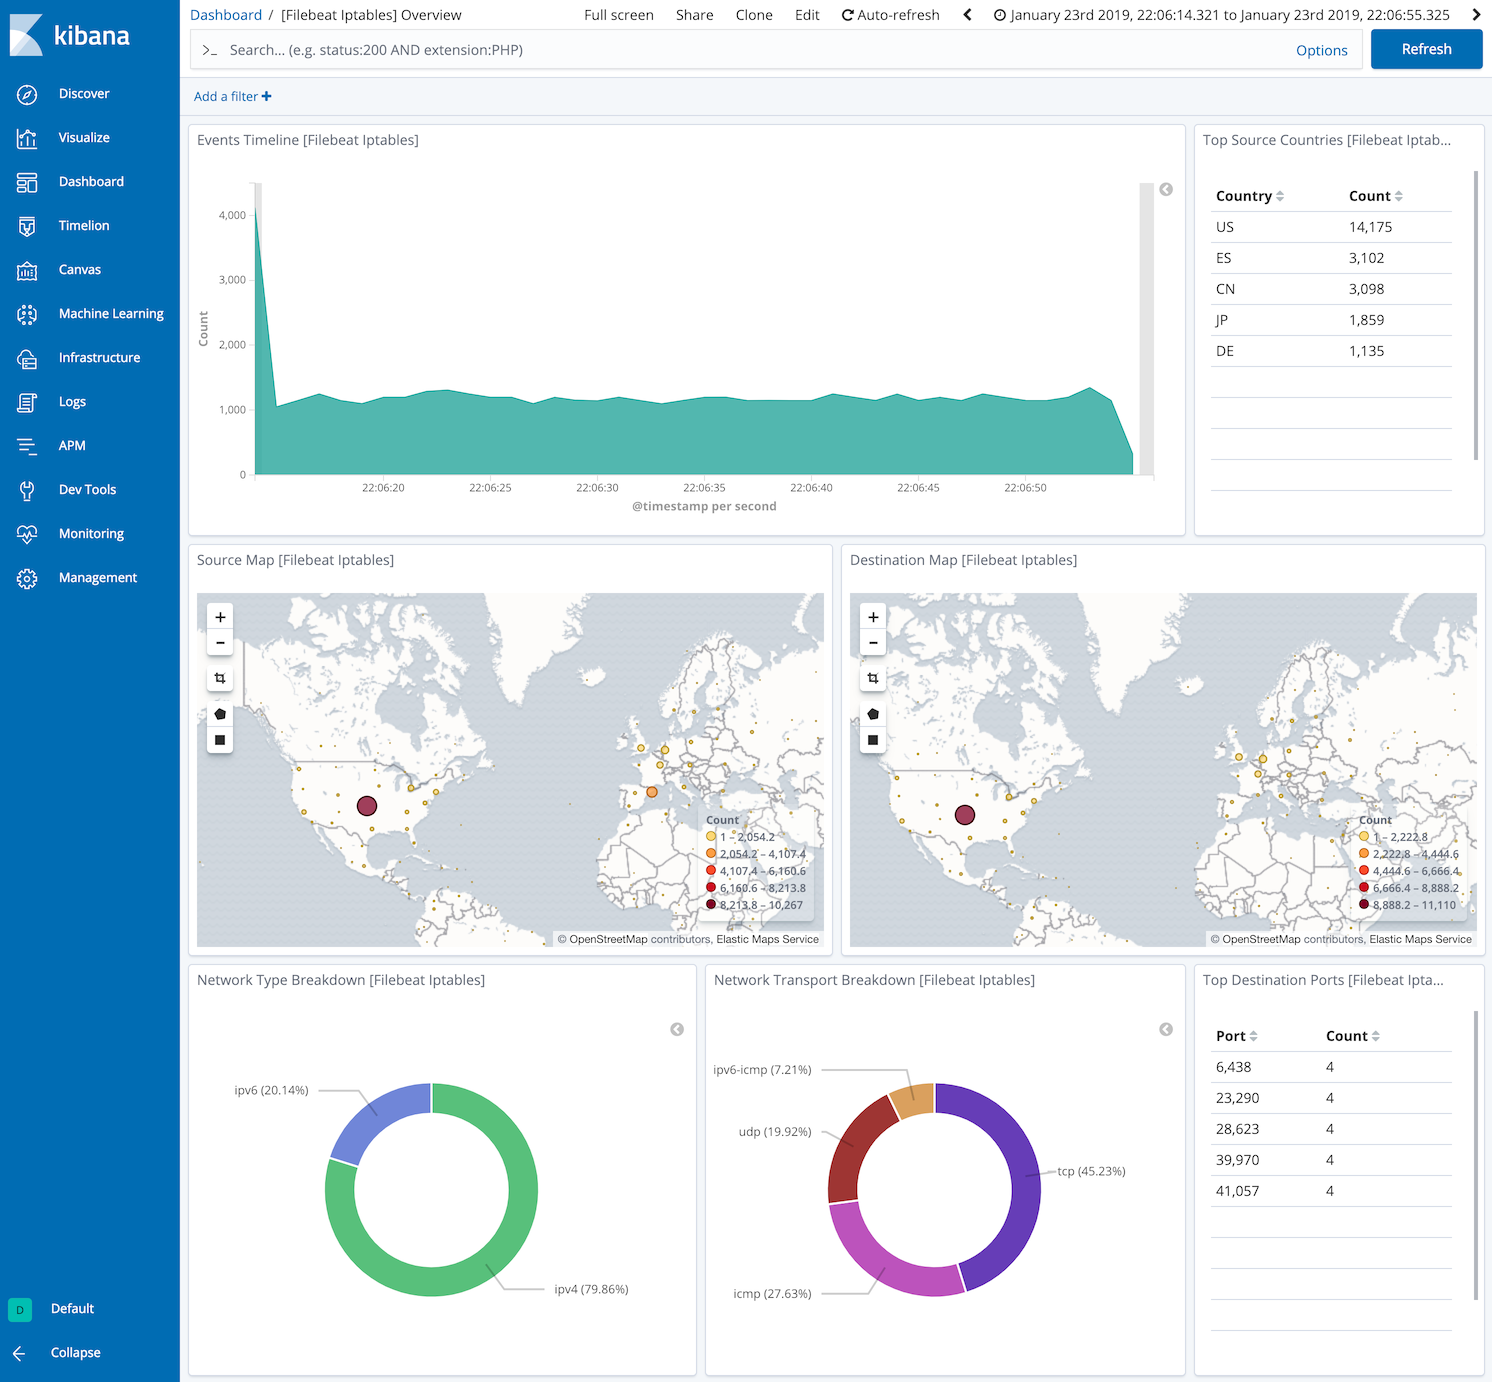
editThis module comes with sample dashboards showing geolocation and network protocols used. One for all iptables logs:
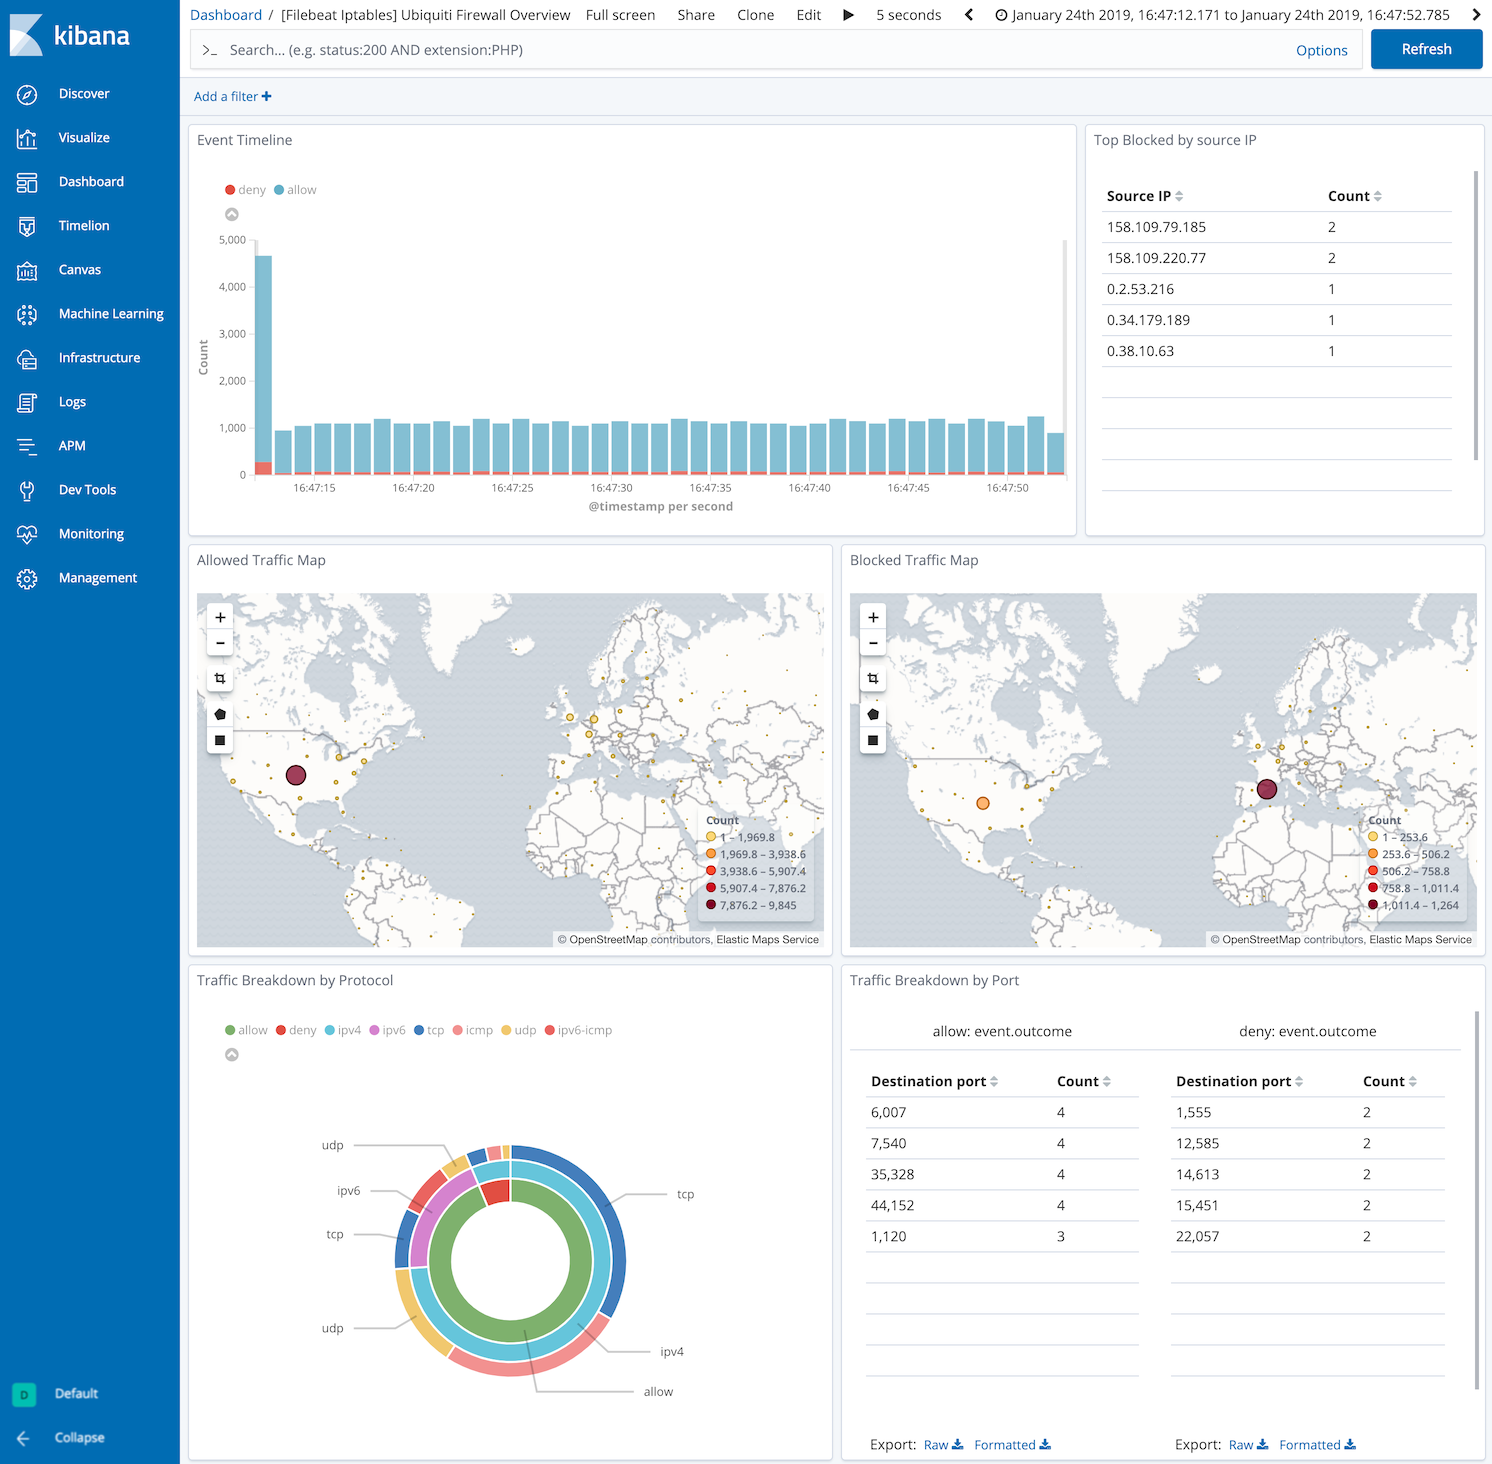
and one specific for Ubiquiti Firewall logs:
Configure the module
editYou can further refine the behavior of the iptables module by specifying
variable settings in the
modules.d/iptables.yml file, or overriding settings at the command line.
The module is by default configured to run via syslog on port 9001. However it can also be configured to read from a file path. See the following example.
- module: iptables
  log:
    enabled: true
    var.paths: ["/var/log/iptables.log"]
    var.input: "file"
Variable settings
editEach fileset has separate variable settings for configuring the behavior of the
module. If you don’t specify variable settings, the iptables module uses
the defaults.
For more information, see Specify variable settings. Also see Override input settings.
When you specify a setting at the command line, remember to prefix the
setting with the module name, for example, iptables.log.var.paths
instead of log.var.paths.
log log fileset settings
edit-
var.paths -
An array of glob-based paths that specify where to look for the log files. All
patterns supported by Go Glob
are also supported here. For example, you can use wildcards to fetch all files
from a predefined level of subdirectories:
/path/to/log/*/*.log. This fetches all.logfiles from the subfolders of/path/to/log. It does not fetch log files from the/path/to/logfolder itself. If this setting is left empty, Filebeat will choose log paths based on your operating system. -
var.syslog_host -
The interface to listen to UDP based syslog traffic. Defaults to
localhost. Set to0.0.0.0to bind to all available interfaces. -
var.syslog_port -
The UDP port to listen for syslog traffic. Defaults to
9001
Ports below 1024 require Filebeat to run as root.
Timezone support
editThis module parses logs that don’t contain timezone information. For these logs,
Filebeat reads the local timezone and uses it when parsing to convert the
timestamp to UTC. The timezone to be used for parsing is included in the event
in the event.timezone field.
To disable this conversion, the event.timezone field can be removed with
the drop_fields processor.
If logs are originated from systems or applications with a different timezone to
the local one, the event.timezone field can be overwritten with the original
timezone using the add_fields processor.
See Filter and enhance the exported data for information about specifying processors in your config.
Fields
editFor a description of each field in the module, see the exported fields section.