Quick start with Elastic Cloud
editQuick start with Elastic Cloud
editThe easiest way to get started with Elastic APM is by using our hosted Elasticsearch Service on Elastic Cloud. The Elasticsearch Service is available on AWS, GCP, and Azure. The Elasticsearch Service provisions the following components of the Elastic Stack:
- Elasticsearch — A highly scalable free and open full-text search and analytics engine.
- Kibana — An analytics and visualization platform designed to work with Elasticsearch.
-
Integrations Server — A combined APM Server and Fleet-managed Elastic Agent.
- APM Server — An application that receives, processes, and validates performance data from your APM agents.
- Fleet-managed Elastic Agent — A server that runs Fleet Server and provides a control plane for easily configuring and updating APM and other integrations.
Don’t worry—in order to get started, you don’t need to understand how all of these pieces work together! When you use our hosted Elasticsearch Service, simply spin-up your instance and point your APM agents towards it.
What will I learn in this guide?
editThis guide describes how to:
- Collect Application Performance Monitoring (APM) data
- Send APM data to the Elastic Stack
- Explore and visualize the data in real-time
For feedback and questions, please contact us in the discuss forum.
Prerequisites
editTo follow the steps in this guide, you need an Elastic Stack deployment that includes:
- Elasticsearch for storing and searching data
- Kibana for visualizing and managing data
-
Kibana user with
Allprivileges on Fleet and Integrations. Since many Integrations assets are shared across spaces, users need the Kibana privileges in all spaces. - Integrations Server (included by default in every Elasticsearch Service deployment)
To get started quickly, spin up a deployment of our hosted Elasticsearch Service. The Elasticsearch Service is available on AWS, GCP, and Azure. Try it out for free.
Step 1: Configure the APM integration
editElastic Cloud runs a hosted version of Integrations Server that includes the APM integration.
-
In Kibana, navigate to Fleet > Agent policies and select the Elastic Cloud agent policy. This is the default agent policy for Elastic Agents hosted on Elastic Cloud.
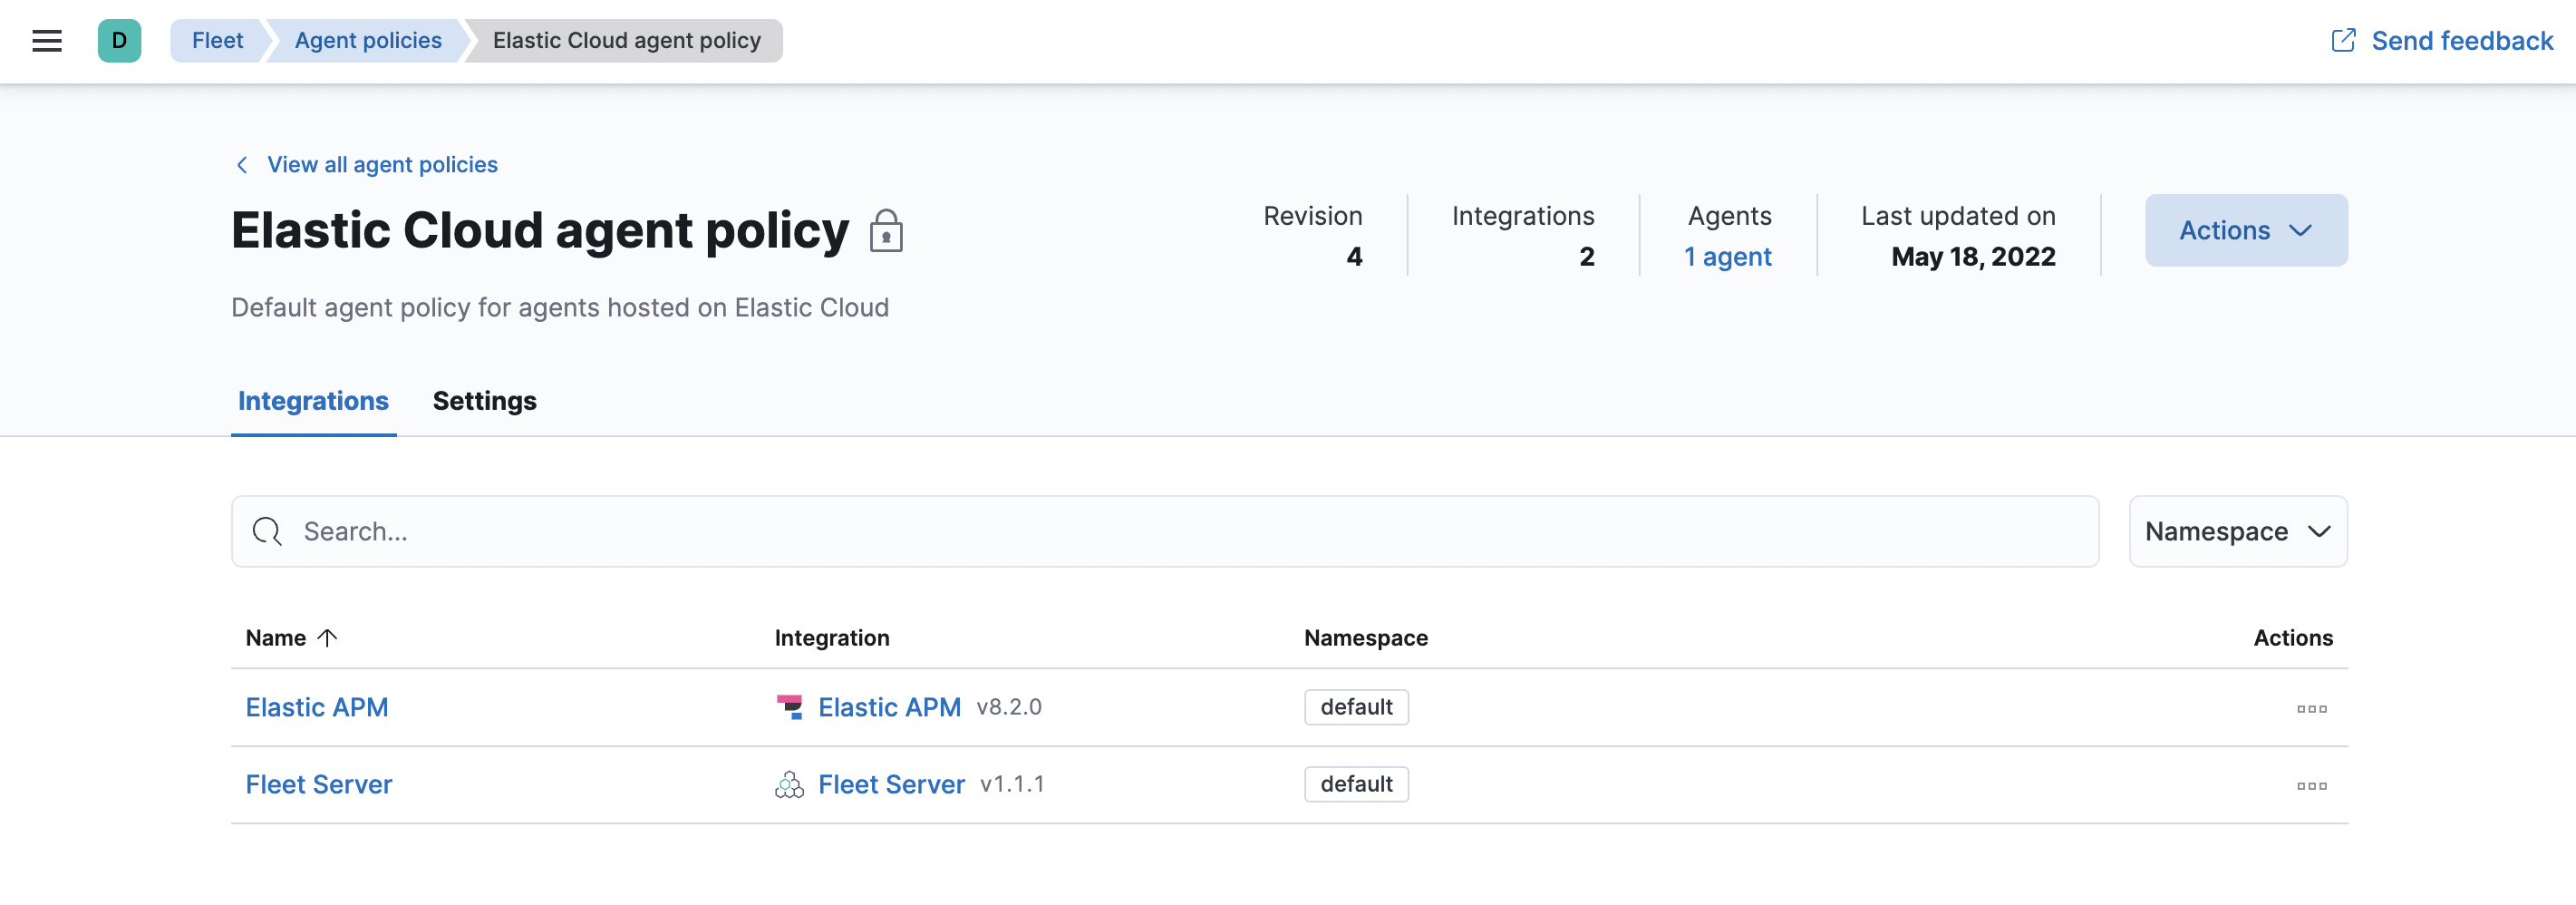
-
Next to Elastic APM in the Actions column, select Edit integration to configure the APM integration.
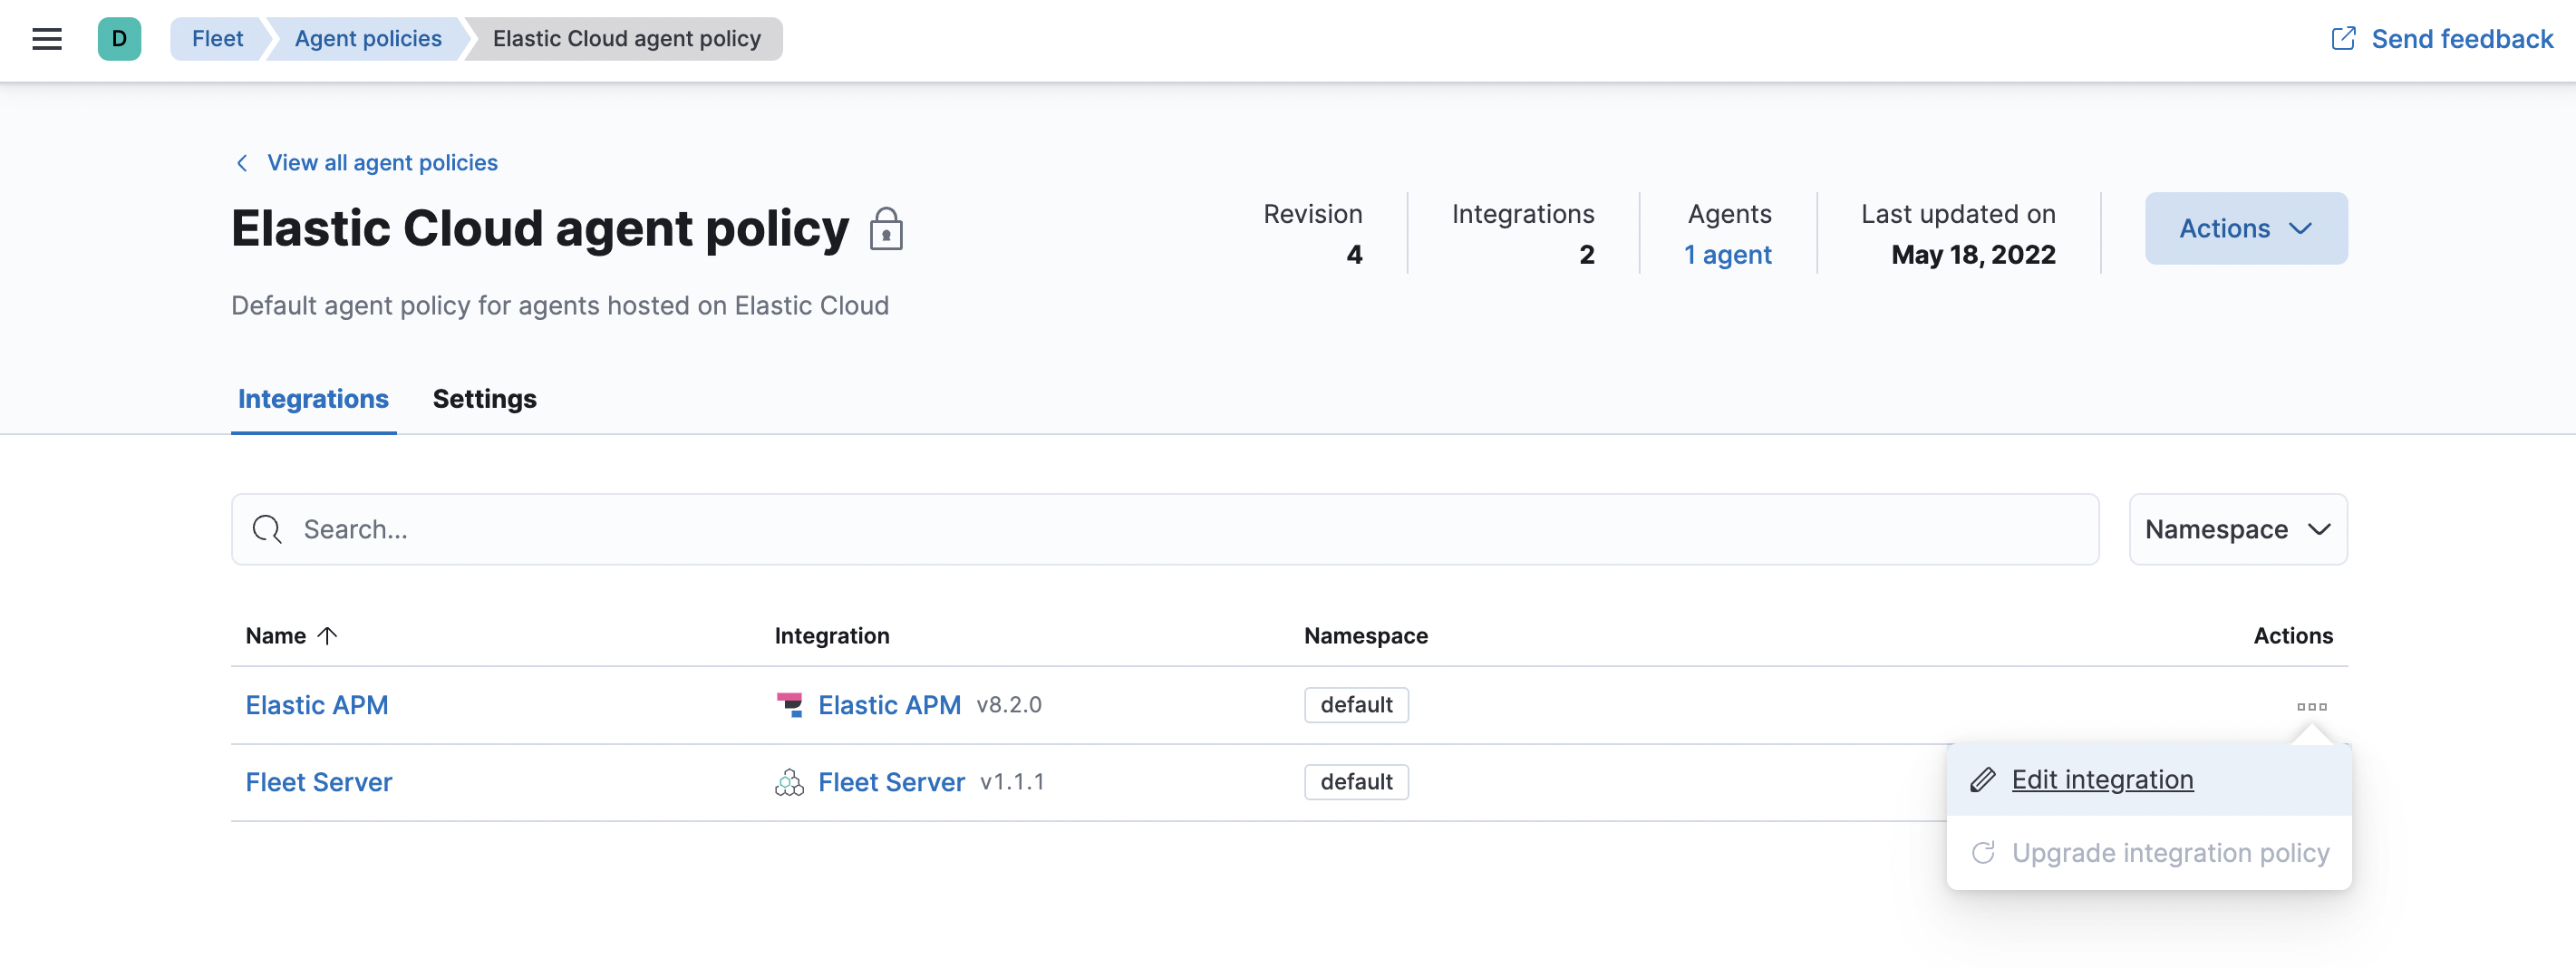
- Make a note of the predefined URL that the APM Server is listening on—you’ll need this in the next step.
- If you made any changes to your configuration, click save and continue.
Step 2: Install APM agents
editAPM agents are written in the same language as your service. To monitor a new service, you must install the agent and configure it with a service name, APM Server host, and Secret token.
-
Service name: The APM integration maps an instrumented service’s name–defined in each APM agent’s configuration–
to the index that its data is stored in Elasticsearch.
Service names are case-insensitive and must be unique.
For example, you cannot have a service named
Fooand another namedfoo. Special characters will be removed from service names and replaced with underscores (_). - APM Server URL: The host and port that APM Server listens for events on. This should match the host and port defined when setting up the APM integration.
- Secret token: Authentication method for APM agent and APM Server communication. This should match the secret token defined when setting up the APM integration.
You can edit your APM integration settings if you need to change the APM Server URL or secret token to match your APM agents.
Install the agent
Install the APM agent packages for Go.
go get go.elastic.co/apm
Configure the agent
Agents are libraries that run inside of your application process.
APM services are created programmatically based on the executable file name, or the ELASTIC_APM_SERVICE_NAME environment variable.
# Initialize using environment variables:

# Set the service name. Allowed characters: a-z, A-Z, 0-9, -, _, and space.
# If ELASTIC_APM_SERVICE_NAME is not specified, the executable name will be used.
export ELASTIC_APM_SERVICE_NAME=

# Set custom APM Server URL. Default: http://localhost:8200.
export ELASTIC_APM_SERVER_URL=

# Use if APM Server requires a token
export ELASTIC_APM_SECRET_TOKEN=
Instrument your application
Instrument your Go application by using one of the provided instrumentation modules or by using the tracer API directly.
import (
	"net/http"

	"go.elastic.co/apm/module/apmhttp"
)

func main() {
	mux := http.NewServeMux()
	...
	http.ListenAndServe(":8080", apmhttp.Wrap(mux))
}
Learn more in the agent reference
This functionality is in technical preview and may be changed or removed in a future release. Elastic will work to fix any issues, but features in technical preview are not subject to the support SLA of official GA features.
Add the agent dependency to your project
Add the Elastic APM iOS Agent as a
package dependency
to your Xcode project or your Package.swift:
Package(
    dependencies:[
        .package(name: "iOSAgent", url: "git@github.com:elastic/apm-agent-ios.git", .branch("main")),
    ],
  targets:[
    .target(
        name: "MyApp",
        dependencies: [
            .product(name: "iOSAgent", package: "iOSAgent")
        ]
    ),
])
Initialize the agent
If you’re using SwiftUI to build your app, add the following to App.swift:
import SwiftUI
import iOSAgent

@main
struct MyApp: App {
    init() {
        var config = AgentConfiguration()
        config.collectorAddress = "127.0.0.1"
        config.collectorPort = 8200
        config.collectorTLS = false
        config.secretToken = "<secret token>"
        Agent.start(with: config)
    }
    var body: some Scene {
        WindowGroup {
            ContentView()
        }
    }
}
|
APM Server URL or IP address |
|
|
APM Server port number |
|
|
Enable TLS for Open telemetry exporters |
|
|
Set secret token for APM server connection |
If you’re not using SwiftUI, you can add the same thing to your AppDelegate file:
AppDelegate.swift
import UIKit
import iOSAgent
@main
class AppDelegate: UIResponder, UIApplicationDelegate {
    func application(_ application: UIApplication, didFinishLaunchingWithOptions launchOptions: [UIApplication.LaunchOptionsKey: Any]?) -> Bool {
        var config = AgentConfiguration()
        config.collectorAddress = "127.0.0.1"
        config.collectorPort = 8200
        config.collectorTLS = false
        config.secretToken = "<secret token>"
        Agent.start(with: config)
        return true
    }
}
Download the APM agent
Download the agent jar from Maven Central. Do not add the agent as a dependency to your application.
Start your application with the javaagent flag
Add the -javaagent flag and configure the agent with system properties.
- Set required service name
- Set custom APM Server URL (default: http://localhost:8200)
- Set the base package of your application
java -javaagent:/path/to/elastic-apm-agent-<version>.jar \
     -Delastic.apm.service_name=my-application \
     -Delastic.apm.server_urls=http://localhost:8200 \
     -Delastic.apm.secret_token= \
     -Delastic.apm.application_packages=org.example \
     -jar my-application.jar
Learn more in the agent reference
Download the APM agent
Add the agent packages from NuGet to your .NET application. There are multiple NuGet packages available for different use cases.
For an ASP.NET Core application with Entity Framework Core, download the Elastic.Apm.NetCoreAll package. This package will automatically add every agent component to your application.
To minimize the number of dependencies, you can use the Elastic.Apm.AspNetCore package for just ASP.NET Core monitoring, or the Elastic.Apm.EfCore package for just Entity Framework Core monitoring.
If you only want to use the public agent API for manual instrumentation, use the Elastic.Apm package.
Add the agent to the application
For an ASP.NET Core application with the Elastic.Apm.NetCoreAll package,
call the UseAllElasticApm method in the Configure method within the Startup.cs file:
public class Startup
{
  public void Configure(IApplicationBuilder app, IHostingEnvironment env)
  {
    app.UseAllElasticApm(Configuration);
    //…rest of the method
  }
  //…rest of the class
}
Passing an IConfiguration instance is optional and by doing so,
the agent will read config settings through this IConfiguration instance, for example,
from the appsettings.json file:
{
    "ElasticApm": {
    "SecretToken": "",
    "ServerUrls": "http://localhost:8200", //Set custom APM Server URL (default: http://localhost:8200)
    "ServiceName" : "MyApp", //allowed characters: a-z, A-Z, 0-9, -, _, and space. Default is the entry assembly of the application
  }
}
If you don’t pass an IConfiguration instance to the agent, for example, in a non-ASP.NET Core application,
you can configure the agent with environment variables.
See the agent reference for more information.
Learn more in the agent reference
Install the APM agent
Install the APM agent for Node.js as a dependency to your application.
npm install elastic-apm-node --save
Configure the agent
Agents are libraries that run inside of your application process. APM services are created programmatically based on the serviceName.
This agent supports a variety of frameworks but can also be used with your custom stack.
// Add this to the VERY top of the first file loaded in your app
var apm = require('elastic-apm-node').start({
  // Override service name from package.json
  // Allowed characters: a-z, A-Z, 0-9, -, _, and space
  serviceName: '',

  // Use if APM Server requires a token
  secretToken: '',

  // Set custom APM Server URL (default: http://localhost:8200)
  serverUrl: ''
})
Learn more in the agent reference
Install the agent
Install the PHP agent using one of the published packages.
To use the RPM Package (RHEL/CentOS and Fedora):
rpm -ivh <package-file>.rpm
To use the DEB package (Debian and Ubuntu):
dpkg -i <package-file>.deb
To use the APK package (Alpine):
apk add --allow-untrusted <package-file>.apk
If you can’t find your distribution, you can install the agent by building it from the source.
Configure the agent
Configure your agent inside of the php.ini file:
elastic_apm.server_url=http://localhost:8200
elastic_apm.secret_token=SECRET_TOKEN
elastic_apm.service_name="My-service"
Learn more in the agent reference
- Django
-
Install the APM agent
Install the APM agent for Python as a dependency.
$ pip install elastic-apm
Configure the agent
Agents are libraries that run inside of your application process. APM services are created programmatically based on the
SERVICE_NAME.# Add the agent to the installed apps INSTALLED_APPS = ( 'elasticapm.contrib.django', # ... ) ELASTIC_APM = { # Set required service name. Allowed characters: # a-z, A-Z, 0-9, -, _, and space 'SERVICE_NAME': '', # Use if APM Server requires a token 'SECRET_TOKEN': '', # Set custom APM Server URL (default: http://localhost:8200) 'SERVER_URL': '', } # To send performance metrics, add our tracing middleware: MIDDLEWARE = ( 'elasticapm.contrib.django.middleware.TracingMiddleware', #... ) - Flask
-
Install the APM agent
Install the APM agent for Python as a dependency.
$ pip install elastic-apm[flask]
Configure the agent
Agents are libraries that run inside of your application process. APM services are created programmatically based on the
SERVICE_NAME.# initialize using environment variables from elasticapm.contrib.flask import ElasticAPM app = Flask(__name__) apm = ElasticAPM(app) # or configure to use ELASTIC_APM in your application settings from elasticapm.contrib.flask import ElasticAPM app.config['ELASTIC_APM'] = { # Set required service name. Allowed characters: # a-z, A-Z, 0-9, -, _, and space 'SERVICE_NAME': '', # Use if APM Server requires a token 'SECRET_TOKEN': '', # Set custom APM Server URL (default: http://localhost:8200) 'SERVER_URL': '', } apm = ElasticAPM(app)
Learn more in the agent reference
Install the APM agent
Add the agent to your Gemfile.
gem 'elastic-apm'
Configure the agent
- Ruby on Rails
-
APM is automatically started when your app boots. Configure the agent by creating the config file
config/elastic_apm.yml:# config/elastic_apm.yml: # Set service name - allowed characters: a-z, A-Z, 0-9, -, _ and space # Defaults to the name of your Rails app service_name: 'my-service' # Use if APM Server requires a token secret_token: '' # Set custom APM Server URL (default: http://localhost:8200) server_url: 'http://localhost:8200'
- Rack
-
For Rack or a compatible framework, like Sinatra, include the middleware in your app and start the agent.
# config.ru
  require 'sinatra/base'

  class MySinatraApp < Sinatra::Base
    use ElasticAPM::Middleware

    # ...
  end

  ElasticAPM.start(
    app: MySinatraApp, # required
    config_file: '' # optional, defaults to config/elastic_apm.yml
  )

  run MySinatraApp

  at_exit { ElasticAPM.stop }
Create a config file
Create a config file config/elastic_apm.yml:
# config/elastic_apm.yml:

# Set service name - allowed characters: a-z, A-Z, 0-9, -, _ and space
# Defaults to the name of your Rack app's class.
service_name: 'my-service'

# Use if APM Server requires a token
secret_token: ''

# Set custom APM Server URL (default: http://localhost:8200)
server_url: 'http://localhost:8200'
Learn more in the agent reference
Enable Real User Monitoring support in APM Server
APM Server disables RUM support by default.
To enable it, set apm-server.rum.enabled: true in your APM Server configuration file.
Set up the agent
Once RUM support enabled, you can set up the RUM agent.
There are two ways to do this: add the agent as a dependency,
or set it up with <script> tags.
Set up the agent as a dependency
You can install the agent as a dependency to your application with npm install @elastic/apm-rum --save.
The agent can then be initialized and configured in your application like this:
import { init as initApm } from '@elastic/apm-rum'
var apm = initApm({

  // Set required service name (allowed characters: a-z, A-Z, 0-9, -, _, and space)
  serviceName: 'your-app-name',

  // Set custom APM Server URL (default: http://localhost:8200)
  serverUrl: '',

  // Set service version (required for source map feature)
  serviceVersion: ''
})
Framework integrations, like React or Angular, have custom dependencies. See framework integrations for more information.
Set up the agent with <script> tags
Alternatively, you can use <script> tags to set up and configure the agent.
Add a <script> tag to the HTML page and use the elasticApm global object to load and initialize the agent.
Don’t forget to download the latest version of the RUM agent from
GitHub or
UNPKG,
and host the file on your Server/CDN before deploying to production.
<script src="https://your-cdn-host.com/path/to/elastic-apm-rum.umd.min.js" crossorigin></script>
<script>
  elasticApm.init({
    serviceName: 'your-app-name',
    serverUrl: 'http://localhost:8200',
  })
</script>
Learn more in the agent reference
Elastic integrates with OpenTelemetry, allowing you to reuse your existing instrumentation to easily send observability data to the Elastic Stack.
For more information on how to combine Elastic and OpenTelemetry, see OpenTelemetry integration.
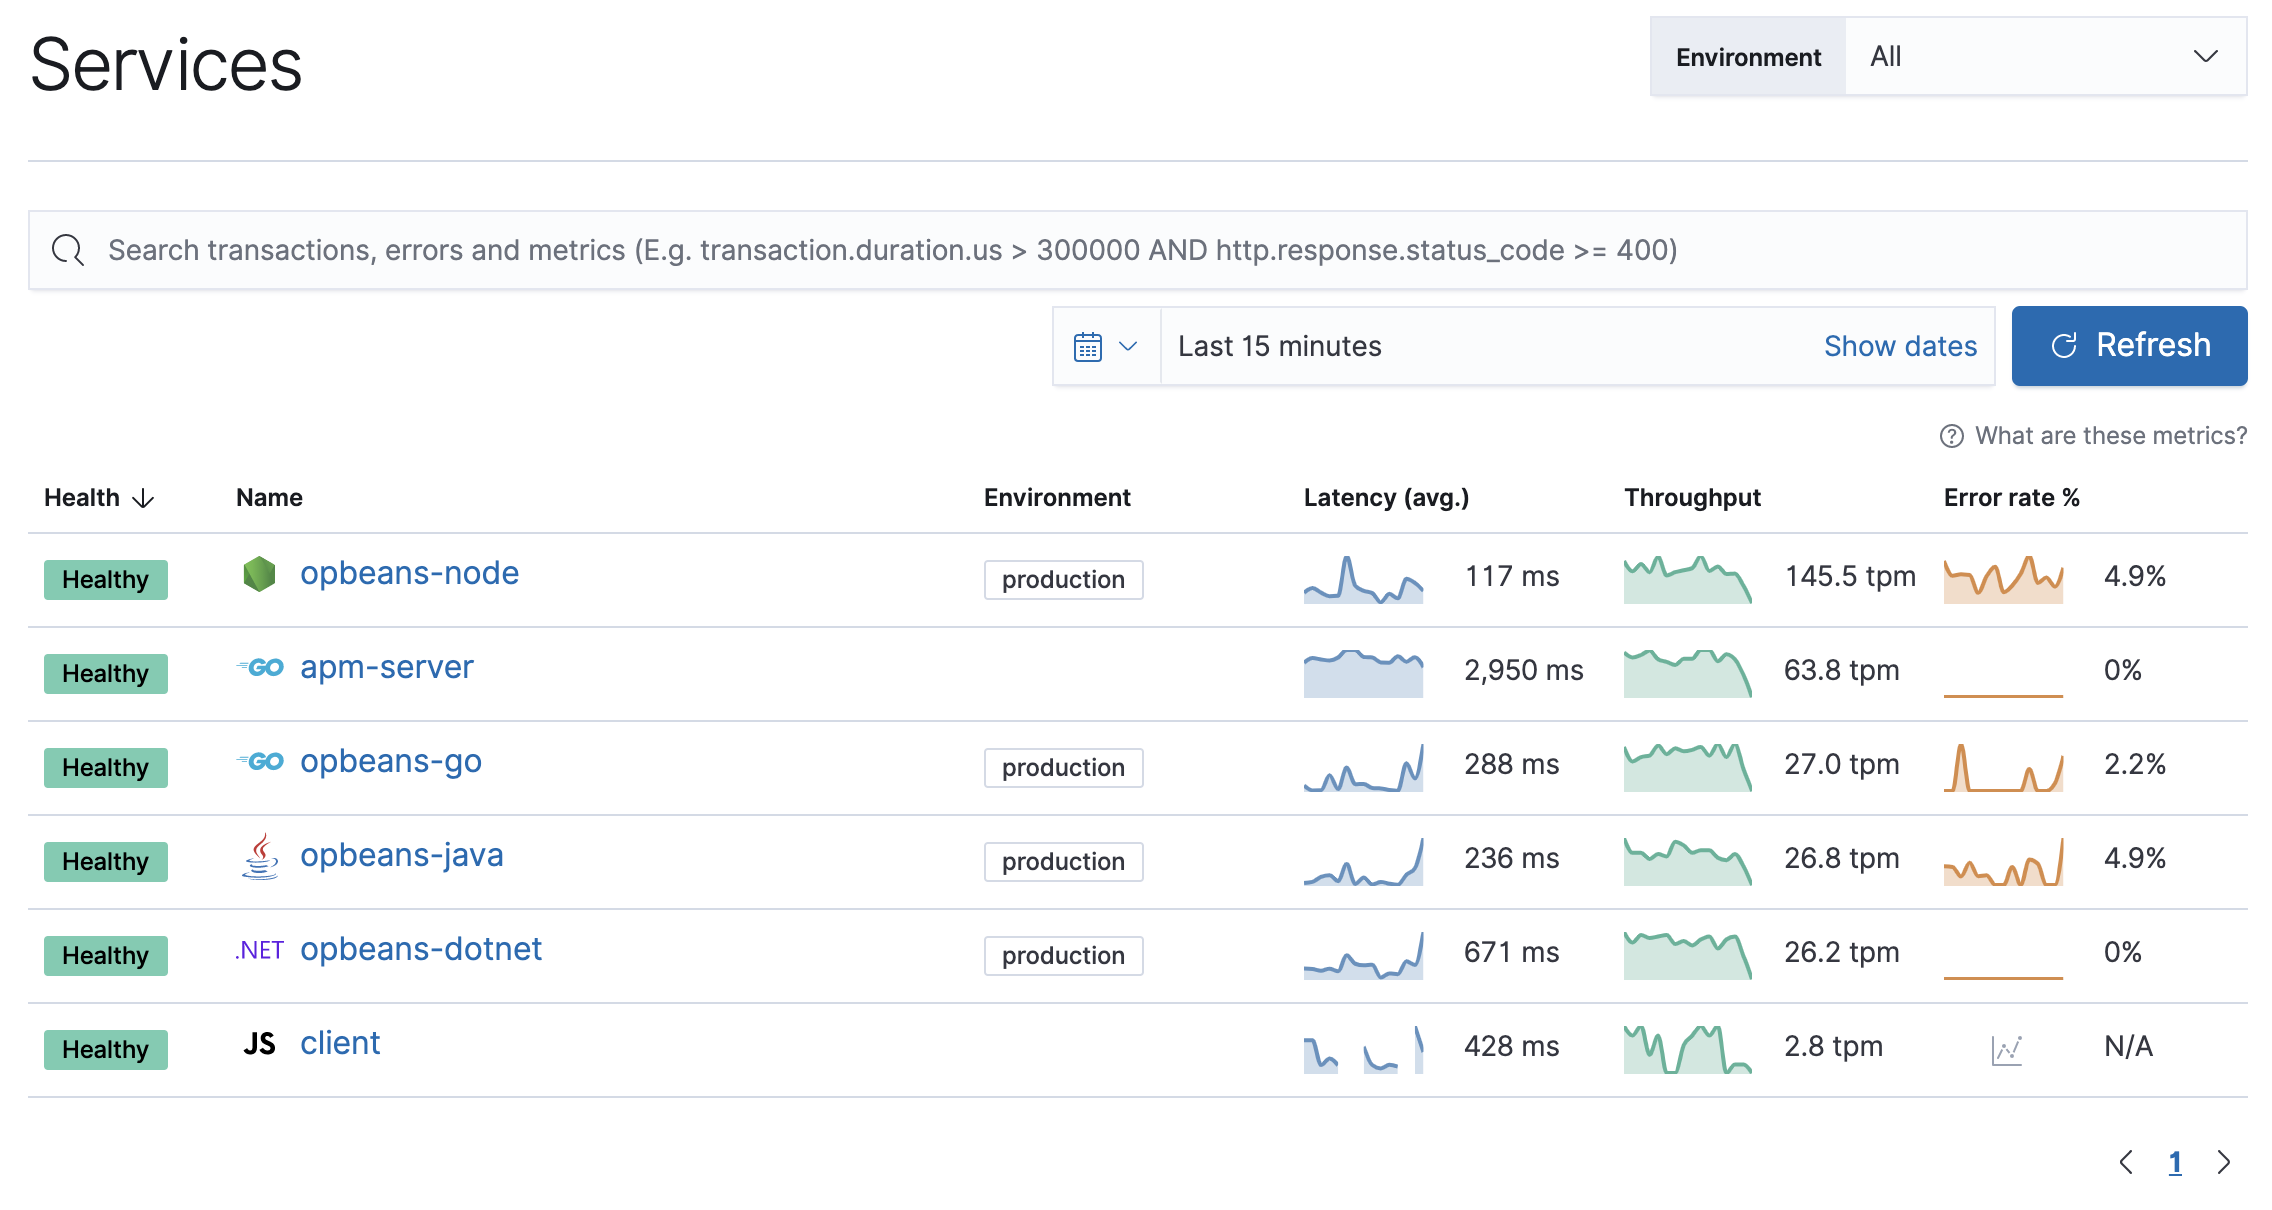
Step 3: View your data
editBack in Kibana, under Observability, select APM. You should see application performance monitoring data flowing into the Elastic Stack!
The built-in apm_user role is not compatible with the APM integration
as it only provides read access to apm-* indices.
For a list of indices users need access to, refer to
APM data streams
Not seeing any data? Review our list of common problems for helpful tips.
What’s next?
edit- Now that data is streaming into the Elastic Stack, take your investigation to a deeper level! Use Elastic Observability to unify your logs, metrics, uptime, and application performance data.
- Want to protect your endpoints from security threats? Try Elastic Security. Adding endpoint protection is just another integration that you add to the agent policy!
- Are your eyes bleary from staring at a wall of screens? Create alerts and find out about problems while sipping your favorite beverage poolside.
- Want Elastic to do the heavy lifting? Use machine learning to detect anomalies.
- Got everything working like you want it? Roll out your agent policies to other hosts by deploying Elastic Agents across your infrastructure!