WARNING: Version 6.0 of the Elastic Stack has passed its EOL date.
This documentation is no longer being maintained and may be removed. If you are running this version, we strongly advise you to upgrade. For the latest information, see the current release documentation.
How Monitoring Works
editHow Monitoring Works
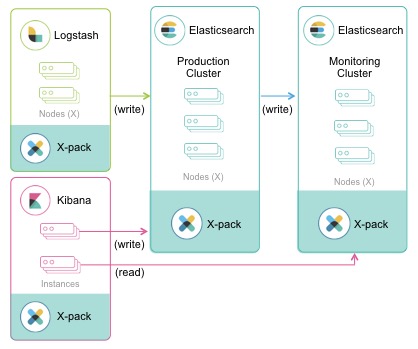
editMonitoring collects data from Elasticsearch nodes, Logstash nodes, and Kibana instances. The Elasticsearch cluster you are monitoring controls where the monitoring metrics for the entire stack are stored. By default, they are stored in local indices. In production, we strongly recommend using a separate monitoring cluster. Using a separate monitoring cluster prevents production cluster outages from impacting your ability to access your monitoring data. It also prevents monitoring activities from impacting the performance of your production cluster.
In general, the monitoring cluster and the clusters being monitored should be running the same version of the stack. A monitoring cluster cannot monitor production clusters running newer versions of the stack. If necessary, the monitoring cluster can monitor production clusters running older versions, but the versions cannot differ by more than one major version.
The following diagram illustrates a typical monitoring architecture with separate production and monitoring clusters:
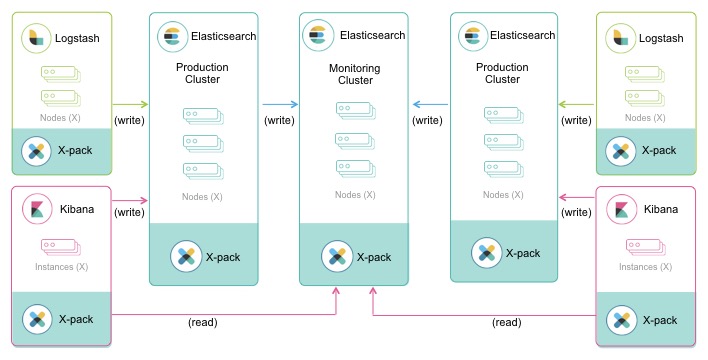
If you have at least a Gold license, you can route data from multiple production clusters to a single monitoring cluster:
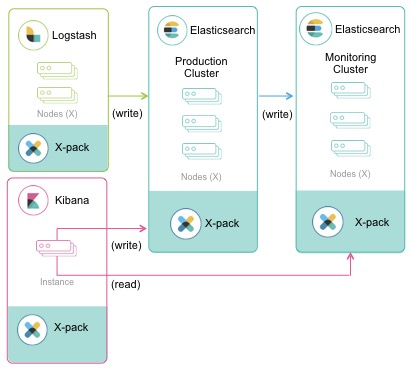
If Kibana is a regular part of your stack, you might want to create a dedicated Kibana instance for monitoring, rather than using a single Kibana instance to access both your production cluster and monitoring cluster: