WARNING: Version 5.6 of the Elastic Stack has passed its EOL date.
This documentation is no longer being maintained and may be removed. If you are running this version, we strongly advise you to upgrade. For the latest information, see the current release documentation.
Monitoring Kibana
editMonitoring Kibana
editTo monitor Kibana:
- Install X-Pack. See Installing X-Pack.
-
Kibana automatically sends metrics to the Elasticsearch cluster specified in the
elasticsearch.urlproperty inkibana.yml, which defaults tohttp://localhost:9200.You can set the
xpack.monitoring.elasticsearch.urlinkibana.ymlto specify the Elasticsearch cluster that Kibana should retrieve monitoring data from. This enables you to use a single Kibana instance to search and visualize data in your production cluster as well as monitor data sent to a dedicated monitoring cluster. - Restart Kibana.
-
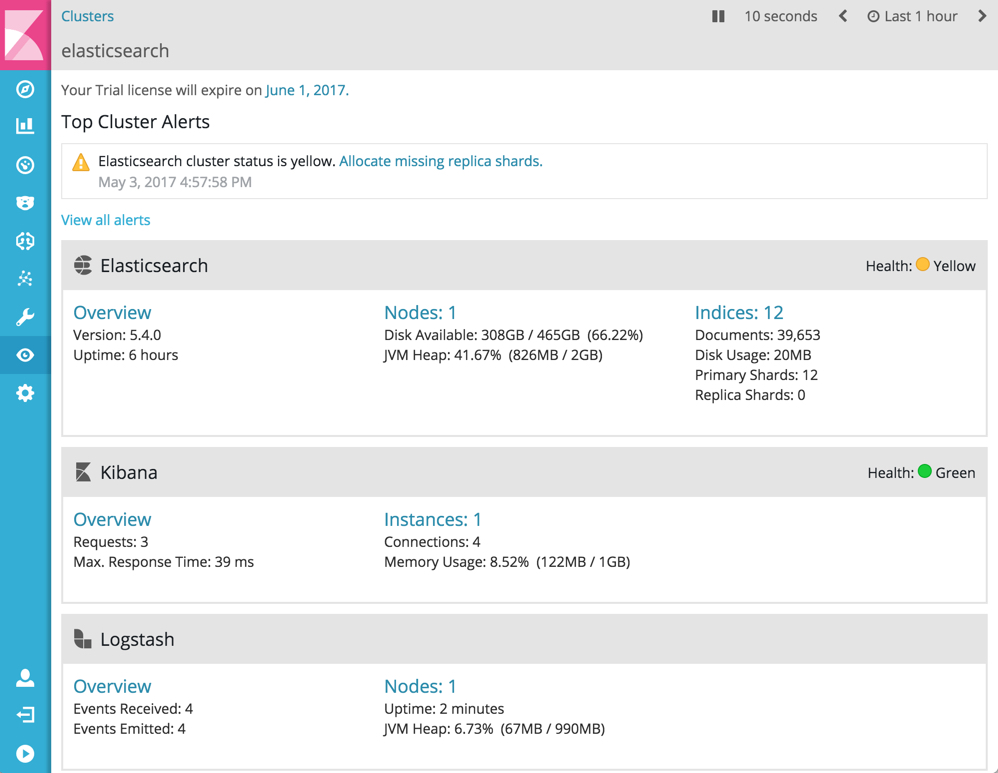
To verify your X-Pack monitoring configuration, point your web browser at your Kibana host, and select Monitoring from the side navigation. Metrics reported from Kibana should be visible in the Kibana section. When security is enabled, to view the monitoring dashboards you must log in to Kibana as a user who has both the
kibana_userandmonitoring_userroles. For example:POST /_xpack/security/user/stack-monitor { "password" : "changeme", "roles" : [ "kibana_user", "monitoring_user" ] }