WARNING: Version 5.3 of the Elastic Stack has passed its EOL date.
This documentation is no longer being maintained and may be removed. If you are running this version, we strongly advise you to upgrade. For the latest information, see the current release documentation.
Monitoring Logstash
editMonitoring Logstash
editTo monitor Logstash nodes:
-
Install X-Pack by running
bin/logstash-plugin installin the Logstash installation directory on each node you want to monitor:bin/logstash-plugin install x-pack
The plugin install script requires direct Internet access to download and install X-Pack. If your Logstash node doesn’t have Internet access, manually download and install X-Pack.
-
Configure your Logstash nodes to send metrics to your production Elasticsearch cluster using the
logstash.ymlfile. For more information about configuring your production Elasticsearch cluster for monitoring, see Setting up a Separate Monitoring Cluster.xpack.monitoring.elasticsearch.url: ["http://es-prod-node-1:9200", "http://es-prod-node-2:9200"] xpack.monitoring.elasticsearch.username: "logstash_system" xpack.monitoring.elasticsearch.password: "changeme"
If SSL/TLS is enabled on the production cluster, you must connect through HTTPS. If multiple URLs are specified, Logstash can round-robin requests to these production nodes.
The
logstash_systemuser is automatically added when you install X-Pack. Don’t forget to change the default passwords for all of the built in users. If X-Pack security is disabled on the production cluster, you can omit theusernameandpasswordfor the agent. -
If SSL/TLS is enabled on the production Elasticsearch cluster, specify the trusted CA certificate(s) that will be used to verify the identity of the nodes in the cluster.
To add a CA certificate to a Logstash node’s trusted certificates, you can specify the location of the PEM encoded certificate with the
casetting:xpack.monitoring.elasticsearch.ssl.ca: [ "/path/to/ca.crt" ]
Alternatively, you can configure trusted certificates using a truststore (a Java Keystore file that contains the certificates):
xpack.monitoring.elasticsearch.ssl.truststore.path: /path/to/file
xpack.monitoring.elasticsearch.ssl.truststore.password: password
Also, optionally, you can set up client certificate using a keystore (a Java Keystore file that contains the certificate):
xpack.monitoring.elasticsearch.ssl.keystore.path: /path/to/file
xpack.monitoring.elasticsearch.ssl.keystore.password: password
- Restart your Logstash nodes.
-
To verify your X-Pack monitoring configuration, point your web browser at your Kibana host, and select Monitoring from the side navigation. Metrics reported from your Logstash nodes should be visible in the Logstash section. When security is enabled, to view the monitoring dashboards you must log in to Kibana as a user who has the
kibana_userandmonitoring_userroles.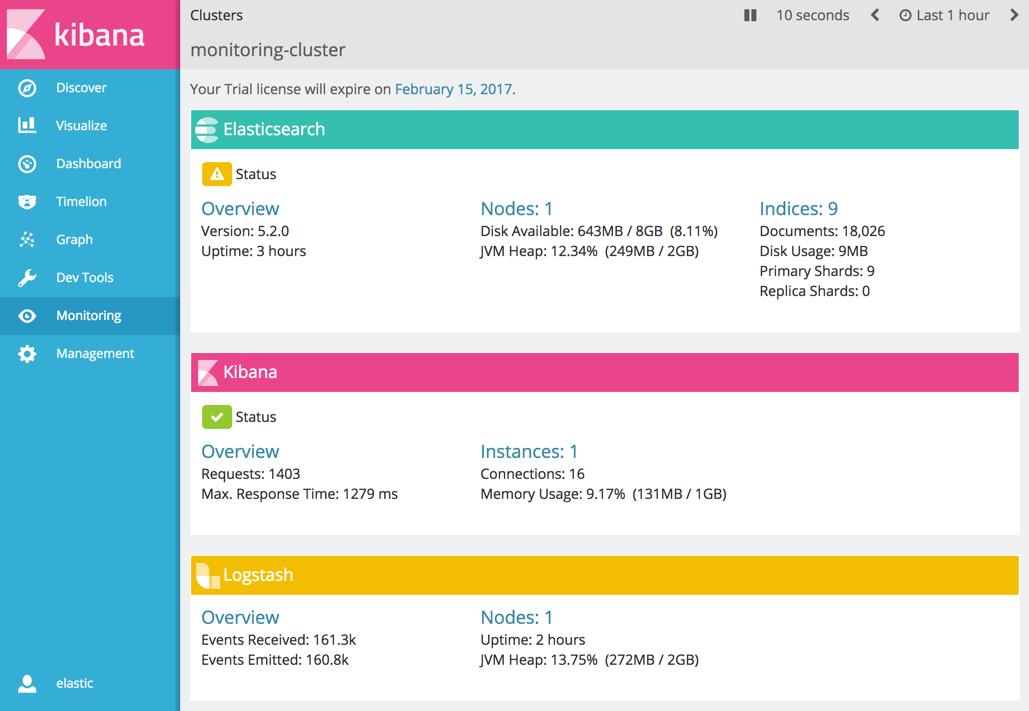

Re-enabling Logstash Monitoring After Upgrading
editWhen upgrading from older versions of X-Pack, the built-in logstash_system
user is disabled for security reasons. To resume monitoring, change the password and re-enable the logstash_system user.