Elastic Uptime overview
editElastic Uptime overview
editElastic Uptime allows you to monitor the availability and response times of applications and services in real time and to detect problems before they affect users.
Elastic Uptime can help you to understand uptime and response time characteristics for your services and applications. It can be deployed both inside and outside your organization’s network, so you can analyze problems from multiple vantage points.
Elastic Uptime uses these components: Heartbeat, Elasticsearch and Kibana.
Heartbeat
editHeartbeat is an open source data shipper that performs uptime monitoring. Elastic Uptime uses Heartbeat to collect monitoring data from your target applications and services, and ship it to Elasticsearch.
Elasticsearch
editElasticsearch is a highly scalable, open source, search and analytics engine. Elasticsearch can store, search, and analyze large volumes of data in near real-time. Elastic Uptime uses Elasticsearch to store monitoring data from Heartbeat in Elasticsearch documents.
Kibana
editKibana is an open source analytics and visualization platform designed to work with Elasticsearch. You can use Kibana to search, view, and interact with data stored in Elasticsearch. You can easily perform advanced data analysis and visualize your data in a variety of charts, tables, and maps.
The Elasticsearch Uptime app in Kibana provides a dedicated user interface for viewing uptime data and identifying problem areas.
Example deployments
edit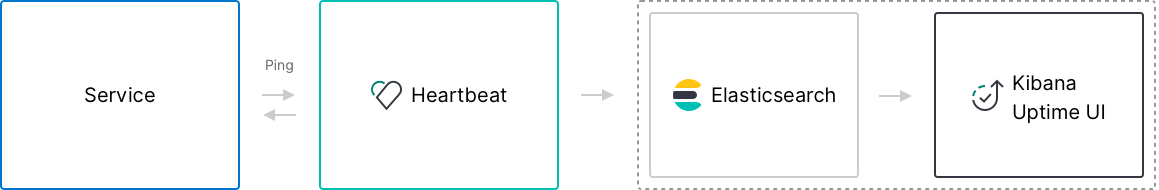
In this simple deployment, a single instance of Heartbeat is deployed at a single monitoring location to monitor a single service. The Heartbeat instance sends the monitoring data to Elasticsearch. Then you can use the Uptime app in Kibana to view the data from Heartbeat and determine the status of the service.
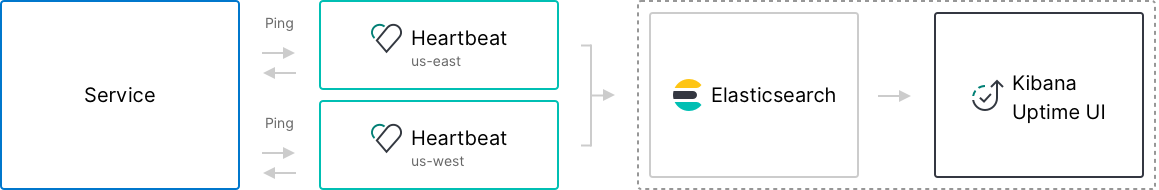
In this deployment, two instances of Heartbeat are deployed at two different monitoring locations. Both instances monitor the same service. The Heartbeat instances send the monitoring data to Elasticsearch. As before, you can use the Uptime app in Kibana to view the Heartbeat data and determine the status of the service. When a failure occurs, the multiple monitoring locations enable you to pinpoint the area in which the failure has occurred.