Write investigation guides
Investigation guides are Markdown documents attached to detection rules that help analysts triage, analyze, and respond to alerts. A well-written guide reduces mean time to respond by giving analysts the context and queries they need without leaving the alert details flyout.
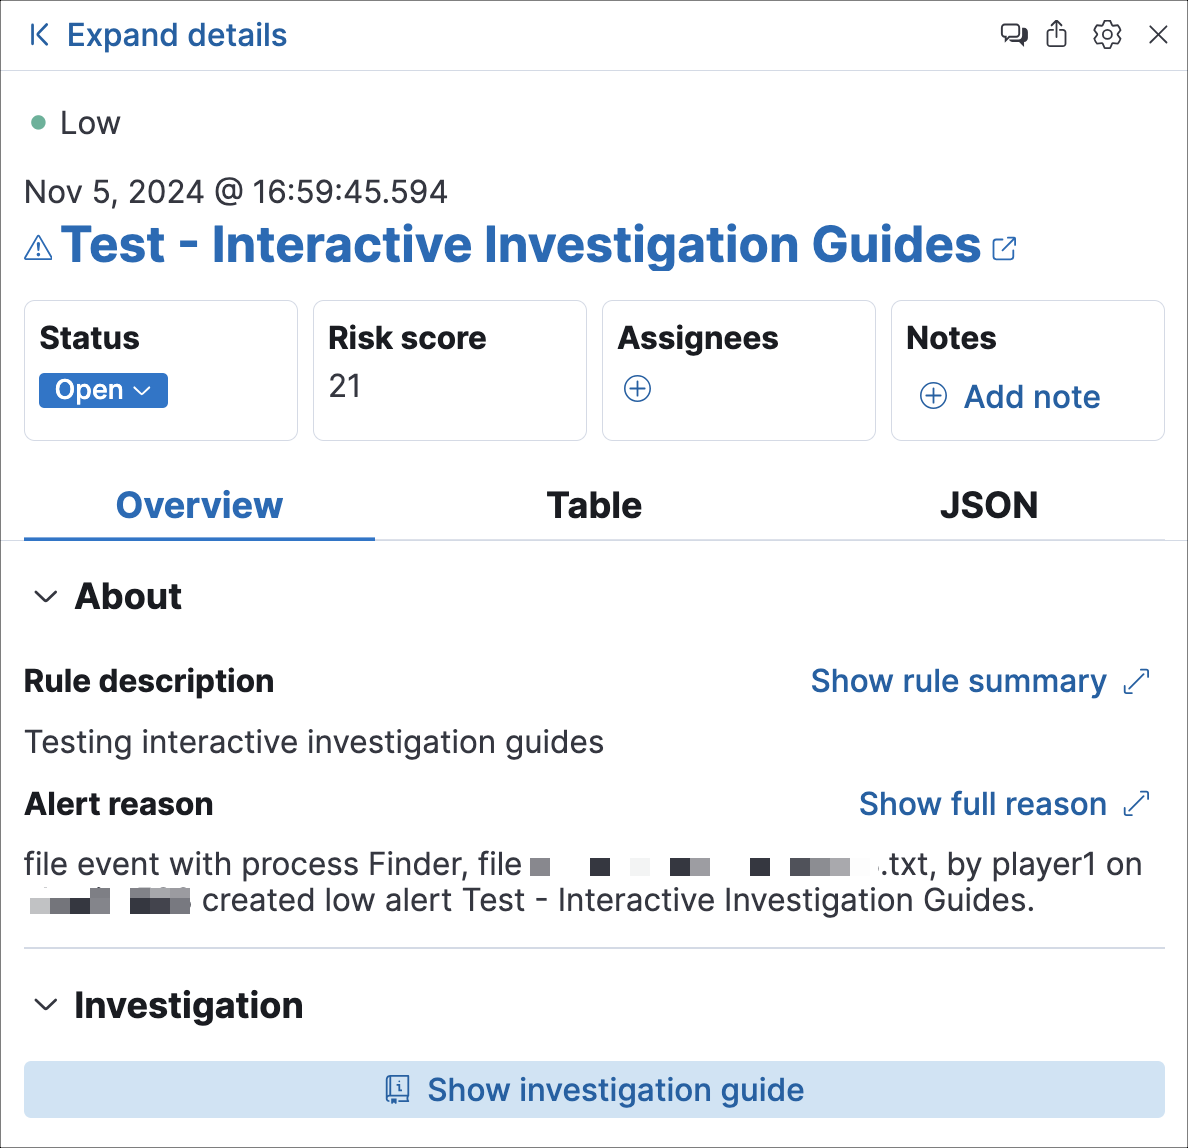
You author an investigation guide in the Investigation guide Markdown editor, which is available in the rule's advanced settings (under the About step when creating a rule, or the About tab when editing one). The guide renders in the Investigation tab of the alert details flyout whenever an analyst opens an alert produced by that rule.
With an Enterprise subscription on Elastic Stack or Security Analytics Complete on Serverless, you can edit investigation guides for prebuilt rules directly. Otherwise, duplicate the prebuilt rule first, then edit the duplicate's investigation guide.
The investigation guide editor supports standard Markdown with several extensions. Use the toolbar above the editor for quick formatting, or write the syntax directly.
| Syntax | Result |
|---|---|
# Heading |
Section heading (levels 1–6) |
**bold** |
Bold text |
*italic* |
Italic text |
`code` |
Inline code |
[text](url) |
Hyperlink |
- item |
Unordered list |
1. item |
Ordered list |
> quote |
Block quote |
--- |
Horizontal rule |
 |
Image |
``` |
Fenced code block |
\| col \| col \| |
Table |
Use Markdown headings to break the guide into clear sections (for example, Triage, Analysis, Response) so analysts can scan quickly.
Effective investigation guides share several characteristics:
- Start with context, not commands
- Open with a one- or two-sentence summary of what the rule detects and why it matters. Analysts who understand the threat make better decisions.
- Structure the guide around a workflow
-
Organize content into sequential sections:
- Triage: Quick checks to confirm whether the alert is a true positive. Include field values to inspect and known false-positive conditions.
- Analysis: Deeper investigation steps such as Timeline queries, Osquery lookups, and correlated data sources.
- Response: Recommended actions if the alert is confirmed, including escalation paths and containment steps.
- Reference alert fields directly
- Use double curly brackets (for example,
{{host.name}},{{user.name}}) to surface dynamic alert data in Timeline query buttons, making the guide immediately actionable. - Keep it scannable
- Use bullet lists, bold key terms, and short paragraphs. Analysts read investigation guides under time pressure.
- Link to related resources
- Include links to relevant dashboards, runbooks, or external threat intelligence references so analysts don't have to search for them.
You can embed interactive query buttons that open pre-populated Timeline investigations directly from an alert. Each button runs a query using alert field values and hard-coded literals, and displays the number of matching event documents.
Timeline query buttons require a Platinum subscription or higher on Elastic Stack, or Security Analytics Essentials or higher on Serverless.
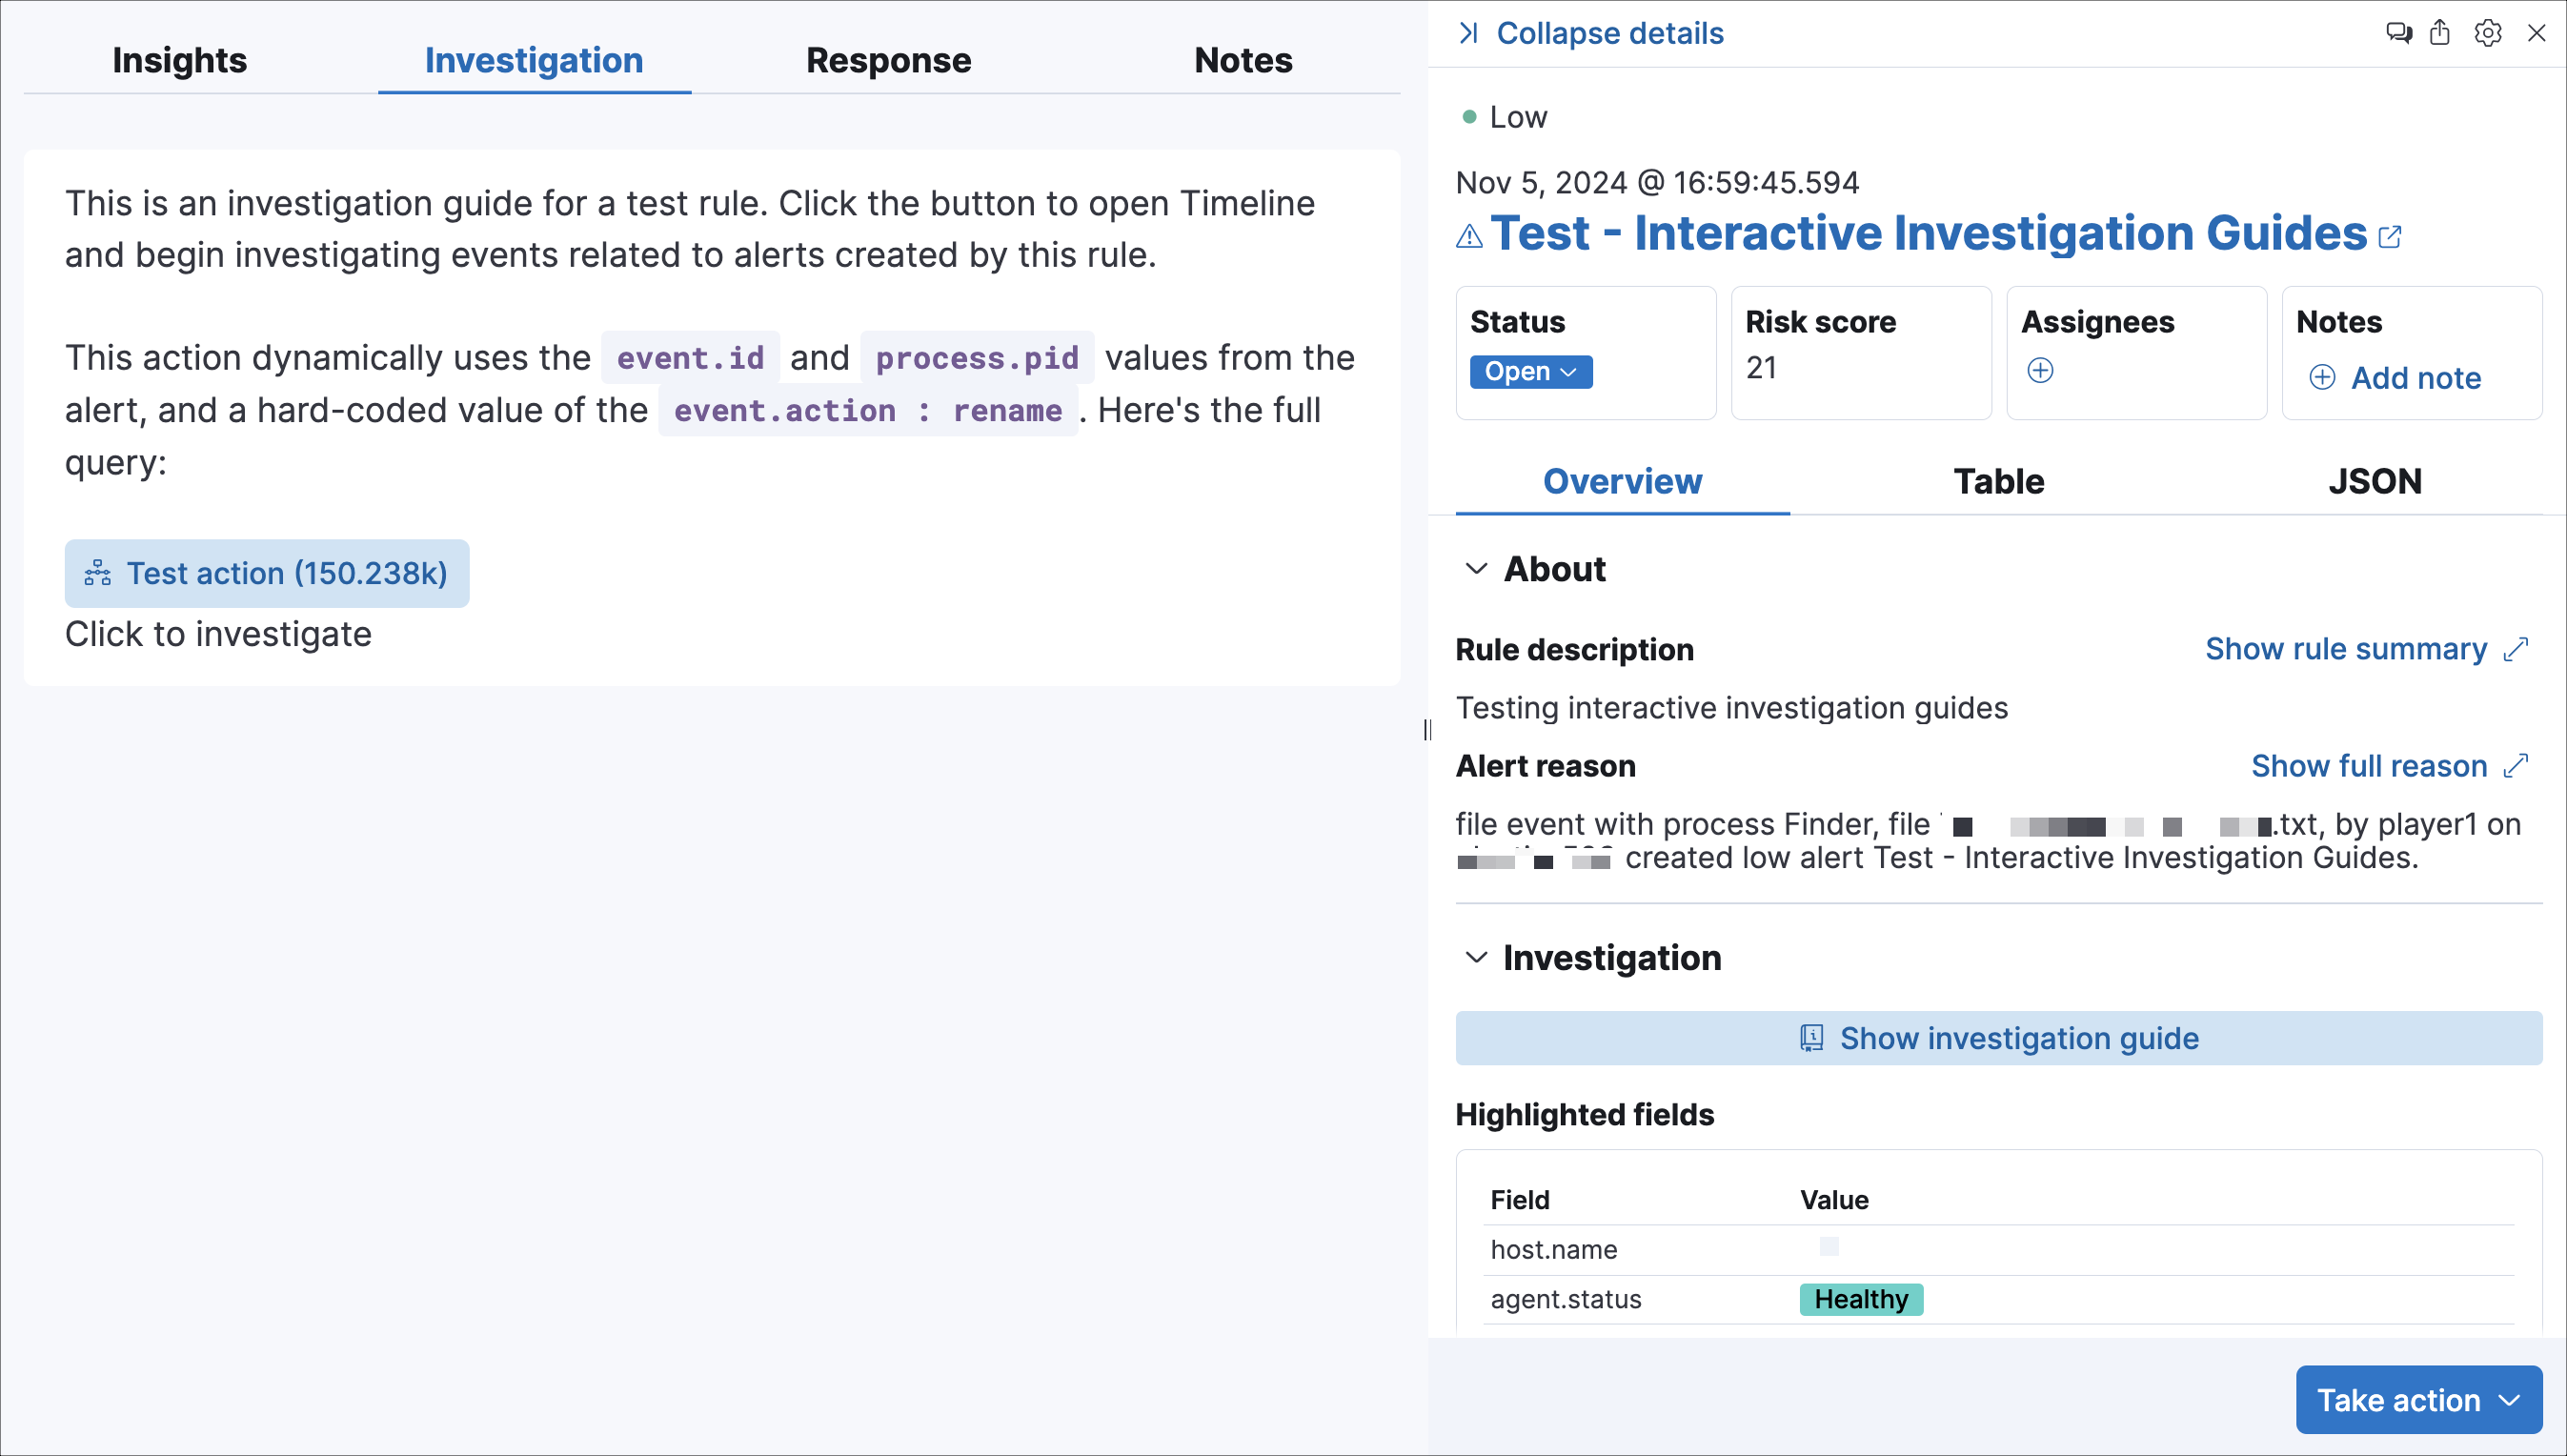
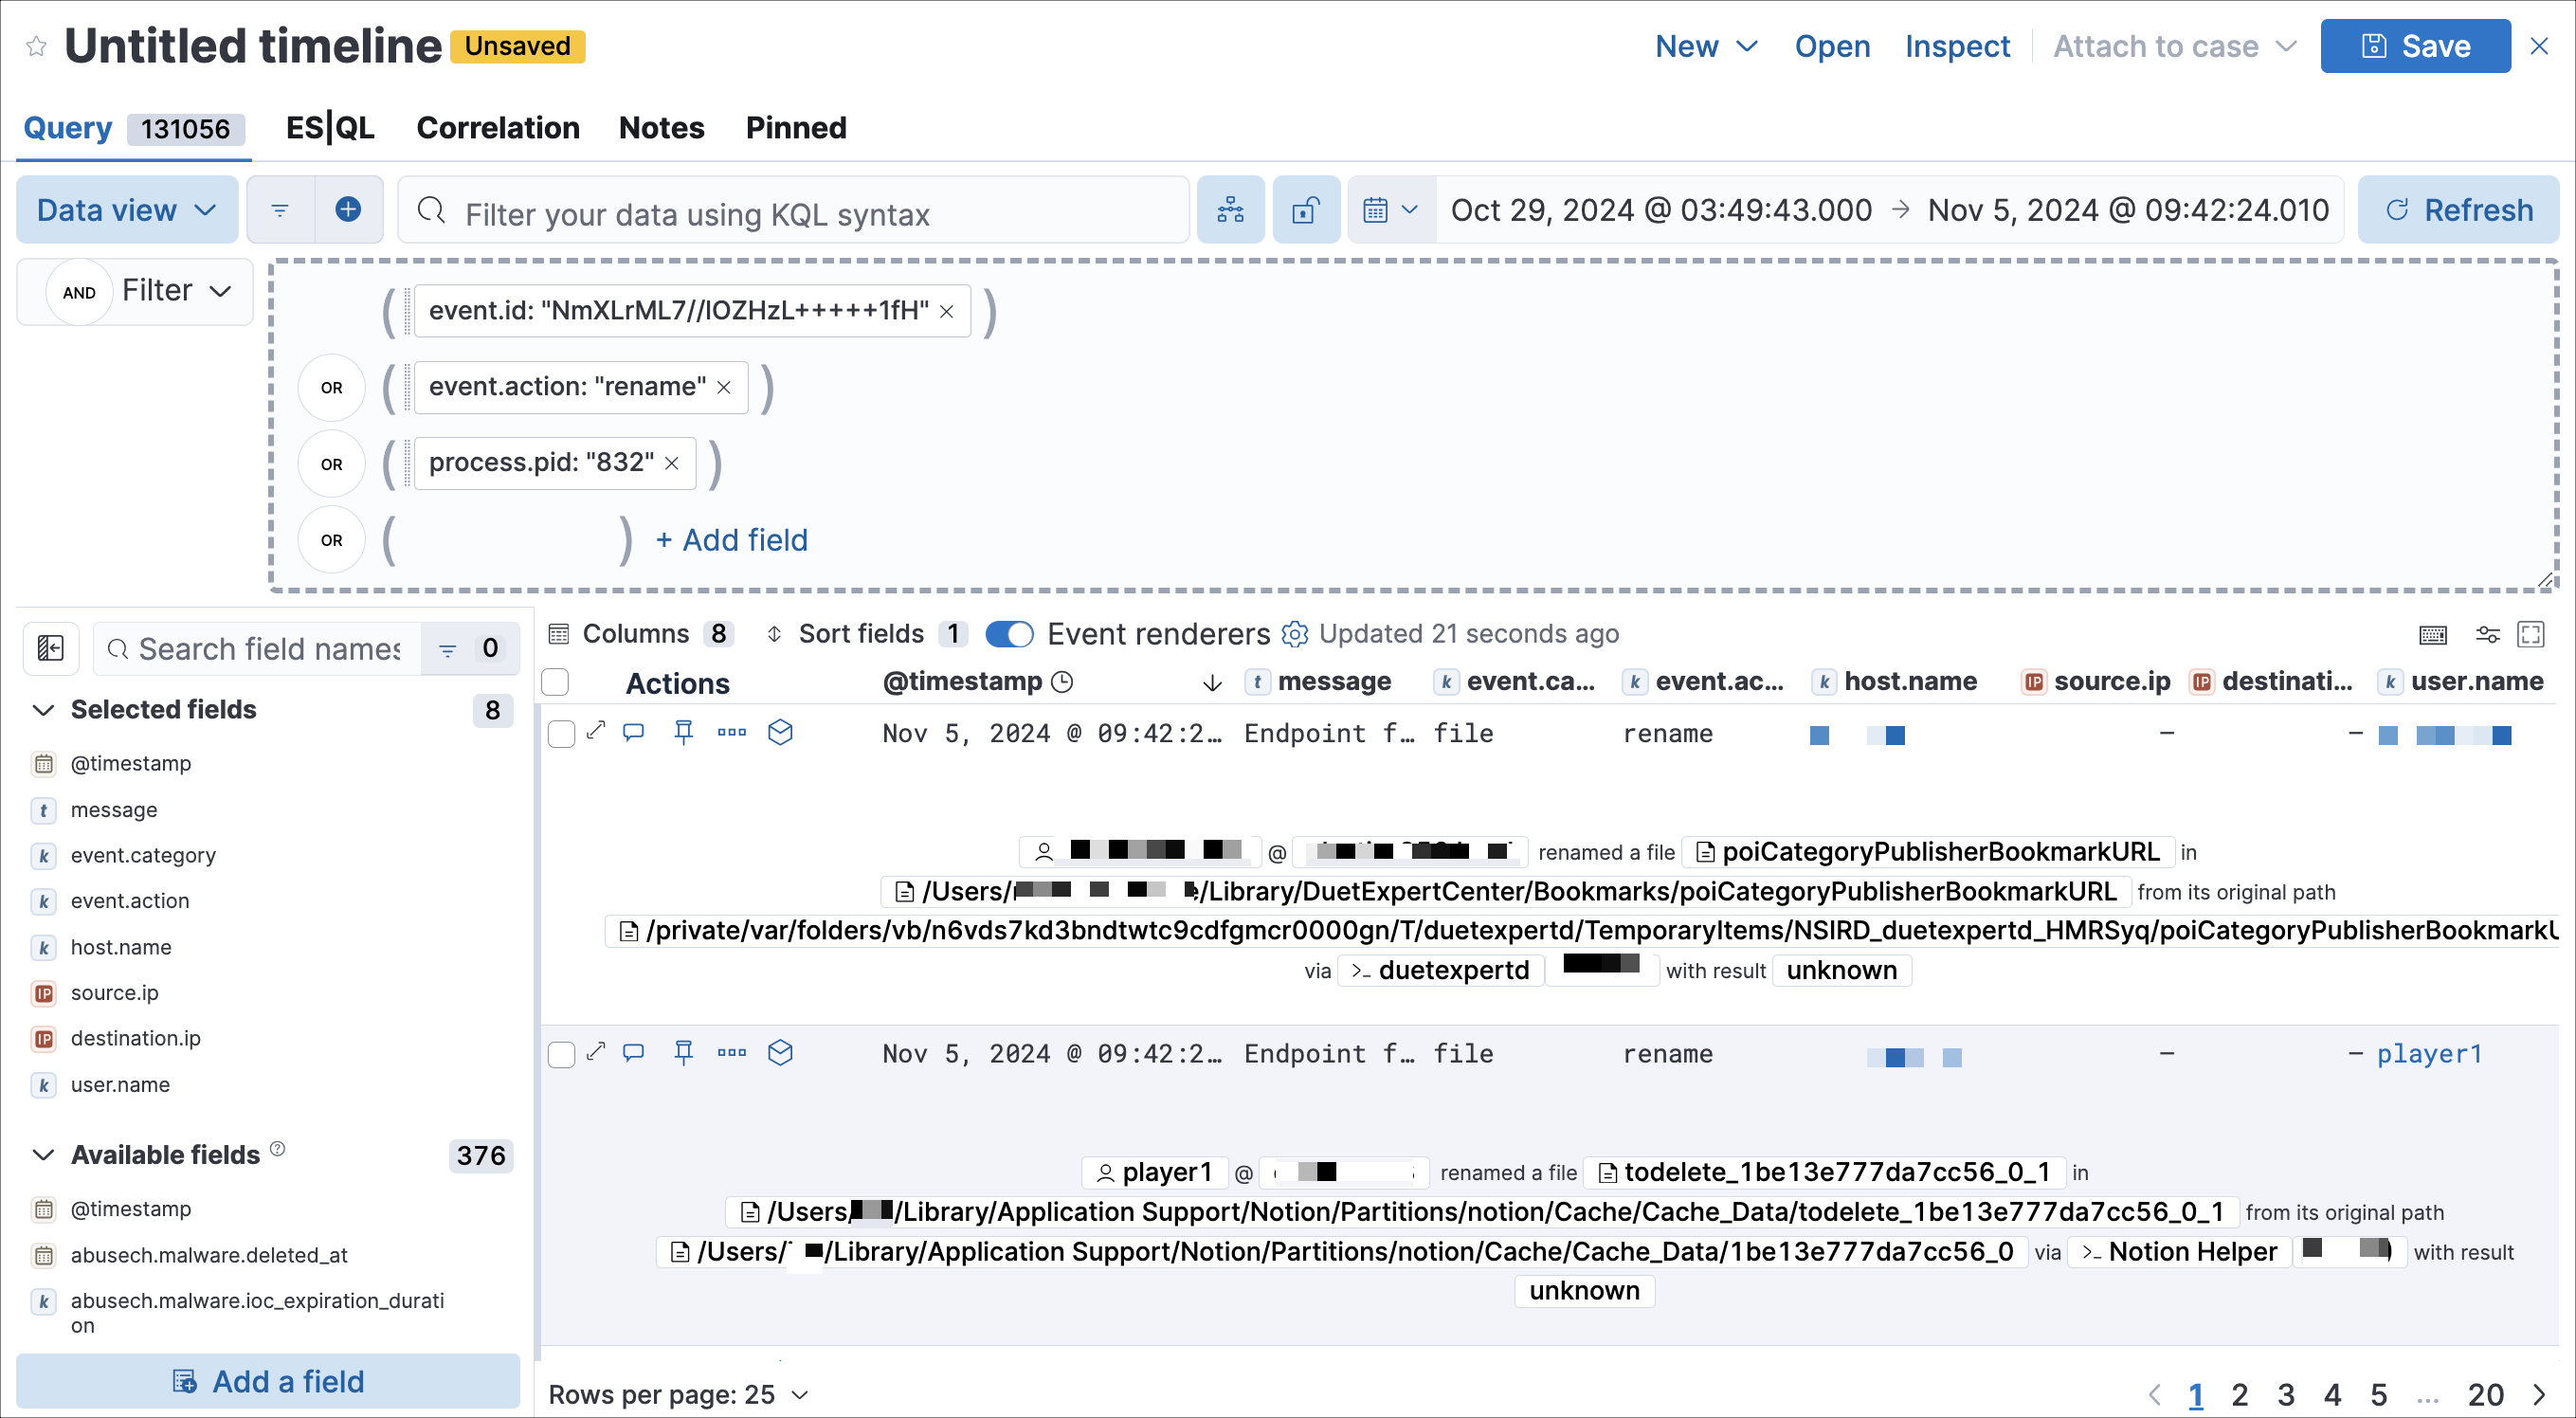
Click a query button to load the query in Timeline automatically.
Open the Investigation guide Markdown editor (in the rule's Advanced settings).
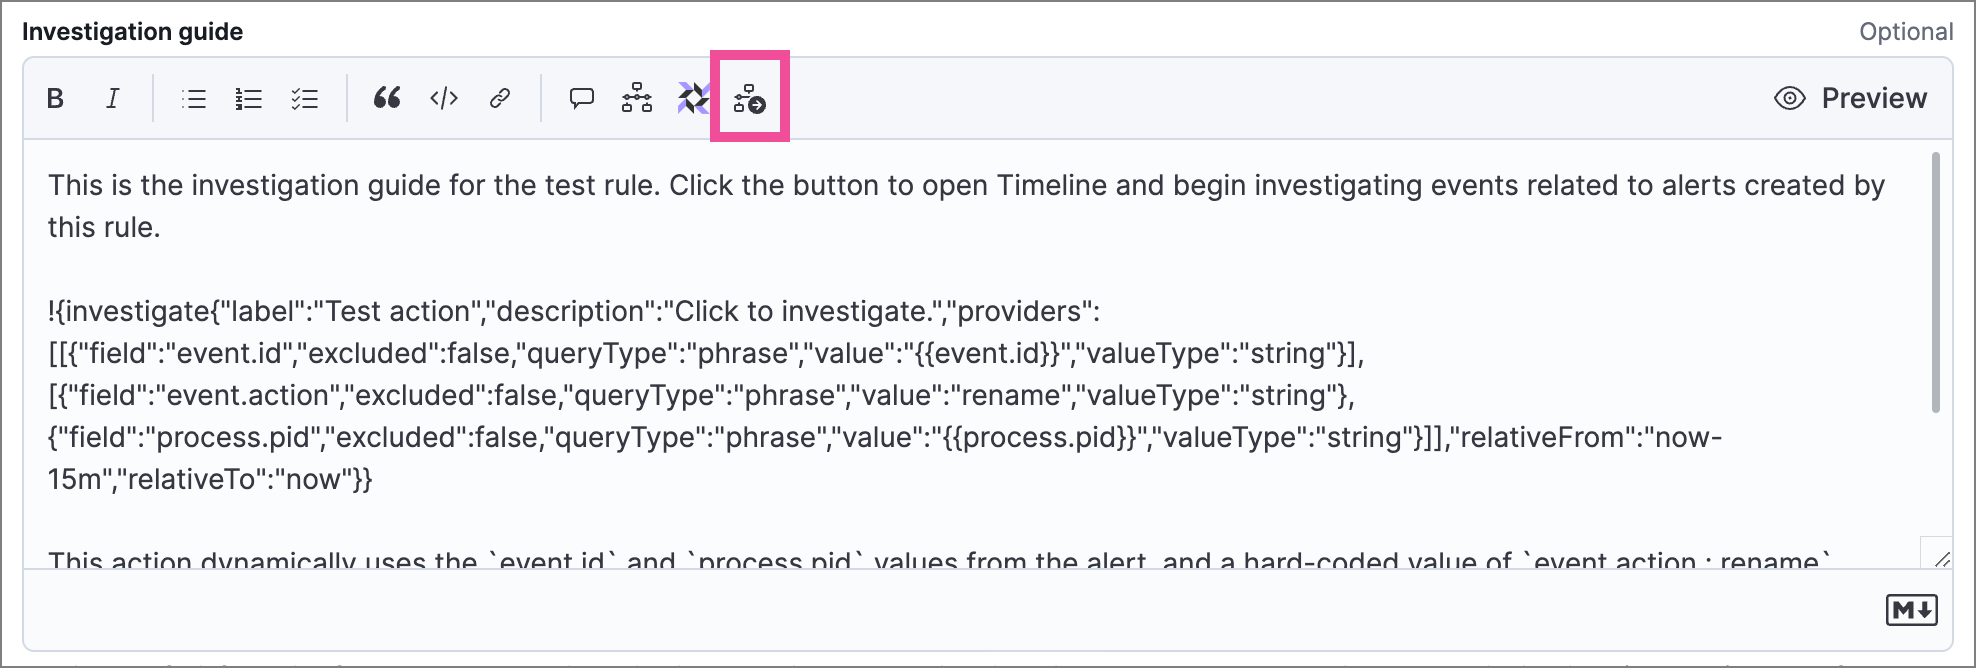
Place the cursor where you want the button to appear, then select the investigate icon in the toolbar. The Add investigation query builder form appears.
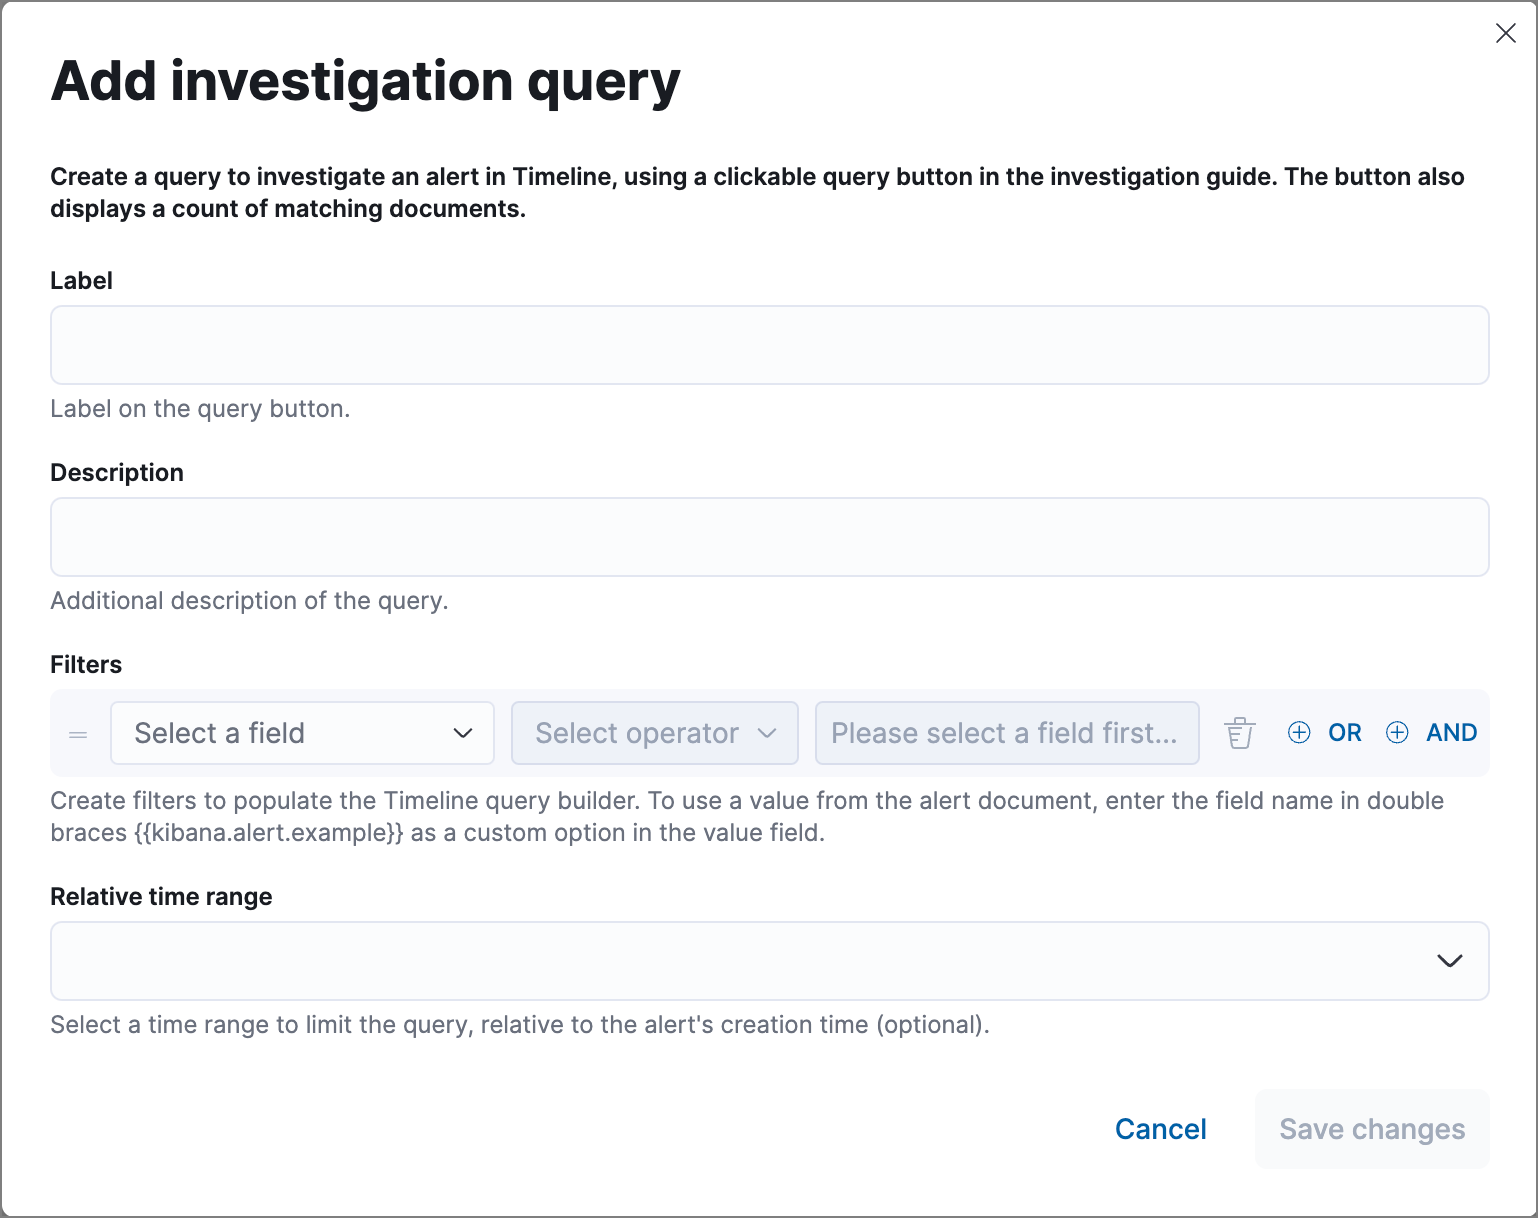
Complete the form:
Label: Text displayed on the button.
Description: (Optional) Additional text shown with the button.
Filters: Select fields, operators, and values to build the query. Click OR or AND to create multiple filters and define their relationships.
To use a field value from the alert as a query parameter, enter the field name surrounded by double curly brackets (for example,
{{kibana.alert.example}}) as a custom option for the filter value.
Relative time range: (Optional) A time range that limits the query relative to the alert's creation time.
Click Save changes. The syntax is added to the editor.
NoteTo modify a query button, either edit the syntax directly in the editor (refer to the syntax reference below) or delete the syntax and recreate it using the builder form.
Save and enable the rule.
The following syntax defines a query button in an investigation guide.
| Field | Description |
|---|---|
!{investigate{ }} |
The container object holding all the query button's configuration attributes. |
label |
Identifying text on the button. |
description |
Additional text included with the button. |
providers |
A two-level nested array that defines the query to run in Timeline. Items in the outer level are joined by an OR relationship, and items in the inner level are joined by an AND relationship. Each item is defined by these attributes: field (field name), excluded (whether the result is excluded), queryType (filter operator, such as phrase or range), value (a literal value or an alert field name in double curly brackets), and valueType (data type such as string or boolean). |
relativeFrom, relativeTo |
(Optional) The start and end of a relative time range for the query. Times are relative to the alert's creation time, represented as now in date math format. For example, "relativeFrom": "now-15m", "relativeTo": "now". |
Some characters must be escaped with a backslash, such as \" for a quotation mark and \\ for a literal backslash. Divide Windows paths with double backslashes (for example, C:\\Windows\\explorer.exe), and paths that already include double backslashes might require four backslashes for each divider. A clickable error icon
displays below the Markdown editor if there are any syntax errors.
!{investigate{
  "label": "Test action",
  "description": "Click to investigate.",
  "providers": [
    [
      {"field": "event.id", "excluded": false, "queryType": "phrase", "value": "{{event.id}}", "valueType": "string"}
    ],
    [
      {"field": "event.action", "excluded": false, "queryType": "phrase", "value": "rename", "valueType": "string"},
      {"field": "process.pid", "excluded": false, "queryType": "phrase", "value": "{{process.pid}}", "valueType": "string"}
    ]
  ],
  "relativeFrom": "now-15m",
  "relativeTo": "now"
}}
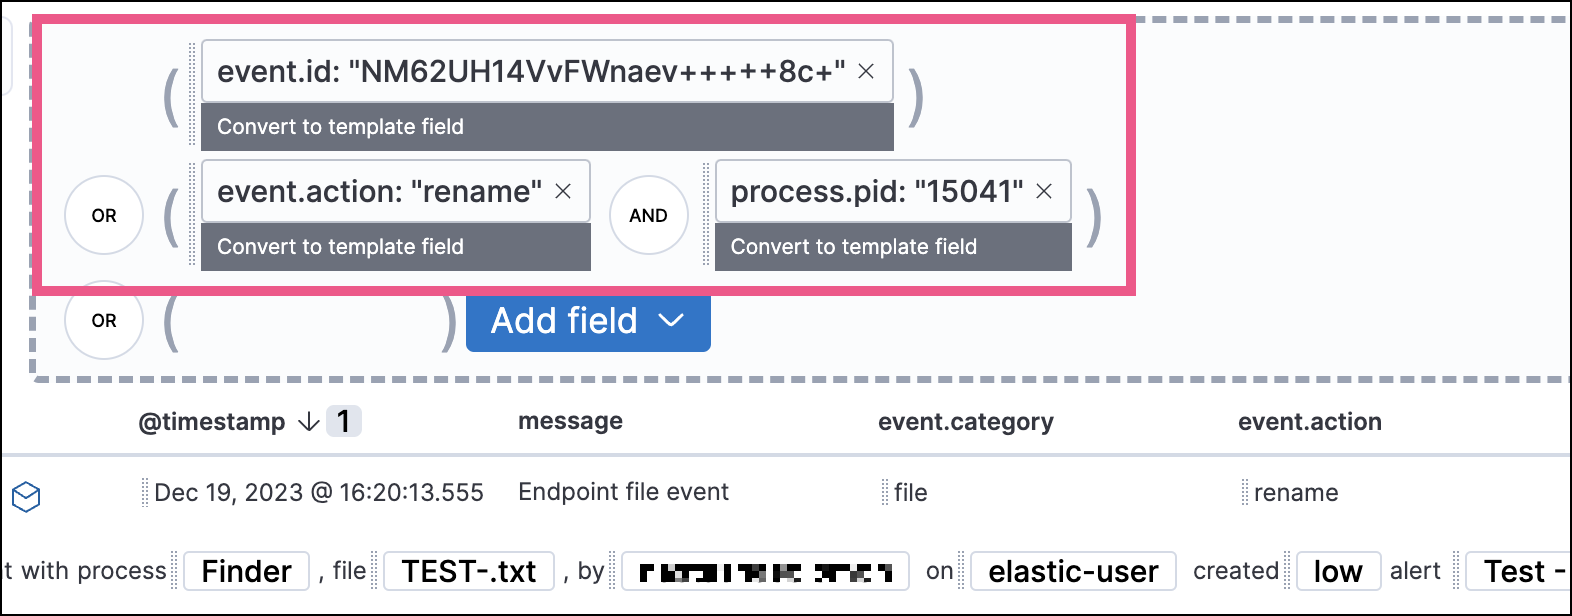
This creates the following Timeline query:
(event.id : <alert value>)
OR (event.action : "rename" AND process.pid : <alert value>)

When viewing an investigation guide outside the context of a specific alert (such as on a rule's details page), queries open as Timeline templates, and parameter fields are treated as Timeline template fields.
You can embed Osquery buttons that let analysts run live queries against Elastic Agents directly from the investigation guide. This is useful for gathering host-level context, such as running processes, installed software, or open network connections, while triaging an alert.
- The Osquery manager integration must be installed.
- Elastic Agent's status must be
Healthy. Refer to Common problems with Fleet and Elastic Agent if it isn't. - In Elastic Stack, your role must have Osquery feature privileges.
- In Serverless, you must have the appropriate user role.
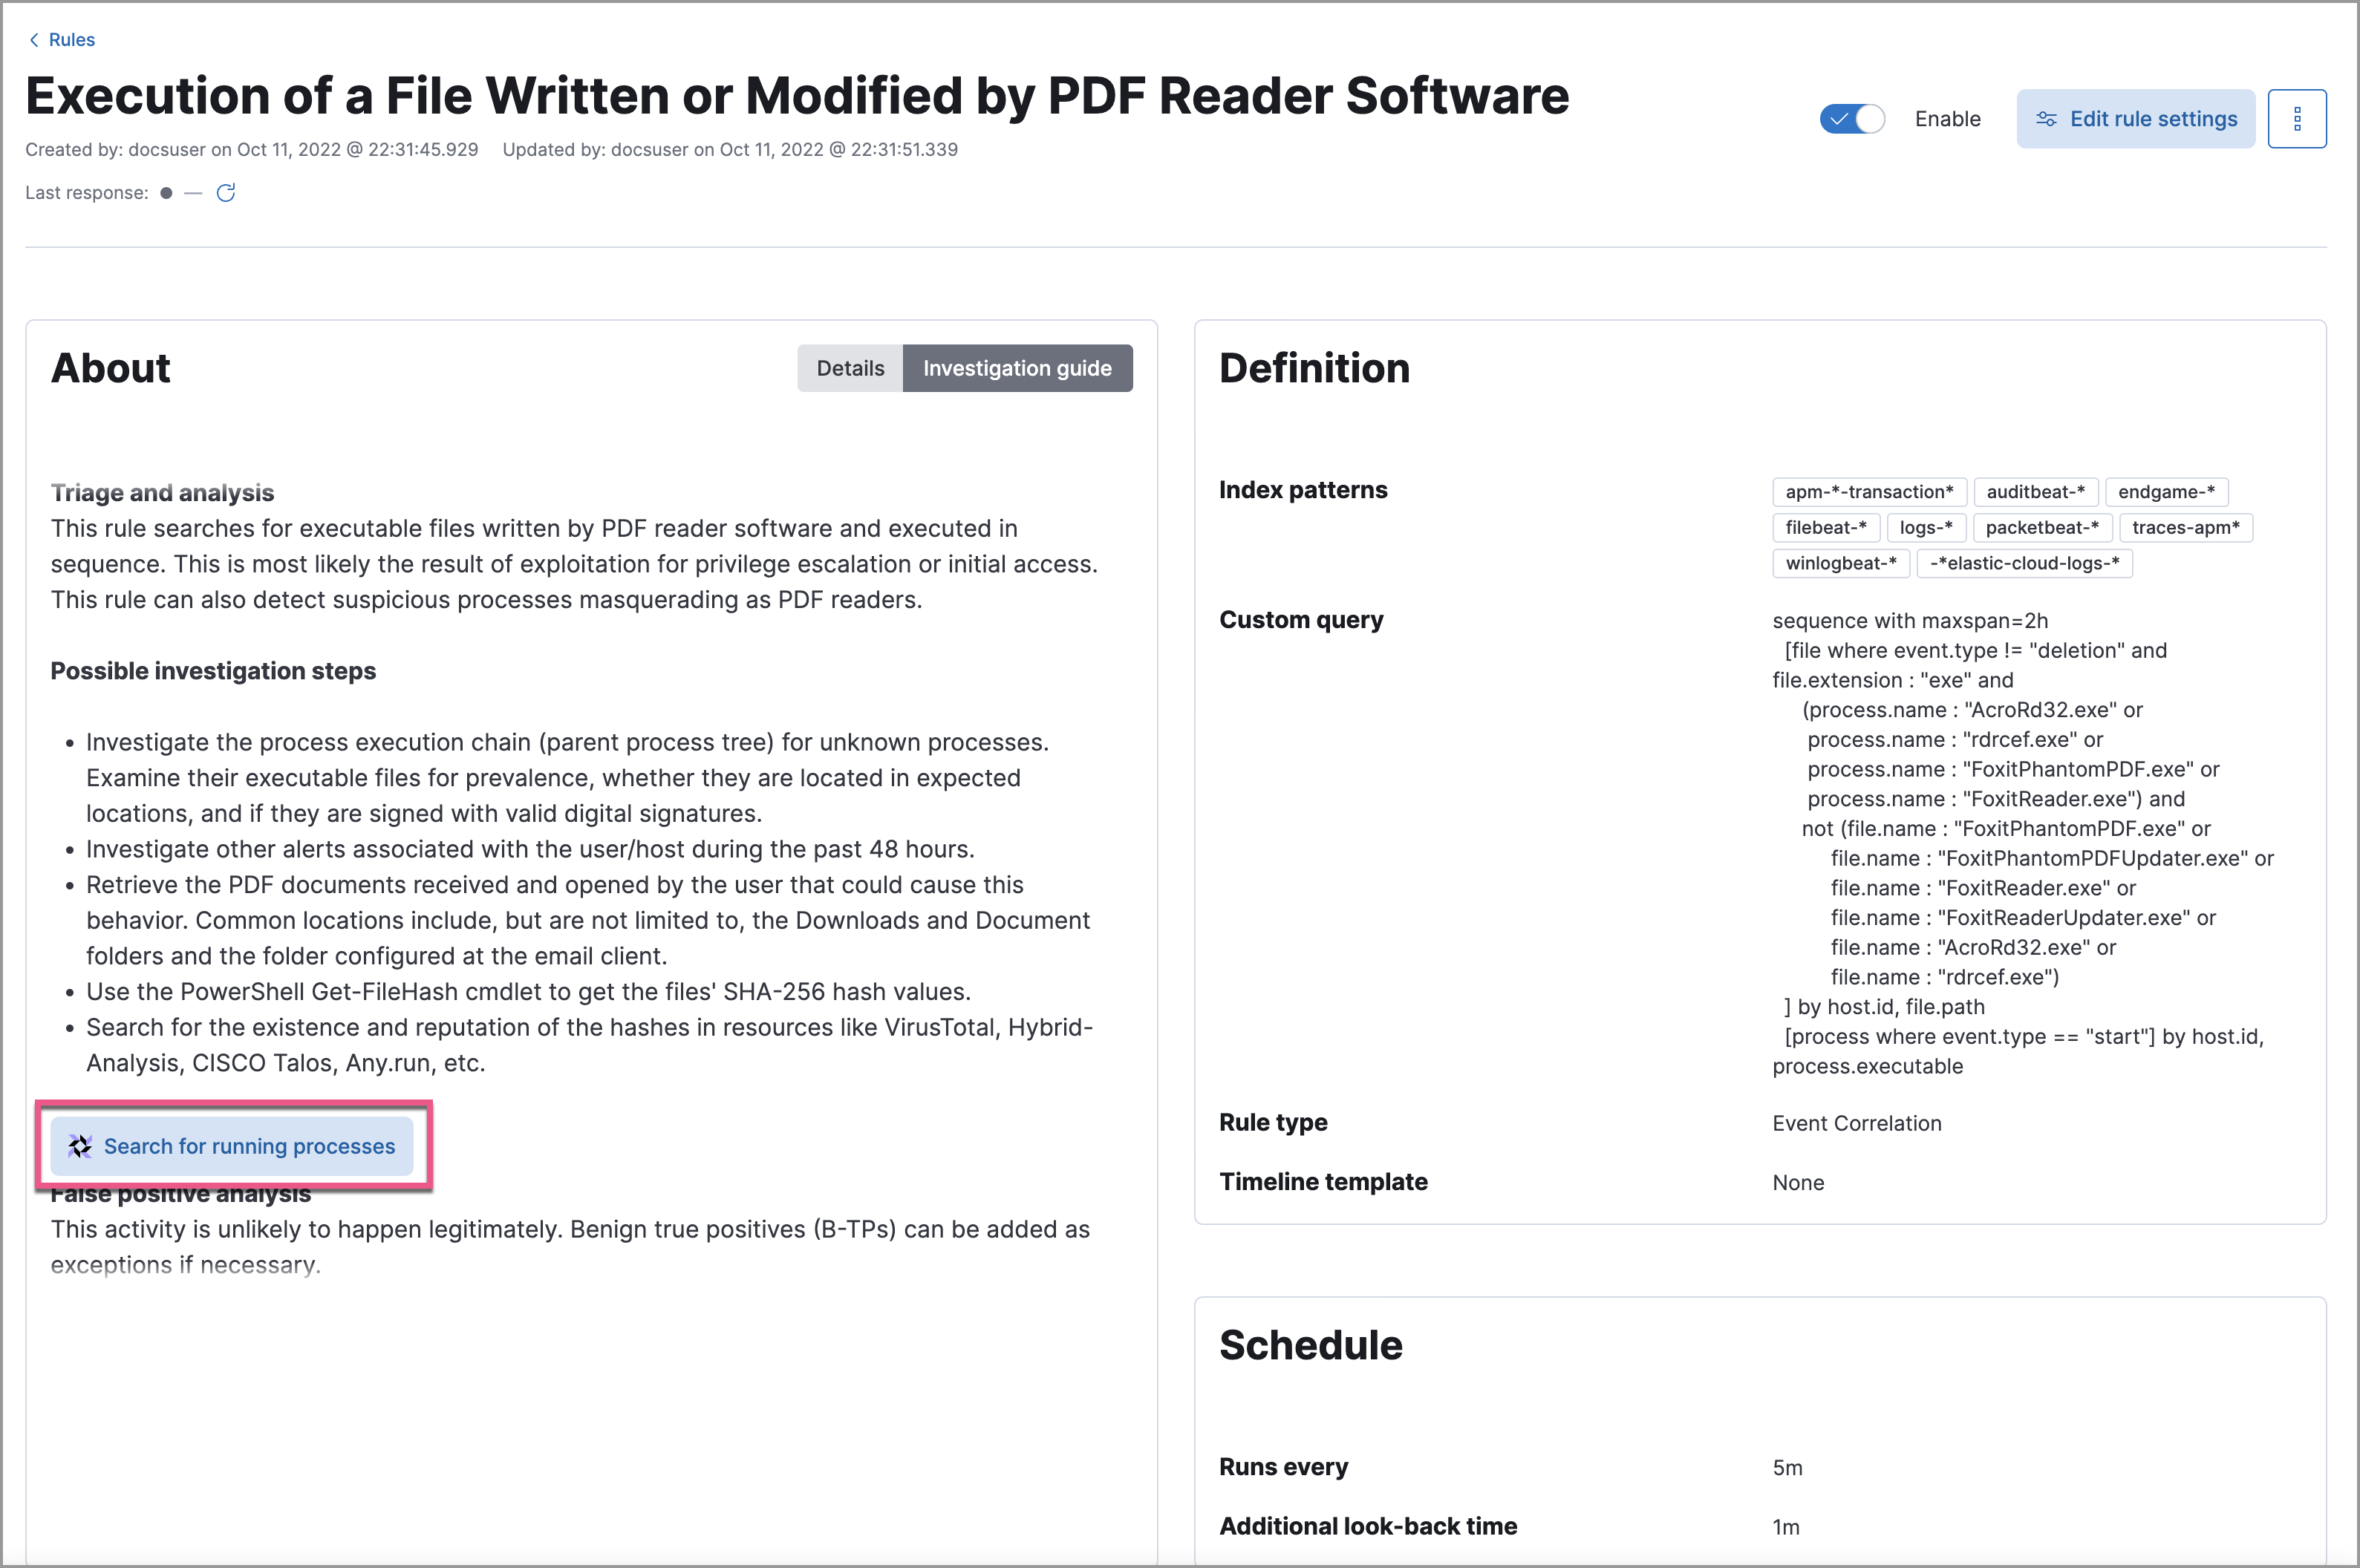
Open the Investigation guide Markdown editor (in the rule's Advanced settings).
In the toolbar, click the Osquery button .
Add a descriptive label (for example,
Search for executables).Select a saved query or enter a new one.
TipUse placeholder fields to dynamically add existing alert data to your query.
Expand the Advanced section to set a timeout period for the query and view or set mapped ECS fields included in the results (optional).
NoteOverwriting the query's default timeout period allows you to support queries that take longer to run. The default and minimum supported value for the Timeout field is
60. The maximum supported value is900.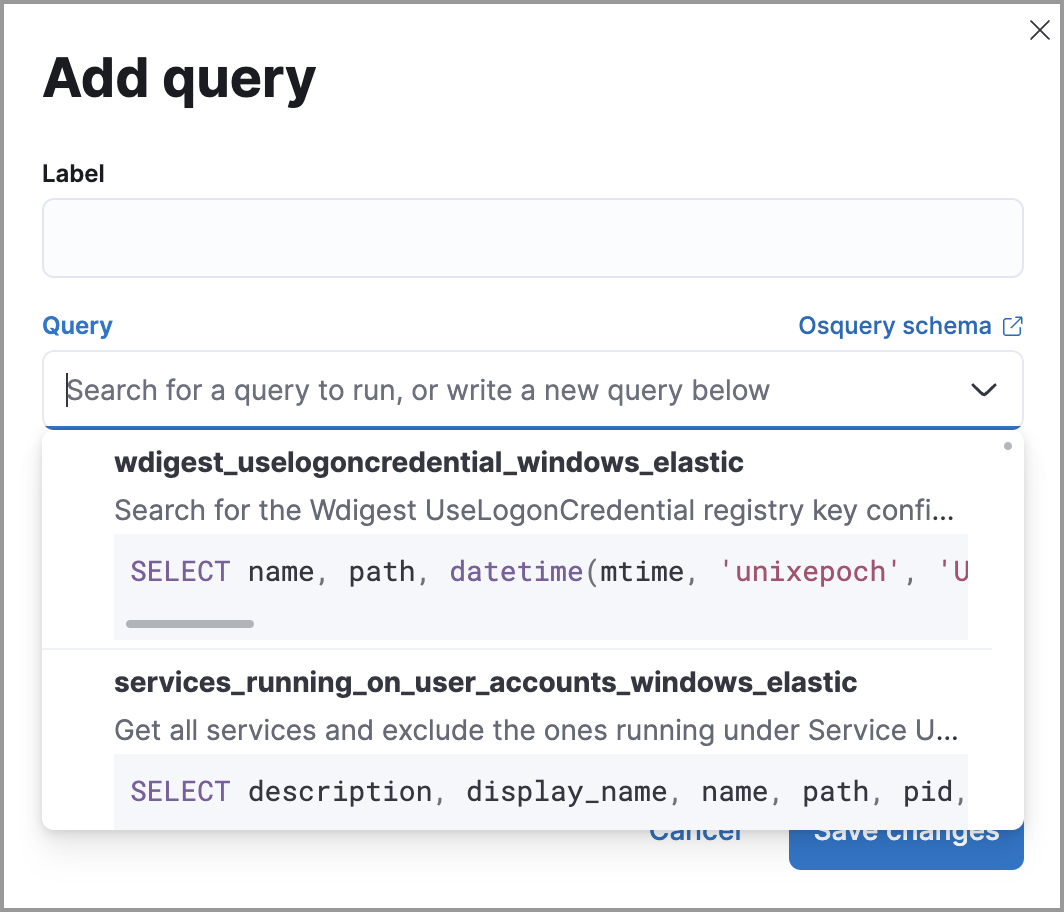
Click Save changes to add the query to the rule's investigation guide.
Open an alert's details flyout and go to the Investigation tab.
Click the Osquery button. The Run Osquery pane opens with the Query field autofilled.
- Select one or more Elastic Agents or groups to query. Start typing in the search field to get suggestions for Elastic Agents by name, ID, platform, and policy.
- (Optional) Expand the Advanced section to set a timeout period and view or set mapped ECS fields.
Click Submit to run the query. Results display in the flyout.
NoteRefer to Examine Osquery results for more about query results.
(Optional) Click Save for later to save the query for future use.
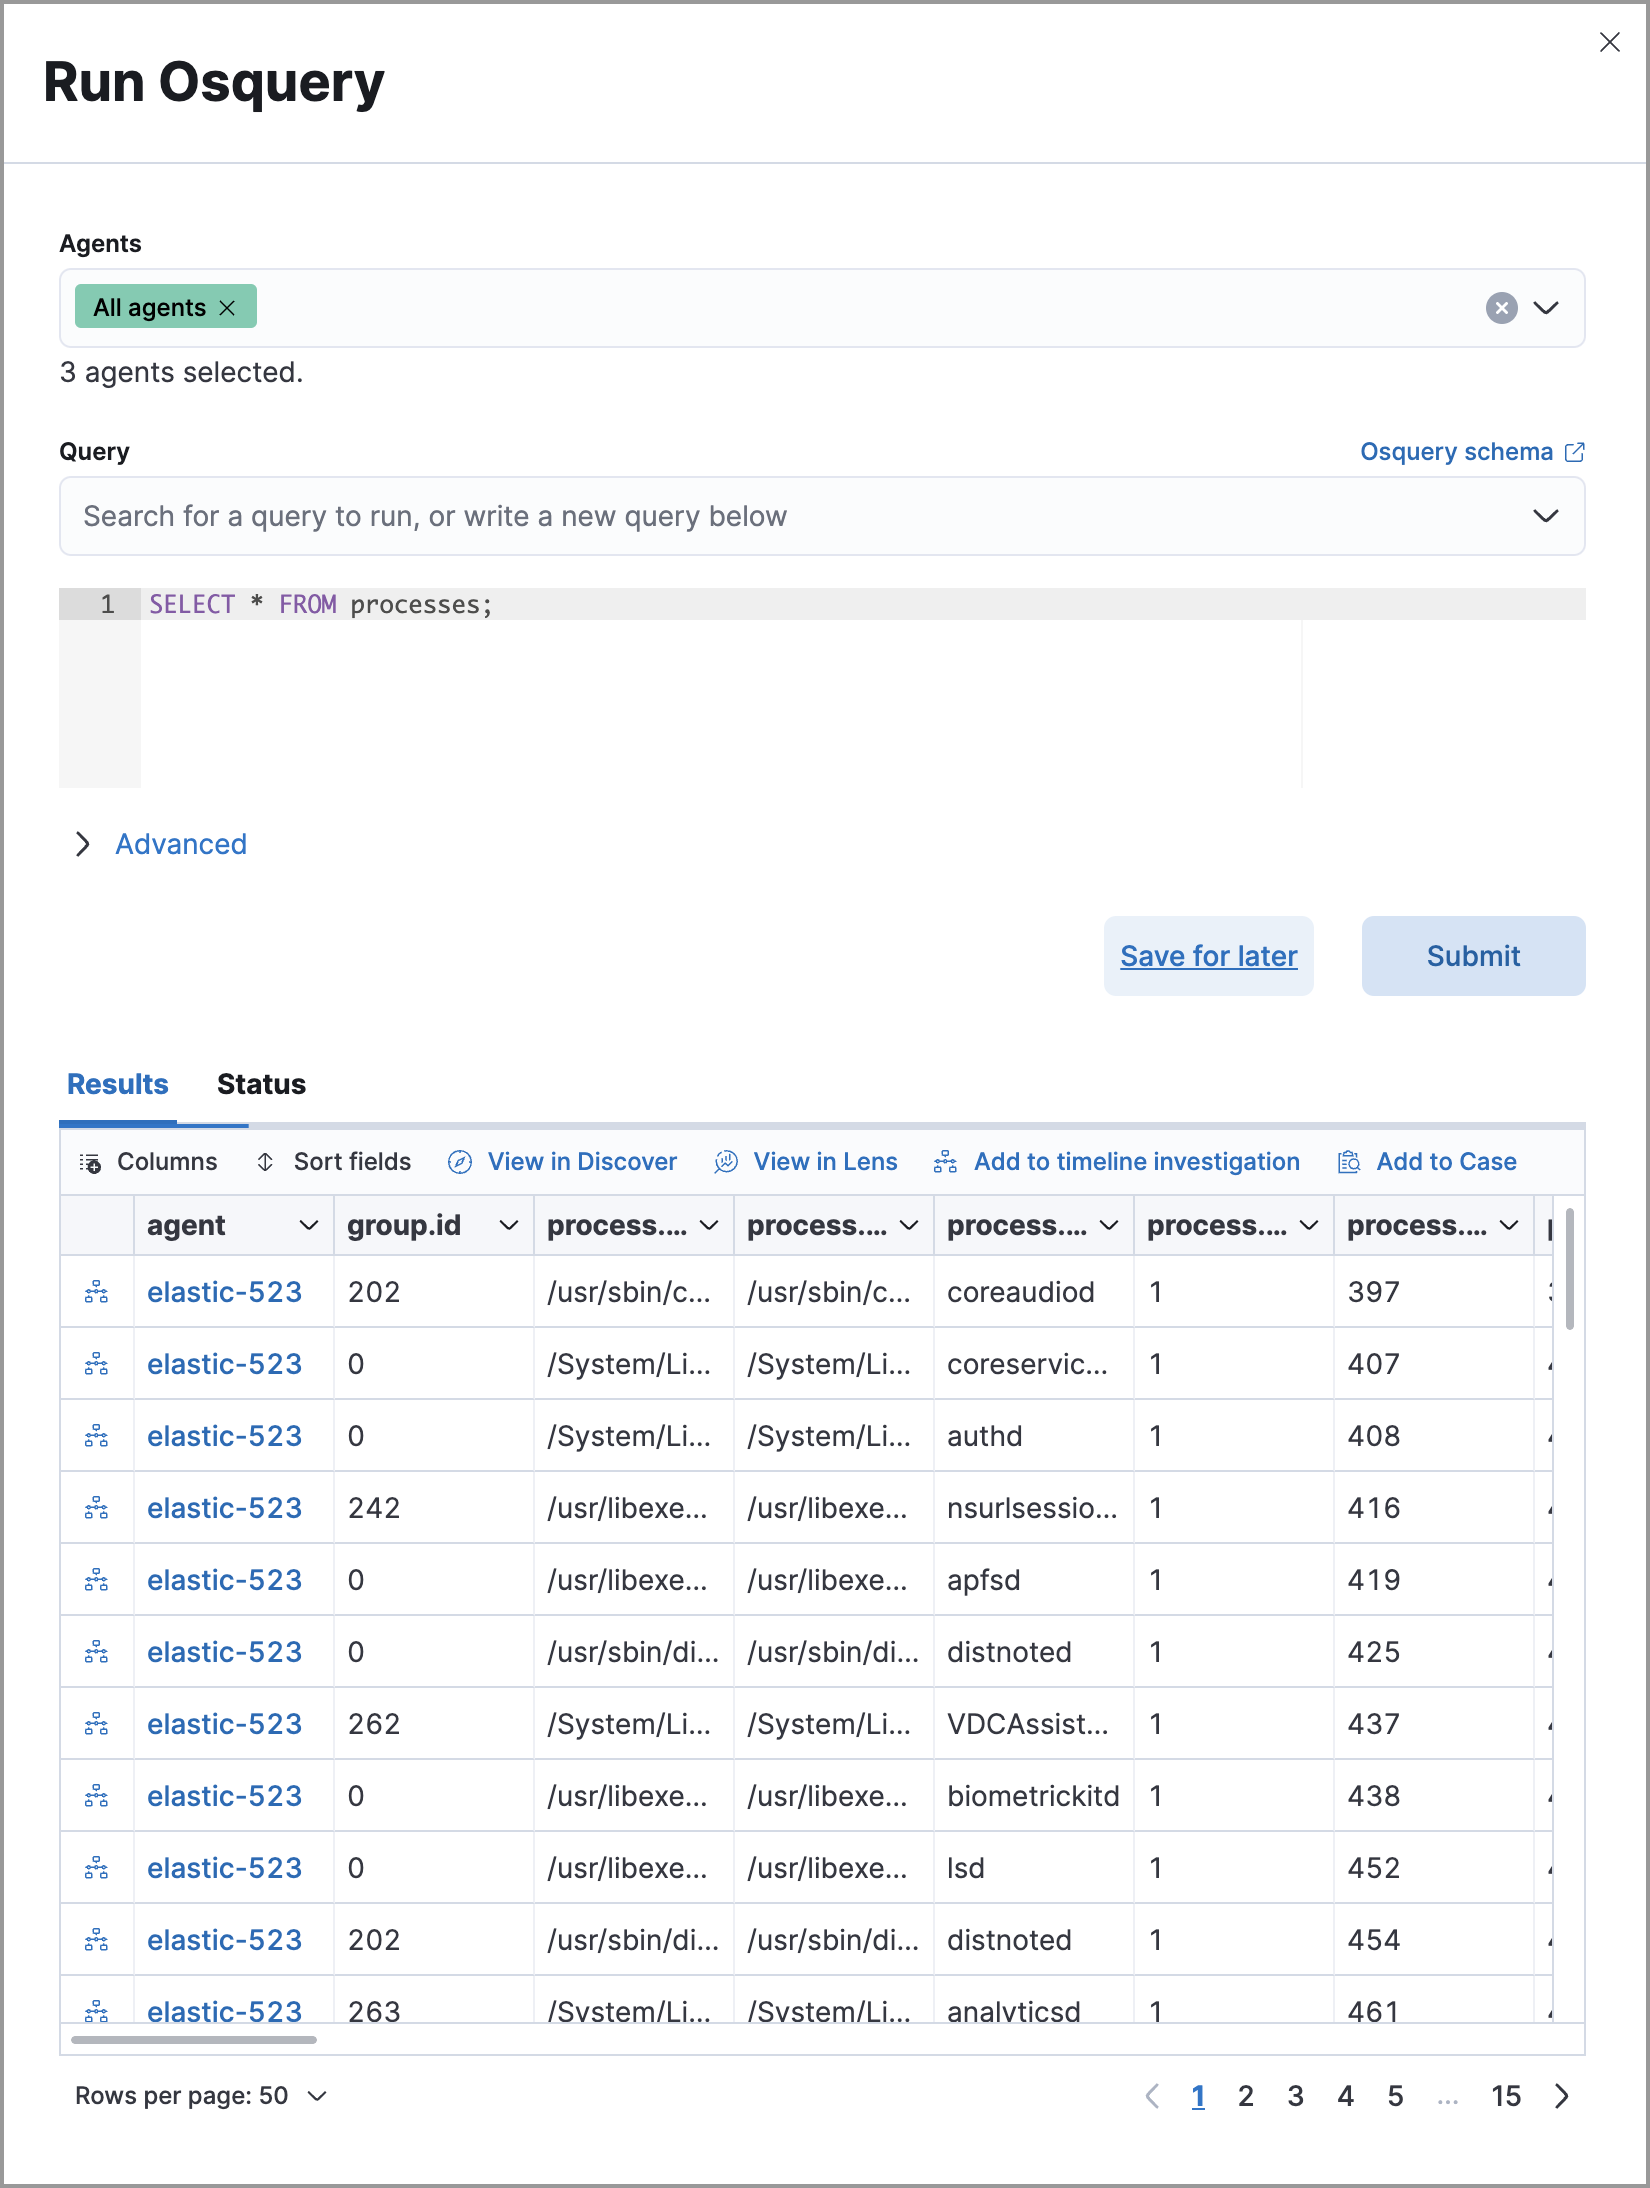
For the complete Osquery reference, refer to Run Osquery from investigation guides.