Kubernetes dashboard
editKubernetes dashboard
editThe Kubernetes dashboard provides insight into Linux process data from your Kubernetes clusters. It shows sessions in detail and in the context of your monitored infrastructure.
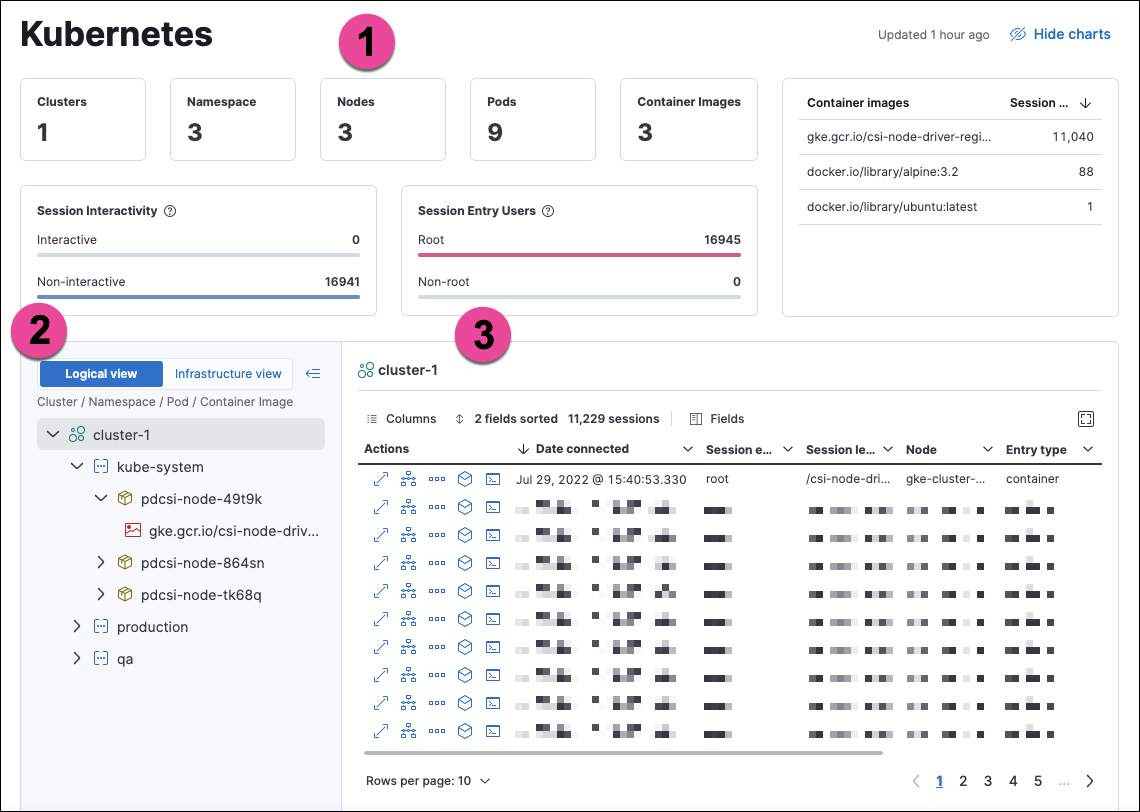
The numbered sections are described below:
- The charts at the top of the dashboard provide an overview of your monitored Kubernetes infrastructure. You can hide them by clicking Hide charts.
- The tree navigation menu allows you to navigate through your deployments and select the scope of the sessions table to the right. You can select any item in the menu to show its sessions. In Logical view, the menu is organized by Cluster, Namespace, Pod, and Container image. In Infrastructure view, it is organized by Cluster, Node, Pod, and Container image.
- The sessions table displays sessions collected from the selected element of your Kubernetes infrastructure. You can view it in fullscreen by selecting the button in the table’s upper right corner. You can sort the table by any of its fields.
You can filter the data using the KQL search bar and date picker at the top of the page.
From the sessions table’s Actions column, you can take the following investigative actions:
- View details
- Open in Timeline
- Run Osquery
- Analyze event
- Open Session View
Session View displays Kubernetes metadata under the Metadata tab of the Detail panel:
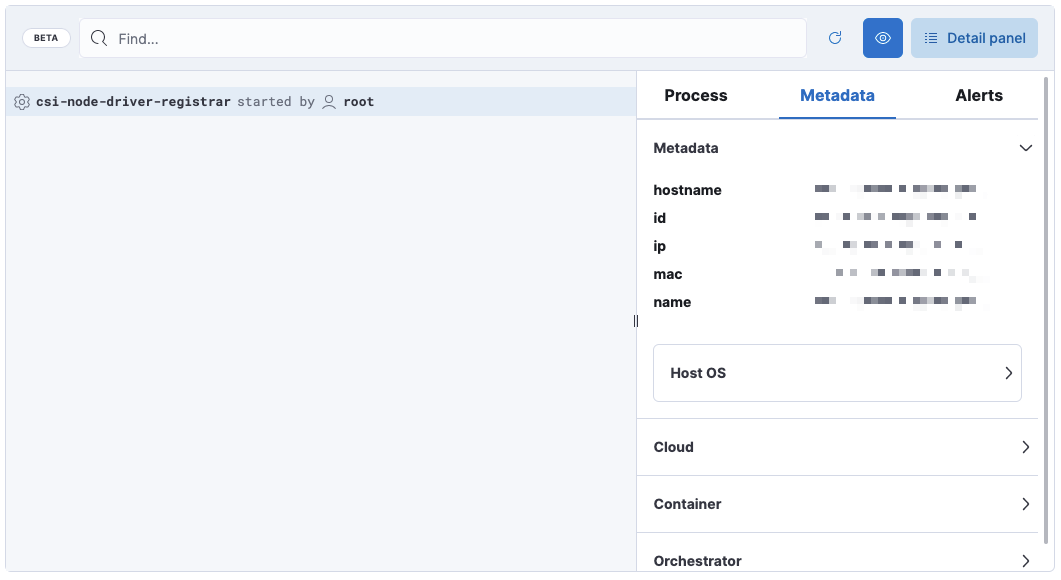
The Metadata tab is organized into these expandable sections:
-
Metadata:
hostname,id,ip,mac,name, Host OS information -
Cloud:
instance.name,provider,region,account.id,project.id -
Container:
id,name,image.name,image.tag,image.hash.all -
Orchestrator:
resource.ip,resource.name,resource.type,namespace,cluster.id,cluster.name,parent.type
Setup
editTo get data for this dashboard, set up Cloud Workload Protection for Kubernetes for the clusters you want to display on the dashboard.
Support matrix: This feature is currently available on GKE and EKS using Linux hosts and Kubernetes versions that match the following specifications:
EKS 1.24-1.26 (AL2022) |
GKE 1.24-1.26 (COS) |
|
Process event exports |
✓ |
✓ |
Network event exports |
✓ |
✓ |
File event exports |
✓ |
✓ |
File blocking |
✓ |
✓ |
Process blocking |
✓ |
✓ |
Network blocking |
✗ |
✗ |
Drift prevention |
✓ |
✓ |
Mount point awareness |
✓ |
✓ |
This dashboard uses data from the logs-* index pattern, which is included by default in the securitySolution:defaultIndex advanced setting. To collect data from multiple Elasticsearch clusters (as in a cross-cluster deployment), update logs-* to *:logs-*.