Entity Analytics dashboard
editEntity Analytics dashboard
editThe Entity Analytics dashboard provides a centralized view of emerging insider threats - including host risk, user risk, and notable anomalies from within your network. Use it to triage, investigate, and respond to these emerging threats.
The dashboard includes the following sections:
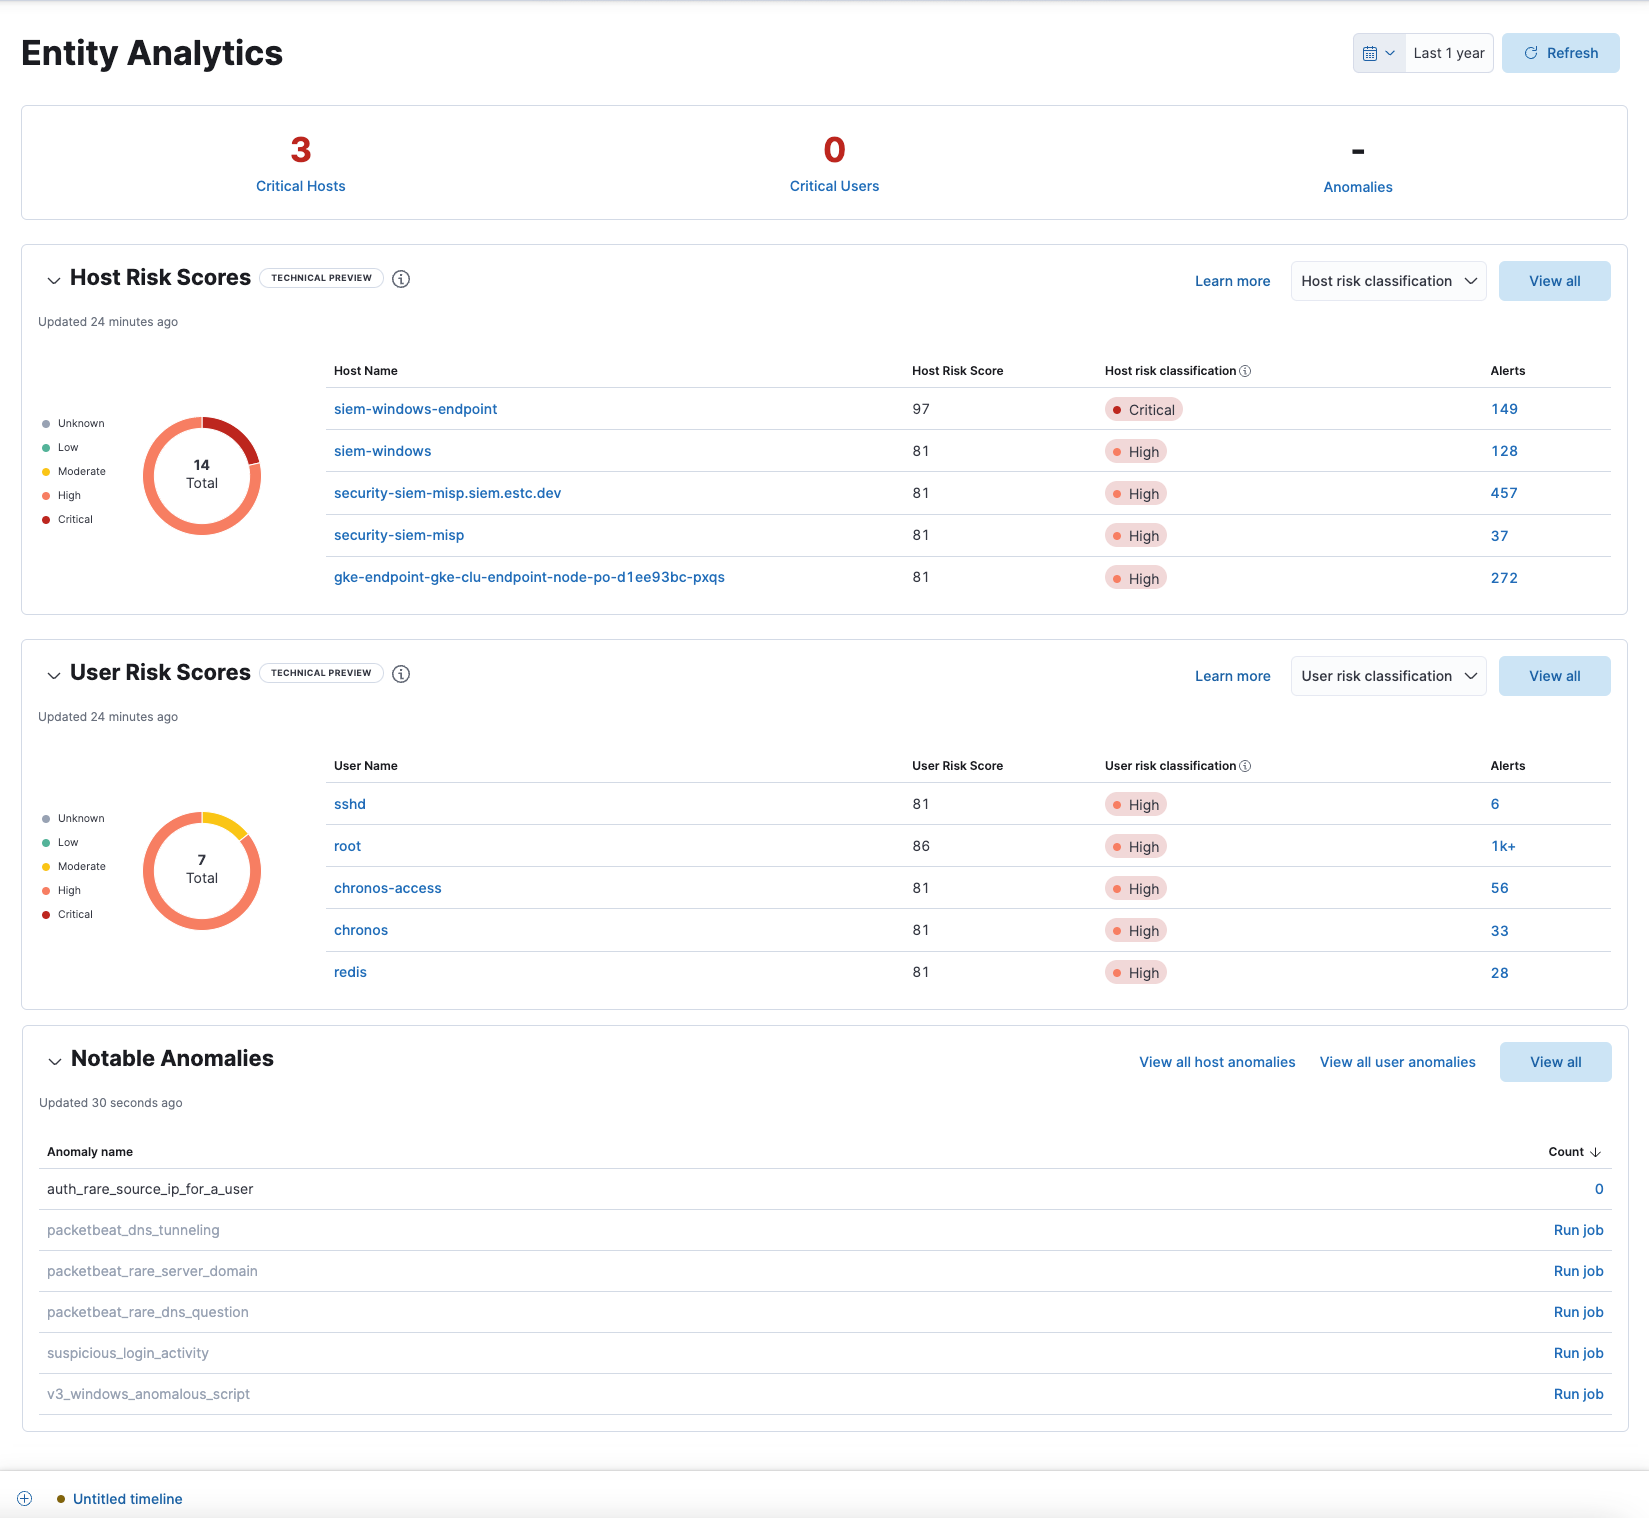
Entity KPIs (key performance indicators)
editDisplays the total number of critical hosts, critical users, and anomalies. Select a link to jump to the Host risk table, User risk table, or Notable Anomalies table.
Host Risk Scores
editDisplays host risk score data for your environment, including the total number of hosts, and the five most recently recorded host risk scores, with their associated host names, risk classifications, and number of detection alerts. Host risk scores are calculated using a weighted sum on a scale of 0 (lowest) to 100 (highest).
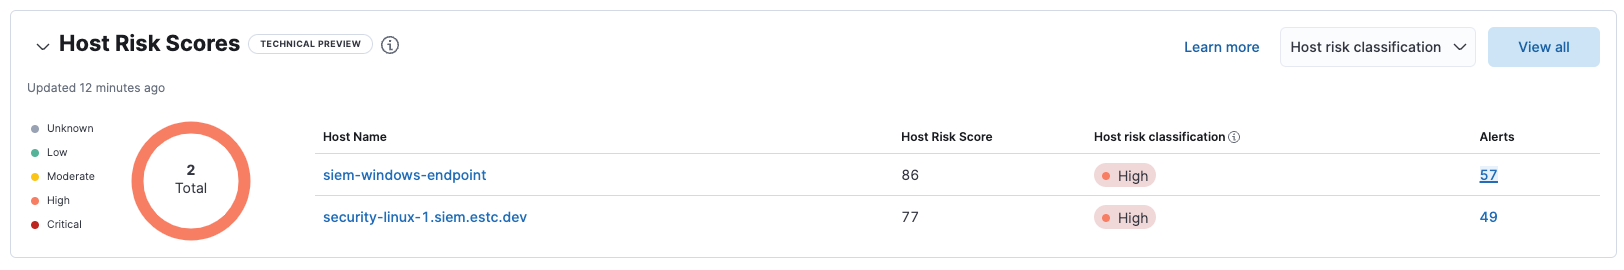
Interact with the table to filter data, view more details, and take action:
- Select the Host risk classification menu to filter the chart by the selected classification.
- Click a host name link to go to the Host details page.
- Hover over a host name link to display inline actions: Add to timeline investigation, which adds the selected value to a new Timeline, and Copy to Clipboard, which copies the host name value for you to paste later.
- Click View all in the upper-right to display all host risk information on the Hosts page.
- Click the number link in the Alerts column to launch Timeline, which populates a query with the selected host name value.
For more information about host risk scores, click the Learn more link in the table, or refer to Host risk score.
User Risk Scores
editDisplays user risk score data for your environment, including the total number of users, and the five most recently recorded user risk scores, with their associated user names, risk classifications, and number of detection alerts. Like host risk scores, user risk scores are calculated using a weighted sum on a scale of 0 (lowest) to 100 (highest).
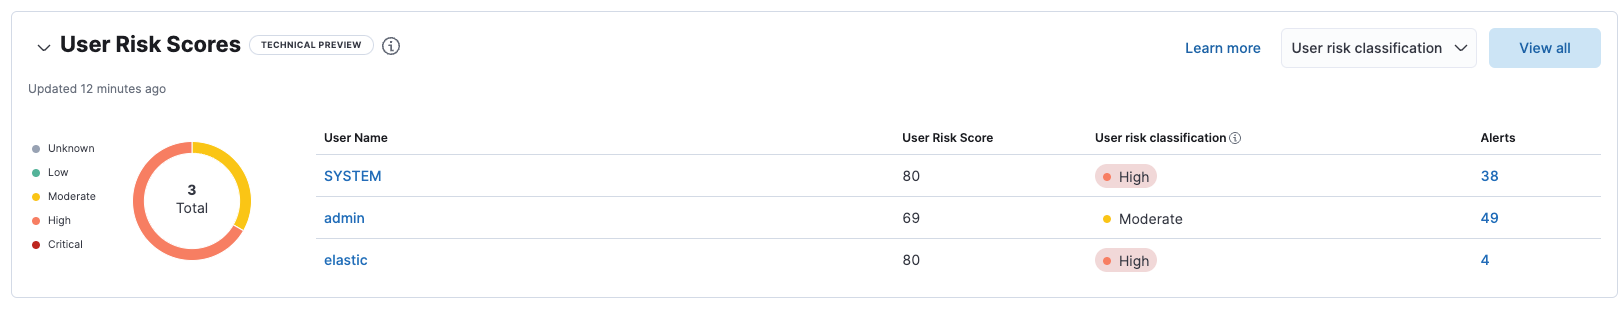
Interact with the table to filter data, view more details, and take action:
- Select the User risk classification menu to filter the chart by the selected classification.
- Click a user name link to go to the User details page.
- Hover over a user name link to display inline actions: Add to timeline investigation, which adds the selected value to a new Timeline, and Copy to Clipboard, which copies the user name value for you to paste later.
- Click View all in the upper-right to display all user risk information on the Users page.
- Click the number link in the Alerts column to launch Timeline, which populates a query with the selected user name value.
For more information about user risk scores, click the Learn more link in the table, or refer to User risk score.
The host risk and user risk score tables are not affected by the date and time range.
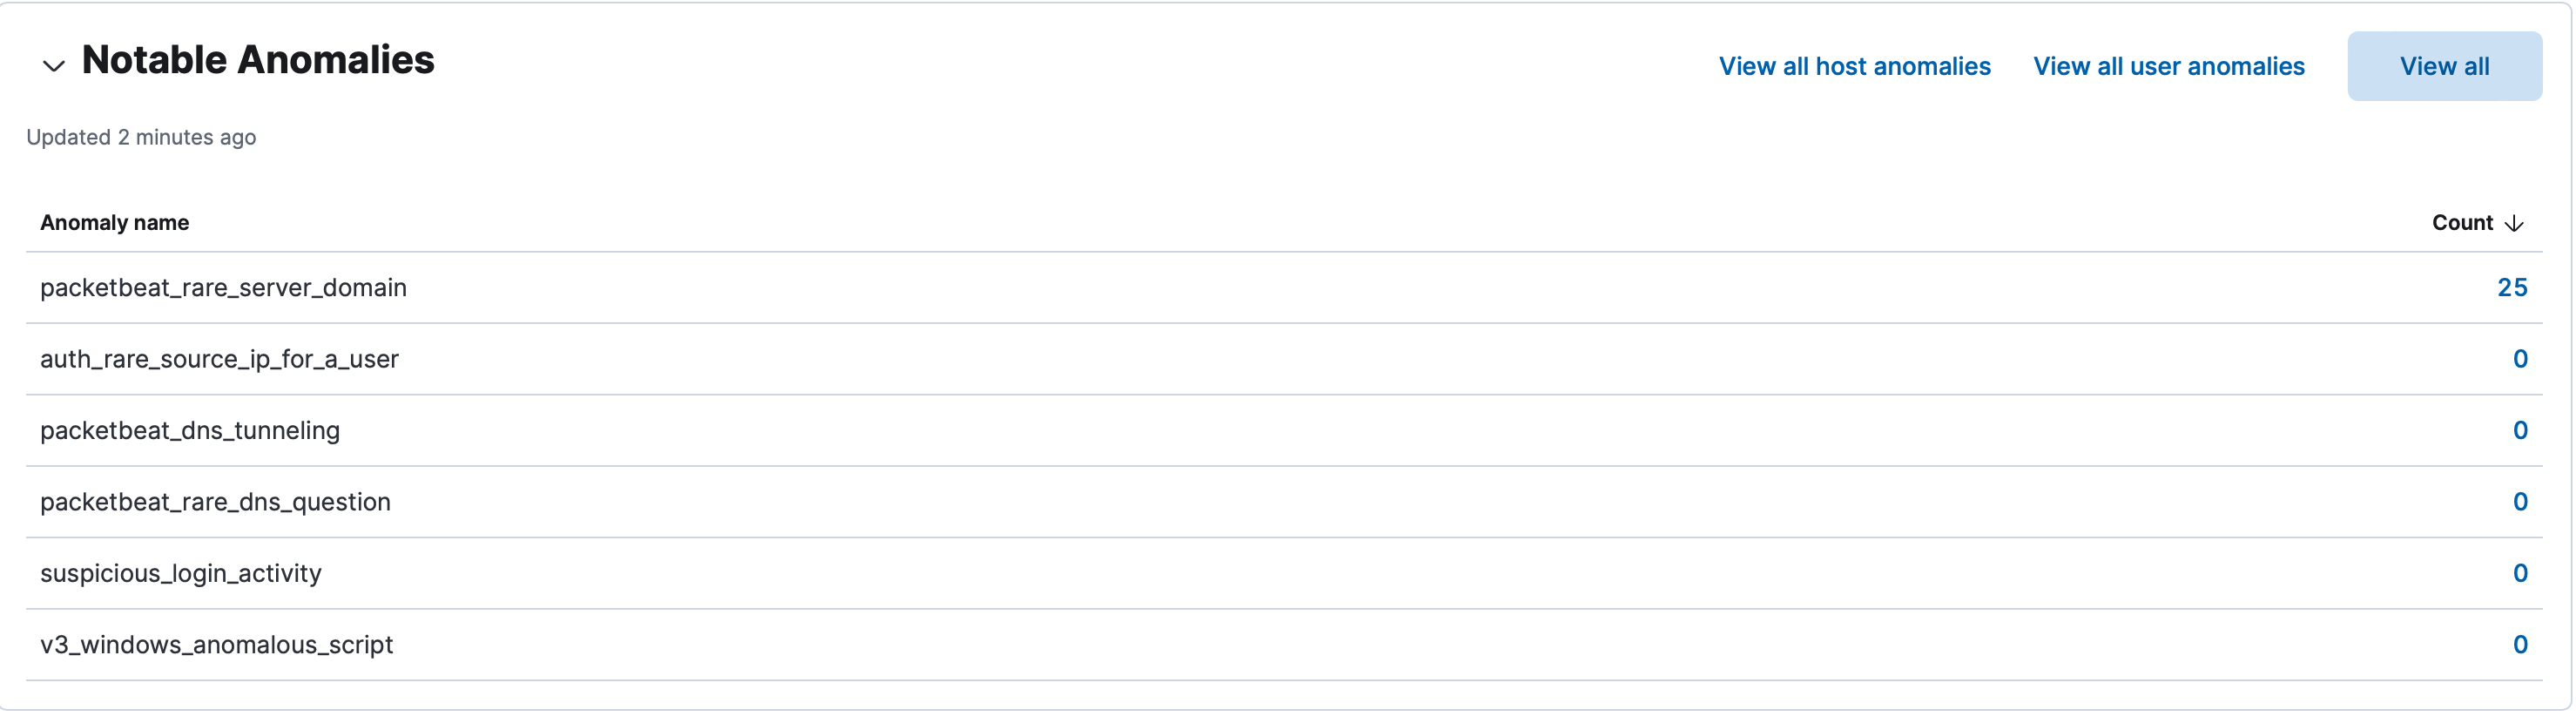
Notable Anomalies
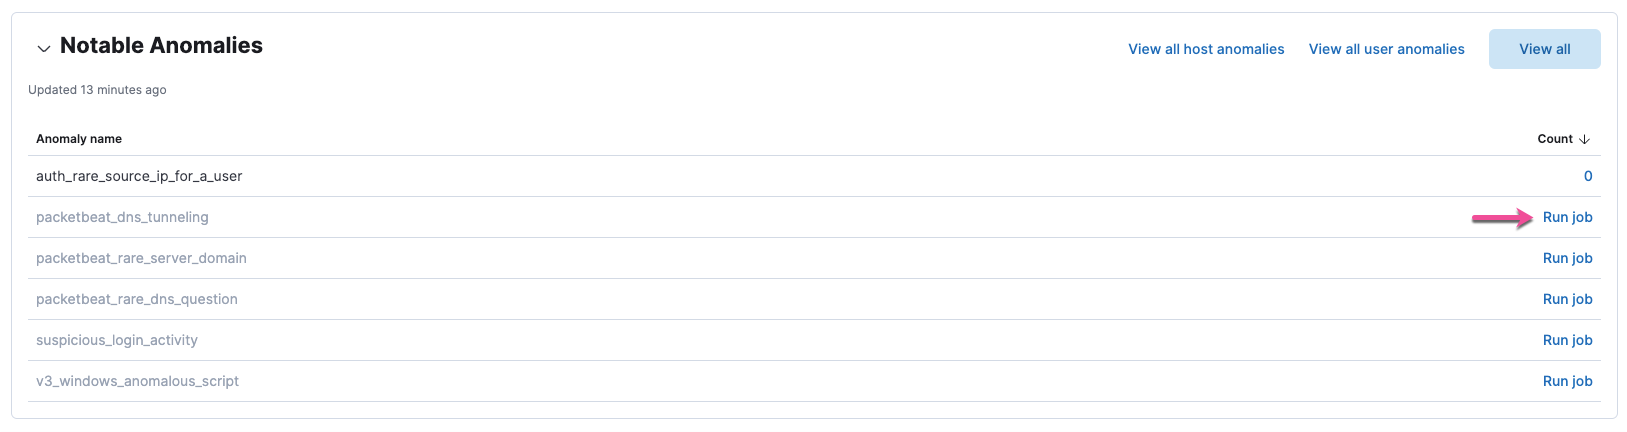
editAnomalies identify suspicious or irregular behavior patterns. The Notable Anomalies table displays the total number of host and user anomalies identified by six predefined machine learning jobs (named in the Anomaly name column). These jobs must be installed and running to provide anomaly data.
If data is missing, click the Run job link next to a machine learning job to install and start the job.
Interact with the table to view more details:
- Click View all host anomalies to go to the Anomalies table on the Hosts page.
- Click View all user anomalies to go to the Anomalies table on the Users page.
- Click View all to display and manage all machine learning jobs on the Anomaly Detection Jobs page.
To learn more about machine learning, refer to What is Elastic machine learning?