Enable threat intelligence integrations
editEnable threat intelligence integrations
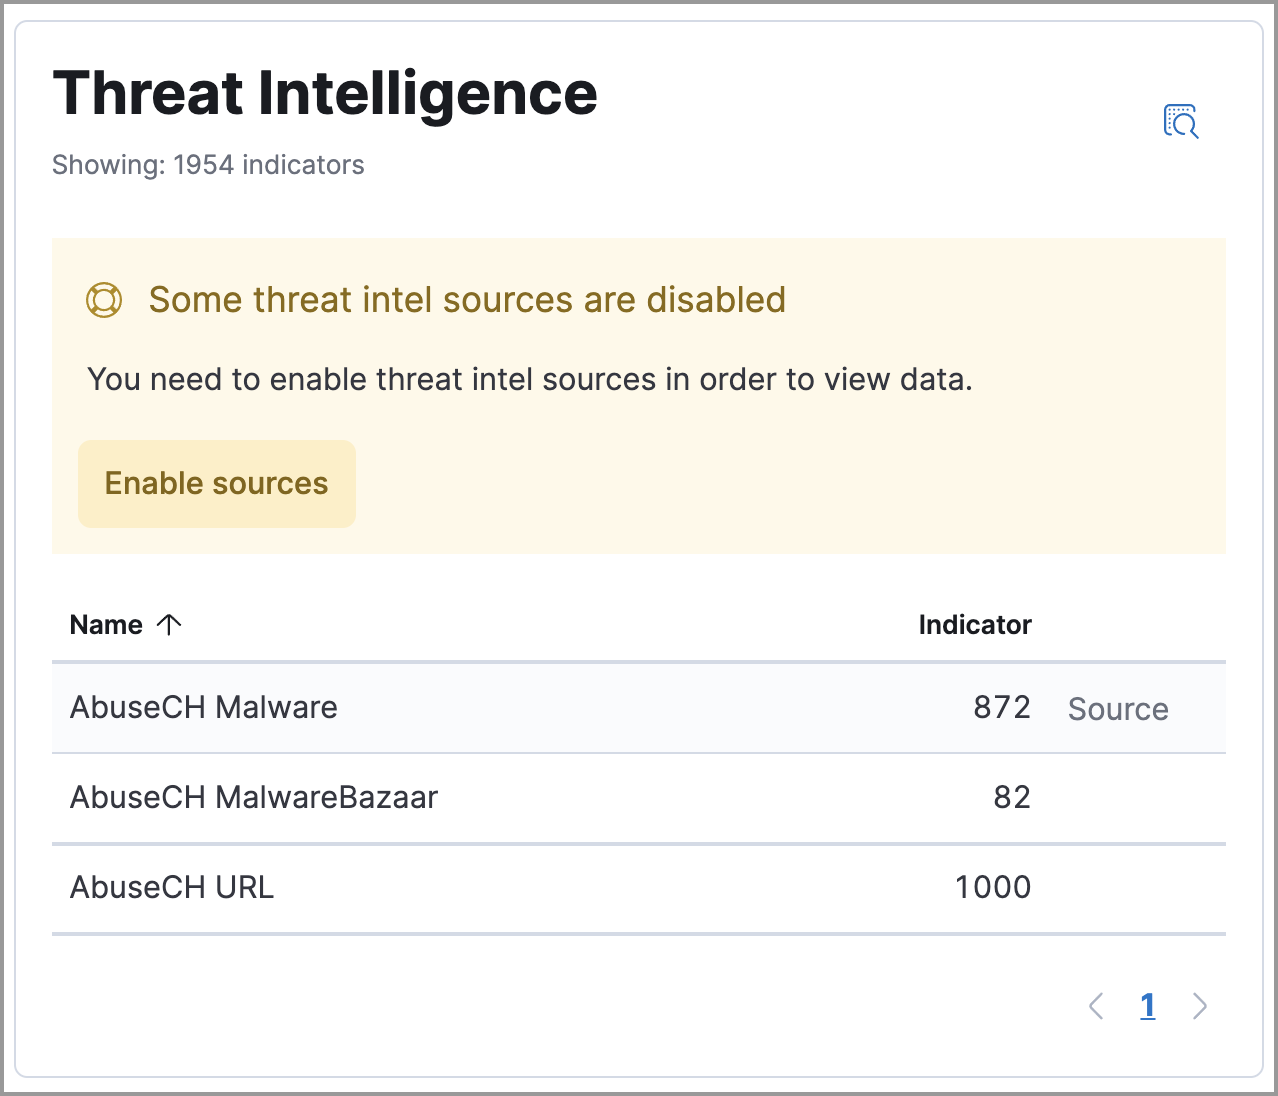
editThe Threat Intelligence view provides a streamlined way to collect threat intelligence data that you can use for threat detection and matching. Threat intelligence data consists of threat indicators ingested from third-party threat intelligence sources.
Threat indicators describe potential threats, unusual behavior, or malicious activity on a network or in an environment. They are commonly used in indicator match rules to detect and match known threats. When an indicator match rule generates an alert, it includes information about the matched threat indicator.
To learn more about alerts with threat intelligence, visit View alert details.
You can connect to threat intelligence sources using an Elastic Agent integration, the Threat Intel module, or a custom integration.
There are a few scenarios when data won’t display in the Threat Intelligence view:
- If you’ve chosen a time range that doesn’t contain threat indicator event data, you are prompted to choose a different range. Use the date and time picker in the Elastic Security app or Kibana to select a new range to analyze.
- If the Elastic Agent or Filebeat agent hasn’t ingested Threat Intel module data yet, the threat indicator event counts won’t load. You can wait for data to be ingested or reach out to your administrator for help resolving this.
Add an Elastic Agent integration
edit- Install a Fleet-managed Elastic Agent on the hosts you want to monitor.
-
In the Threat Intelligence view, click Enable sources to view the Integrations page. Scroll down and select Elastic Agent only to filter by Elastic Agent integrations.
If you know the name of Elastic Agent integration you want to install, you can search for it directly. You can use the following Elastic Agent integrations with the Threat Intelligence view:
- AbuseCH
- AlienVault OTX
- Anomali
- Cybersixgill
- MISP
- Recorded Future
- ThreatQuotient
- Select an Elastic Agent integration, then complete the installation steps.
-
Return to the Threat Intelligence view on the Overview page. Refresh the page if indicator data isn’t displaying.
The message about disabled threat intelligence sources disappears when you enable all available Elastic Security integrations.
Add a Filebeat Threat Intel module integration
edit-
Set up the Filebeat agent and enable the Threat Intel module.
For more information about enabling available threat intelligence filesets, refer to Threat Intel module.
-
Update the
securitySolution:defaultThreatIndexadvanced setting by adding the appropriate index pattern name after the default Fleet threat intelligence index pattern (logs-ti*):-
If you’re only using Filebeat version 8.x, add the appropriate Filebeat threat intelligence index pattern. For example,
logs-ti*,filebeat-8*. -
If you’re using a previous version of Filebeat and a current one, differentiate between the threat intelligence indices by using unique index pattern names. For example, if you’re using Filebeat version 7.0.0 and 8.0.0, update the setting to
logs-ti*,filebeat-7*,filebeat-8*.
-
If you’re only using Filebeat version 8.x, add the appropriate Filebeat threat intelligence index pattern. For example,
- Return to the Threat Intelligence view on the Overview page. Refresh the page if indicator data isn’t displaying.
Add a custom integration
edit- Set up a way to ingest data into your system.
-
Update the
securitySolution:defaultThreatIndexadvanced setting by adding the appropriate index pattern name after the default Fleet threat intelligence index pattern (logs-ti*), for example,logs-ti*,custom-ti-index*.Threat intelligence indices aren’t required to be ECS compatible. However, we strongly recommend compatibility if you’d like your alerts to be enriched with relevant threat indicator information. You can find a list of ECS-compliant threat intelligence fields at Threat Fields.
-
Return to the Threat Intelligence view on the Overview page. Refresh the page if indicator data isn’t displaying.
The Threat Intelligence view searches for a
threat.feed.namefield value to define the source name in the Name column. If a custom source doesn’t have thethreat.feed.namefield or hasn’t defined athreat.feed.namefield value, it’s considered unnamed and labeled as Other. Dashboards aren’t created for unnamed sources unless thethreat.feed.dashboard_idfield is defined.