Administration page overview
editAdministration page overview
editThe Administration page enables admins to view and manage hosts that are running Elastic Endpoint Security.
Ingest Manager must be enabled in a Kibana Space for administrative actions to function correctly.
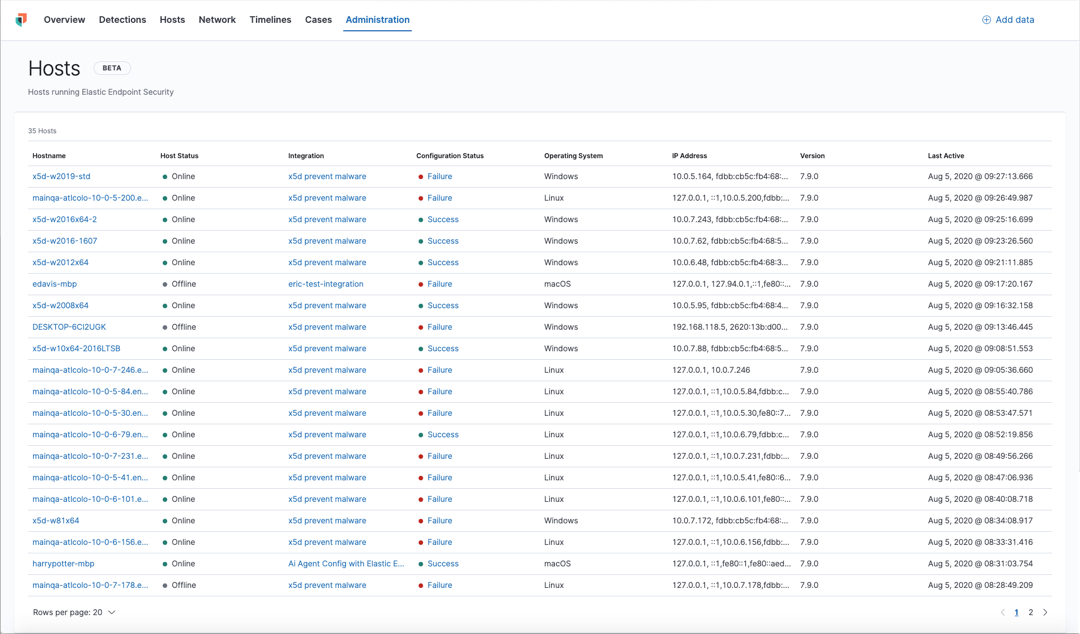
The Hosts list is an enumeration of all hosts and their relevant configuration and integration details, organized in a tabular format. Hosts appear in chronological order, with newly added hosts on top. The Hosts list provides the following data:
- Hostname: The system host name. Click the link to view host details in a flyout panel, where you can also reassign an agent configuration.
-
Host Status: The current host status, which is one of the following:
- Online: The Elastic Agent is online and communicating with Kibana.
- Unenrolling: The agent is currently unenrolling and will soon be removed from Ingest. Afterward, the host will also unenroll.
- Offline: The agent is still enrolled but may be on a machine that is shut down or currently does not have internet access. In this state, the agent is no longer communicating with Kibana on a regular interval.
- Error: There is an error with the agent. An Error status can also mean that the host is unable to find the parent agent or is missing the agent ID. It is recommended to look at the agent logs in Fleet to find out more information.
- Integration: The name of the associated integration when the agent was installed. Click the link to view the Integration details page.
- Configuration Status: Lists whether the configuration was a success or failure. Click the link to view configuration response details in a flyout panel.
- Operating System: The associated operating system.
- IP Address: All IP addresses associated with the host name.
- Version: The current Elastic Stack version running.
- Last Active: A date and timestamp of the last time the host was active.
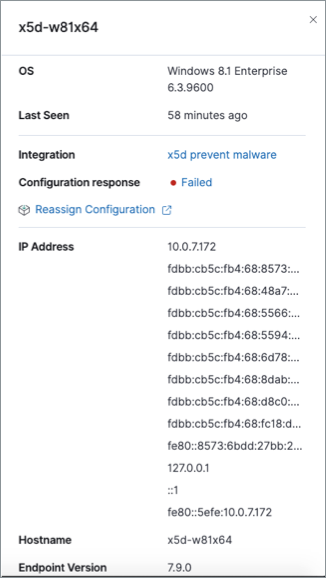
Hostname details
Click a Hostname link to display host details in a flyout panel. This panel also provides shortcut links to view the associated integration, view the configuration response details, and reassign the configuration if needed.
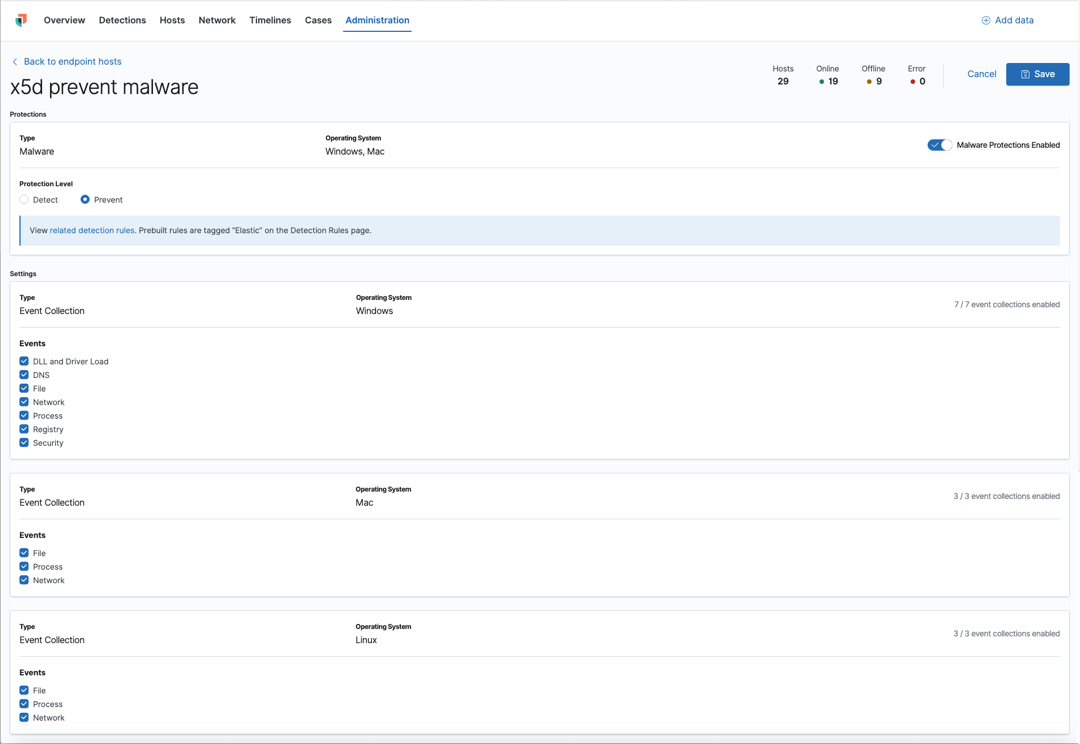
Integration details
To view the Integration details page, click the link in the Integration column. If you are viewing host details, you can also click the Integration link on the flyout panel.
On this page, you can view and manage protection configuration and event collection settings. In the upper-right corner is a Key Performance Indicator (KPI) widget that provides hosts status data. If you need to update the configuration, make changes as appropriate, then click the Save button to save your changes.
Users must have permission to read/write to Ingest Manager APIs to make changes to the configuration.
Configuration status
The status of the configuration appears in the Configuration Status column and displays one of the following possibilities:
- Success: The configuration applied successfully.
- Pending or Partially Applied: The configuration is pending application, or the configuration in its entirety was not applied.
In some cases, some actions taken on the endpoint may fail during the configuration application but are not recognized as a critical failure - meaning there may be a failure, but the hosts are still protected. In this case, the configuration status will display as "Partially Applied."
- Failure: The configuration did not apply correctly. As such, hosts are not protected.
- Unknown: The user interface is waiting for the API response to return, or, in rare cases, the API returns an undefined error or value.
To view configuration status details, click the link and review the data in the flyout panel. In the following image, you can see that the Agent Connectivity failed, generating a "Failed" configuration status.
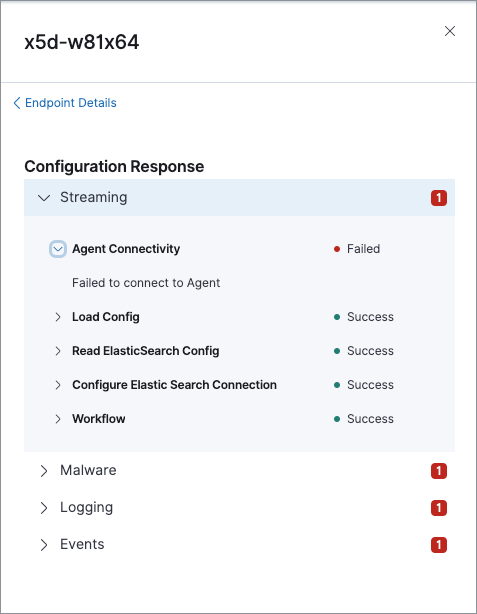
Expand each section and subsection to view individual responses from the agent.
If you need help troubleshooting a configuration failure, see the Ingest Manager troubleshooting topic.