Visual event analyzer
editVisual event analyzer
editElastic Security allows any event detected by Elastic Endpoint to be analyzed using a process-based visual analyzer. This enables security analysts to drill down into all related hosts, processes, and other events to aid in their investigations.
Find events to analyze
editYou can only visualize events triggered by hosts configured with the Elastic Endpoint Security Integration or any sysmon data from winlogbeat.
In KQL, this translates to any event with the agent.type set to either:
-
endpoint -
winlogbeatwithevent.moduleset tosysmon
To access events that can be visually analyzed:
- Select Hosts > Events. A list of all your host’s events appears in the bottom panel of the host’s view.
-
Create a KQL query that filters all
endpointdetected events by enteringagent.type:"endpoint" and process.entity_id : *oragent.type:"winlogbeat" and event.module: "sysmon" and process.entity_id : *into the KQL search bar, and then selecting Update.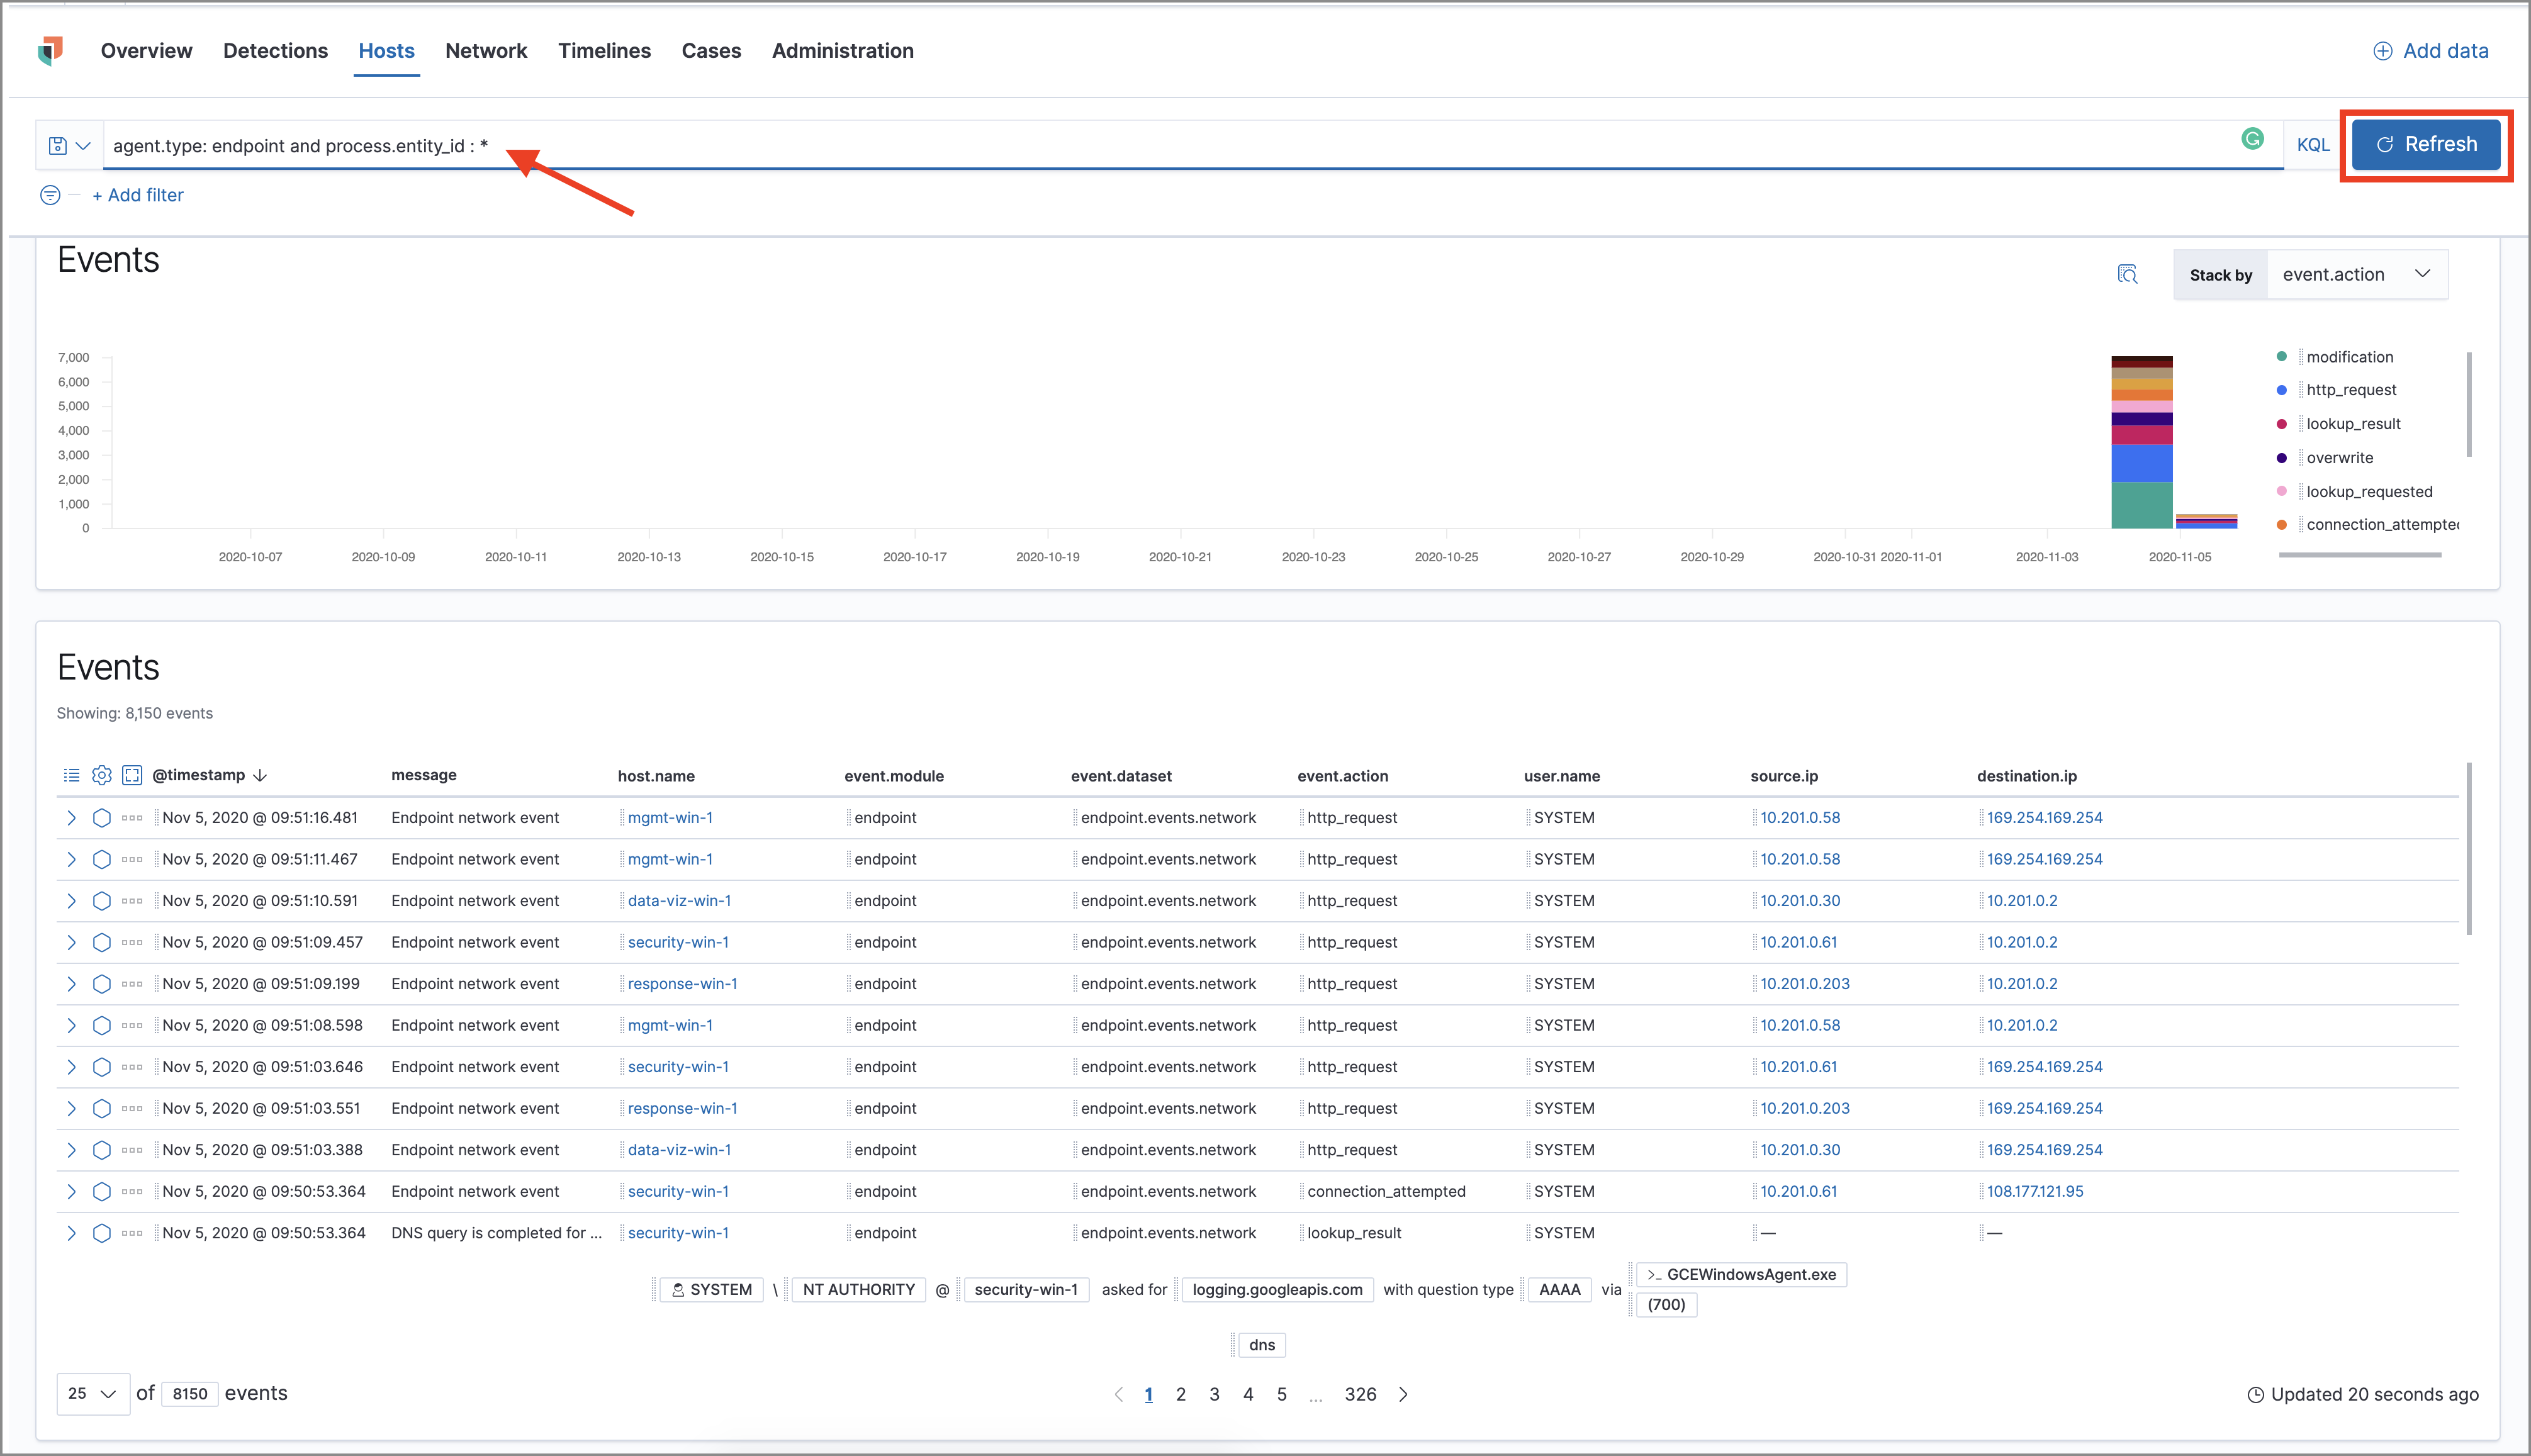
A list of all
endpointrelated events appears. -
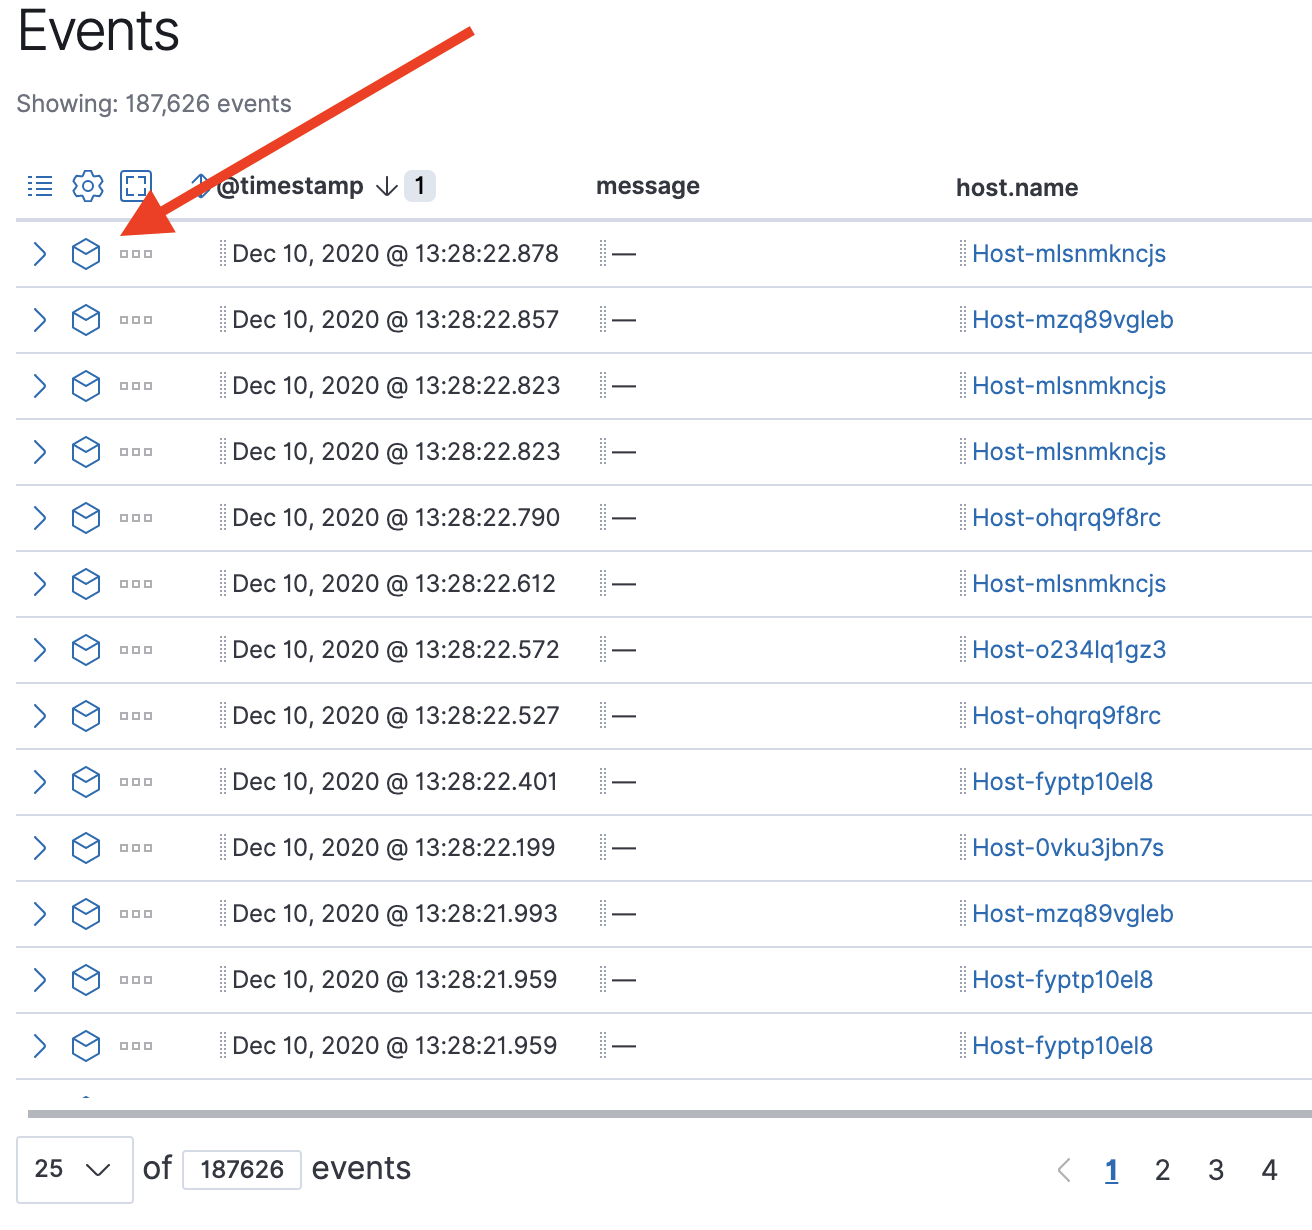
Select the Analyze Event icon for the event you want to analyze.
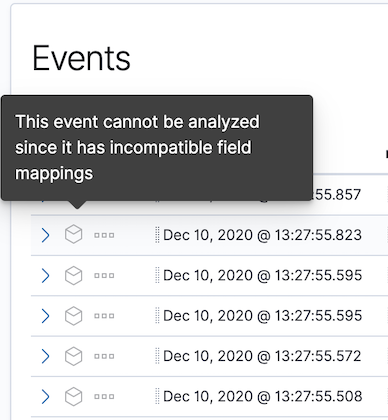
Events that cannot be analyzed will display the warning "This event cannot be analyzed since it has incompatible field mappings".
The visual Analyzer view appears.
You can also analyze events from Timelines.
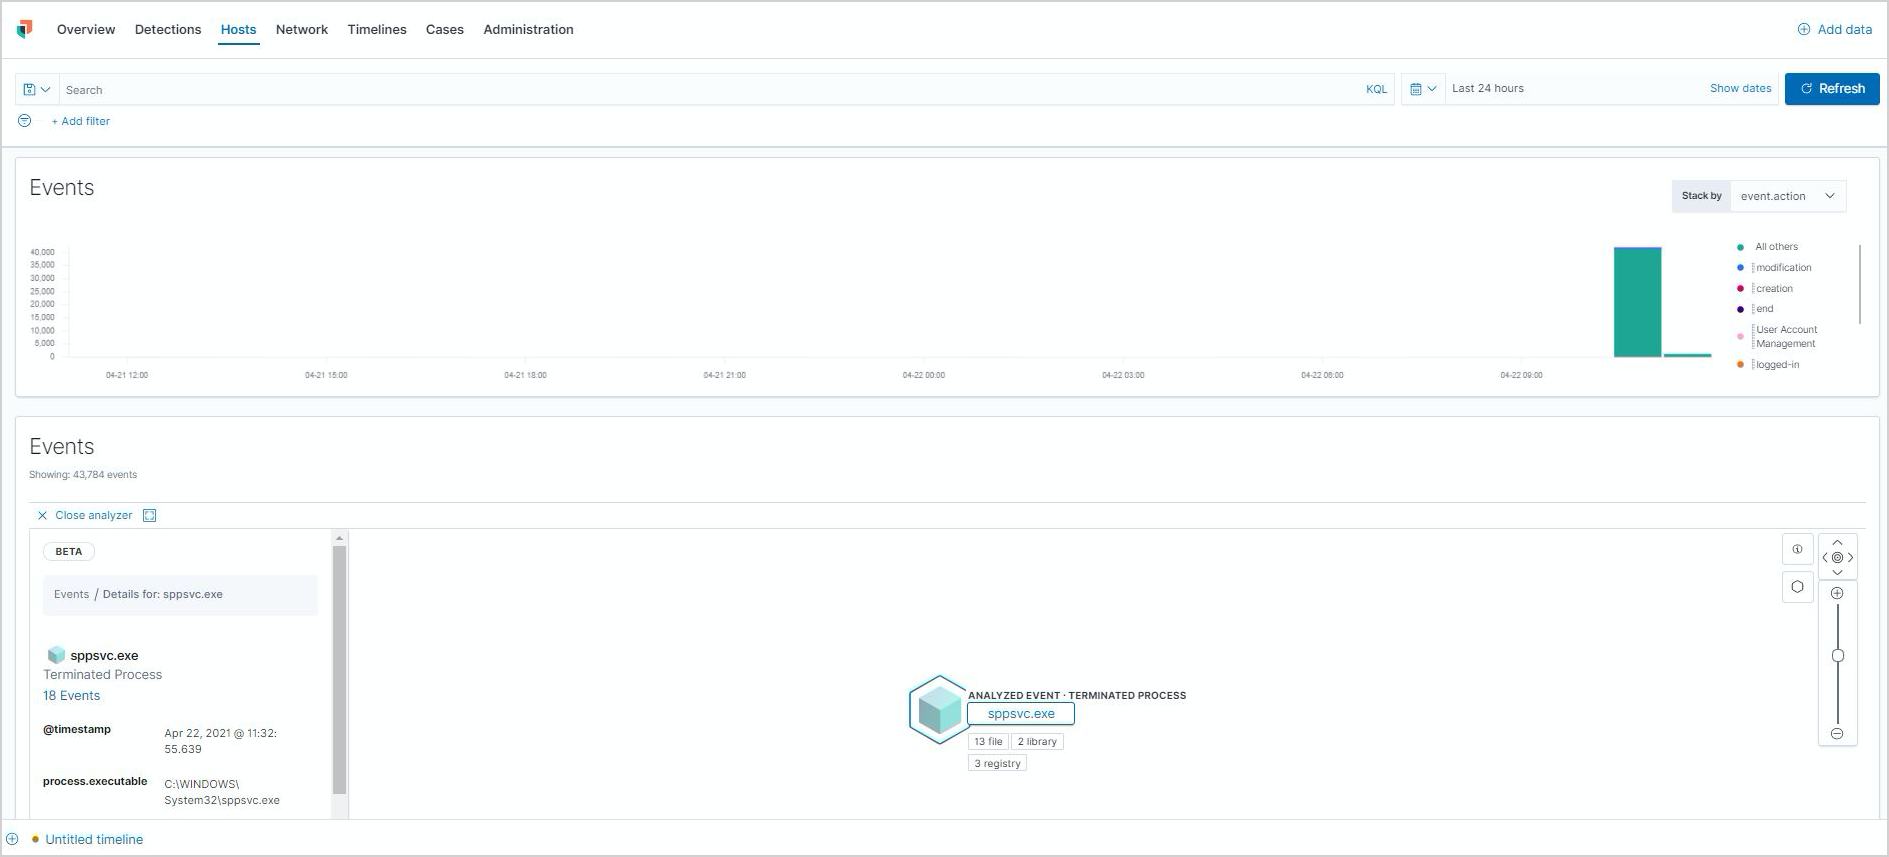
Visual event analyzer UI
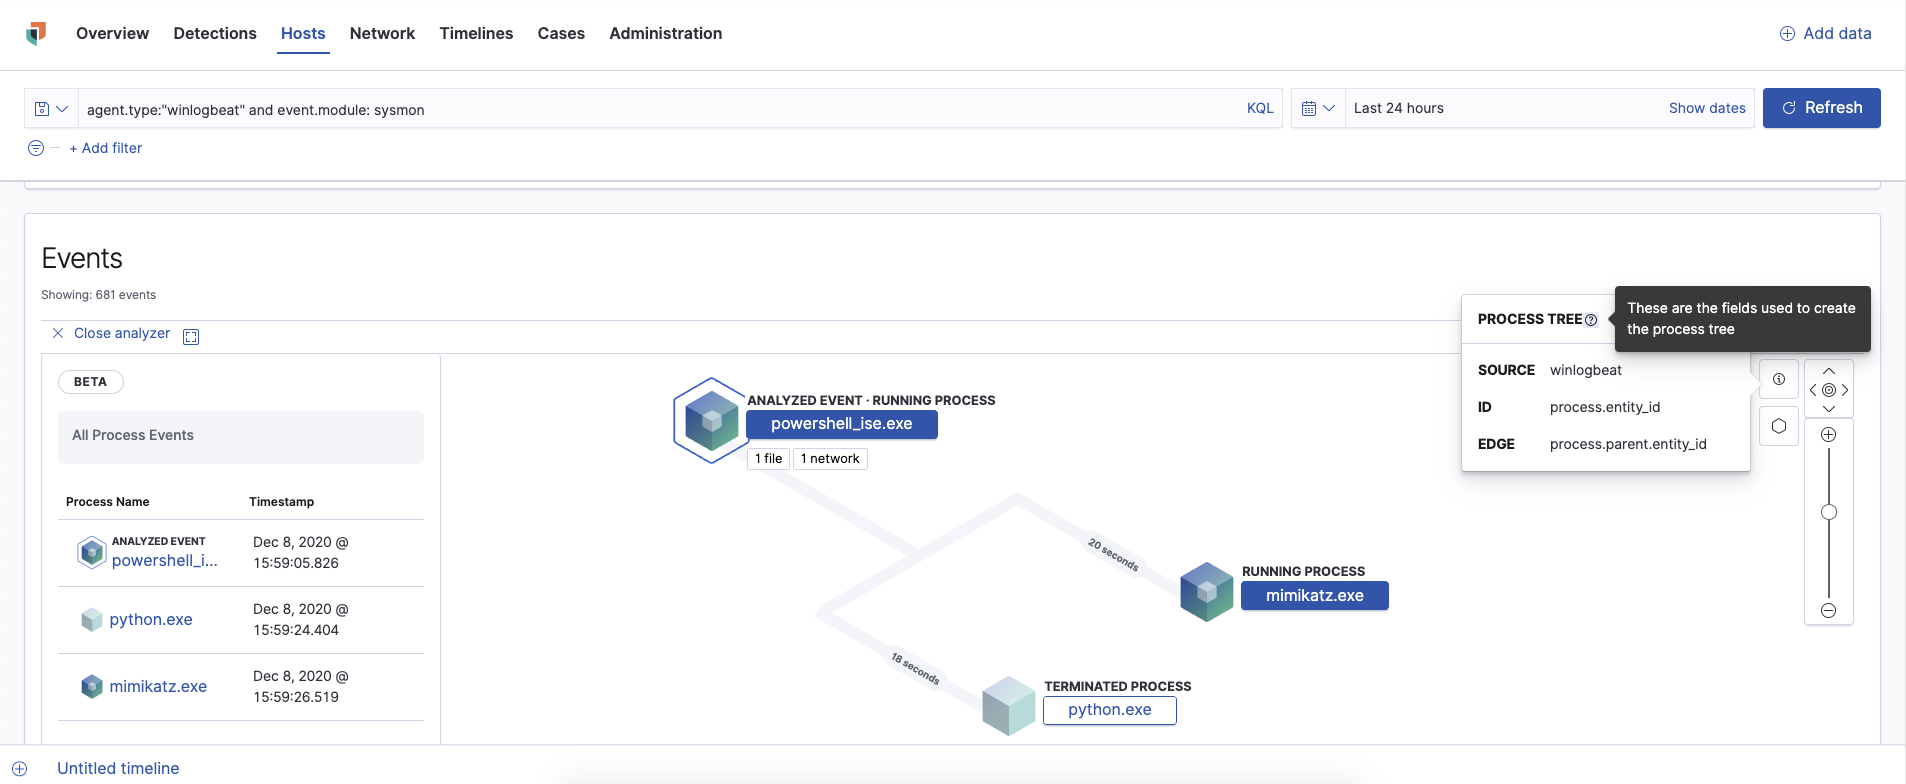
editInside the visual analyzer, each cube represents a process (e.g. an executable file or network event). Click and drag in timeline view to see all process relationships.
To understand what fields were used to create the process, select the Process Tree to view the schema that created the graphical view. The fields included are:
-
SOURCE: Can be eitherendpointorwinlogbeat -
ID: Event field that uniquely identifies a node -
EDGE: Event field which indicates the relationship between two nodes
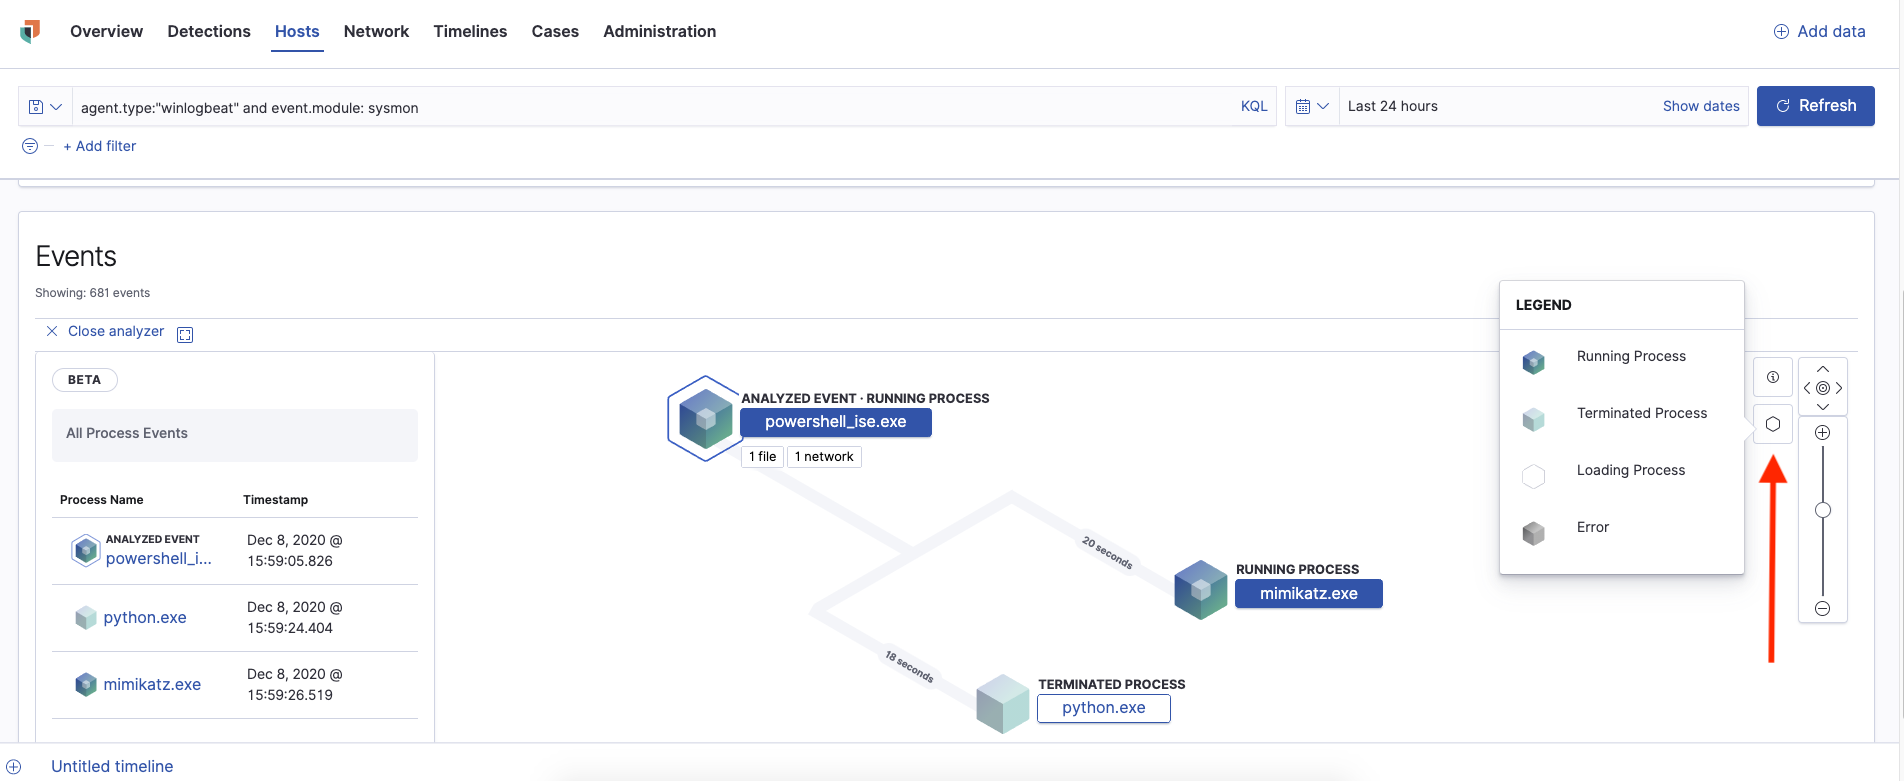
View the Legend to understand the state of each process node.
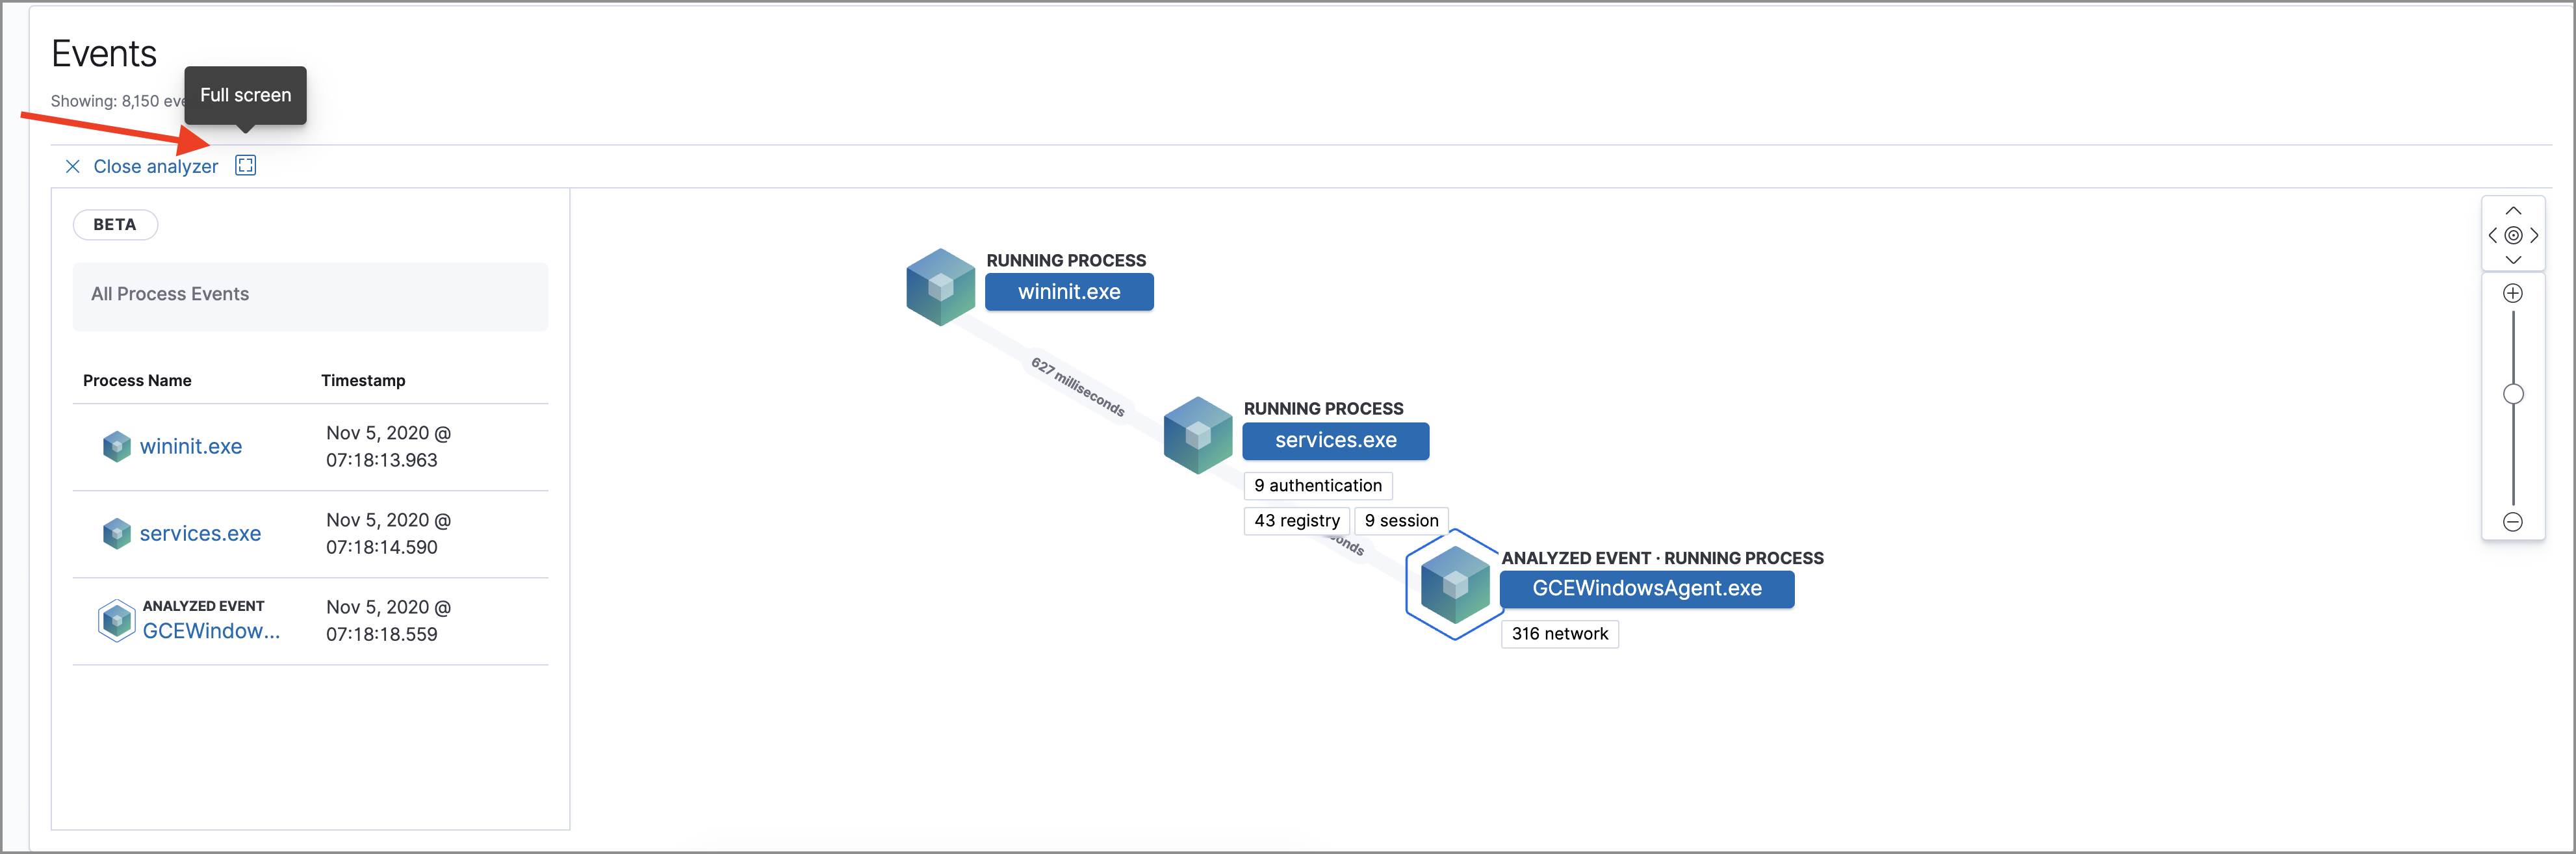
To expand the analyzer to a full screen, select the Full Screen icon above the left panel.
The left panel contains a list of all processes related to the event, starting with the event chain’s first process. Analyzed Events, as in the event you selected to analyze from either the events list or your timeline, are highlighted by a light blue outline around the cube.
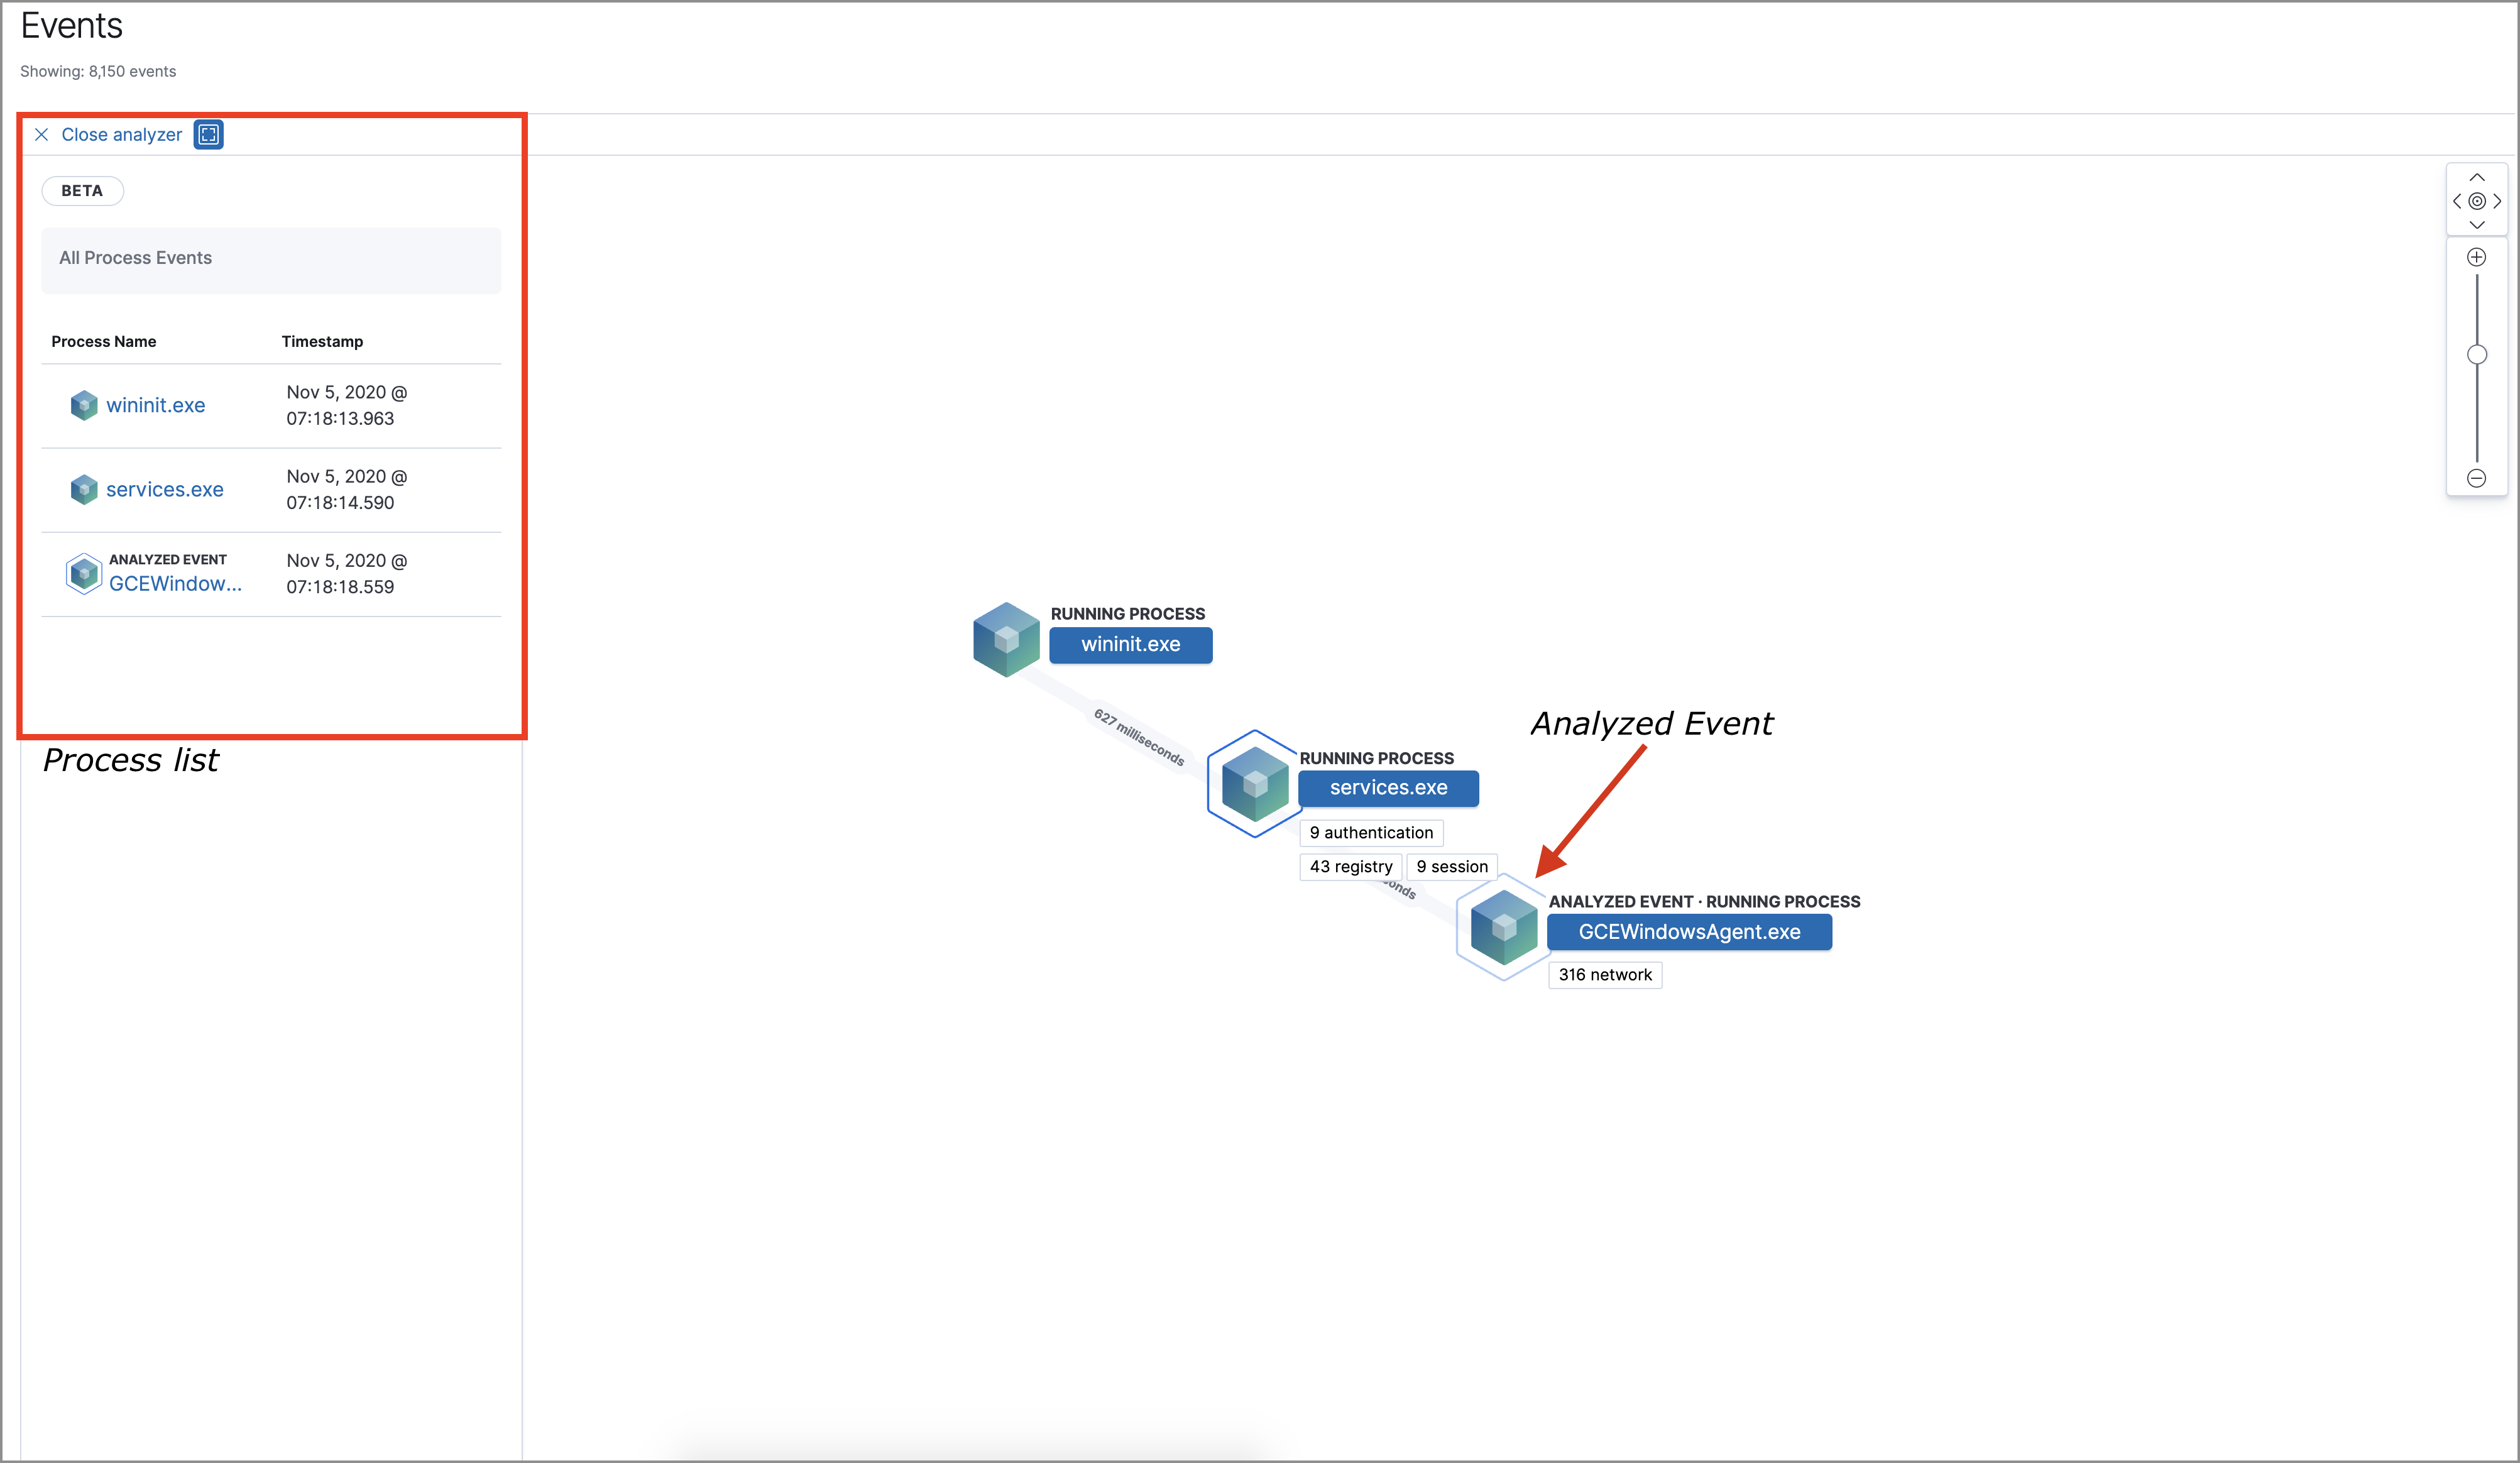
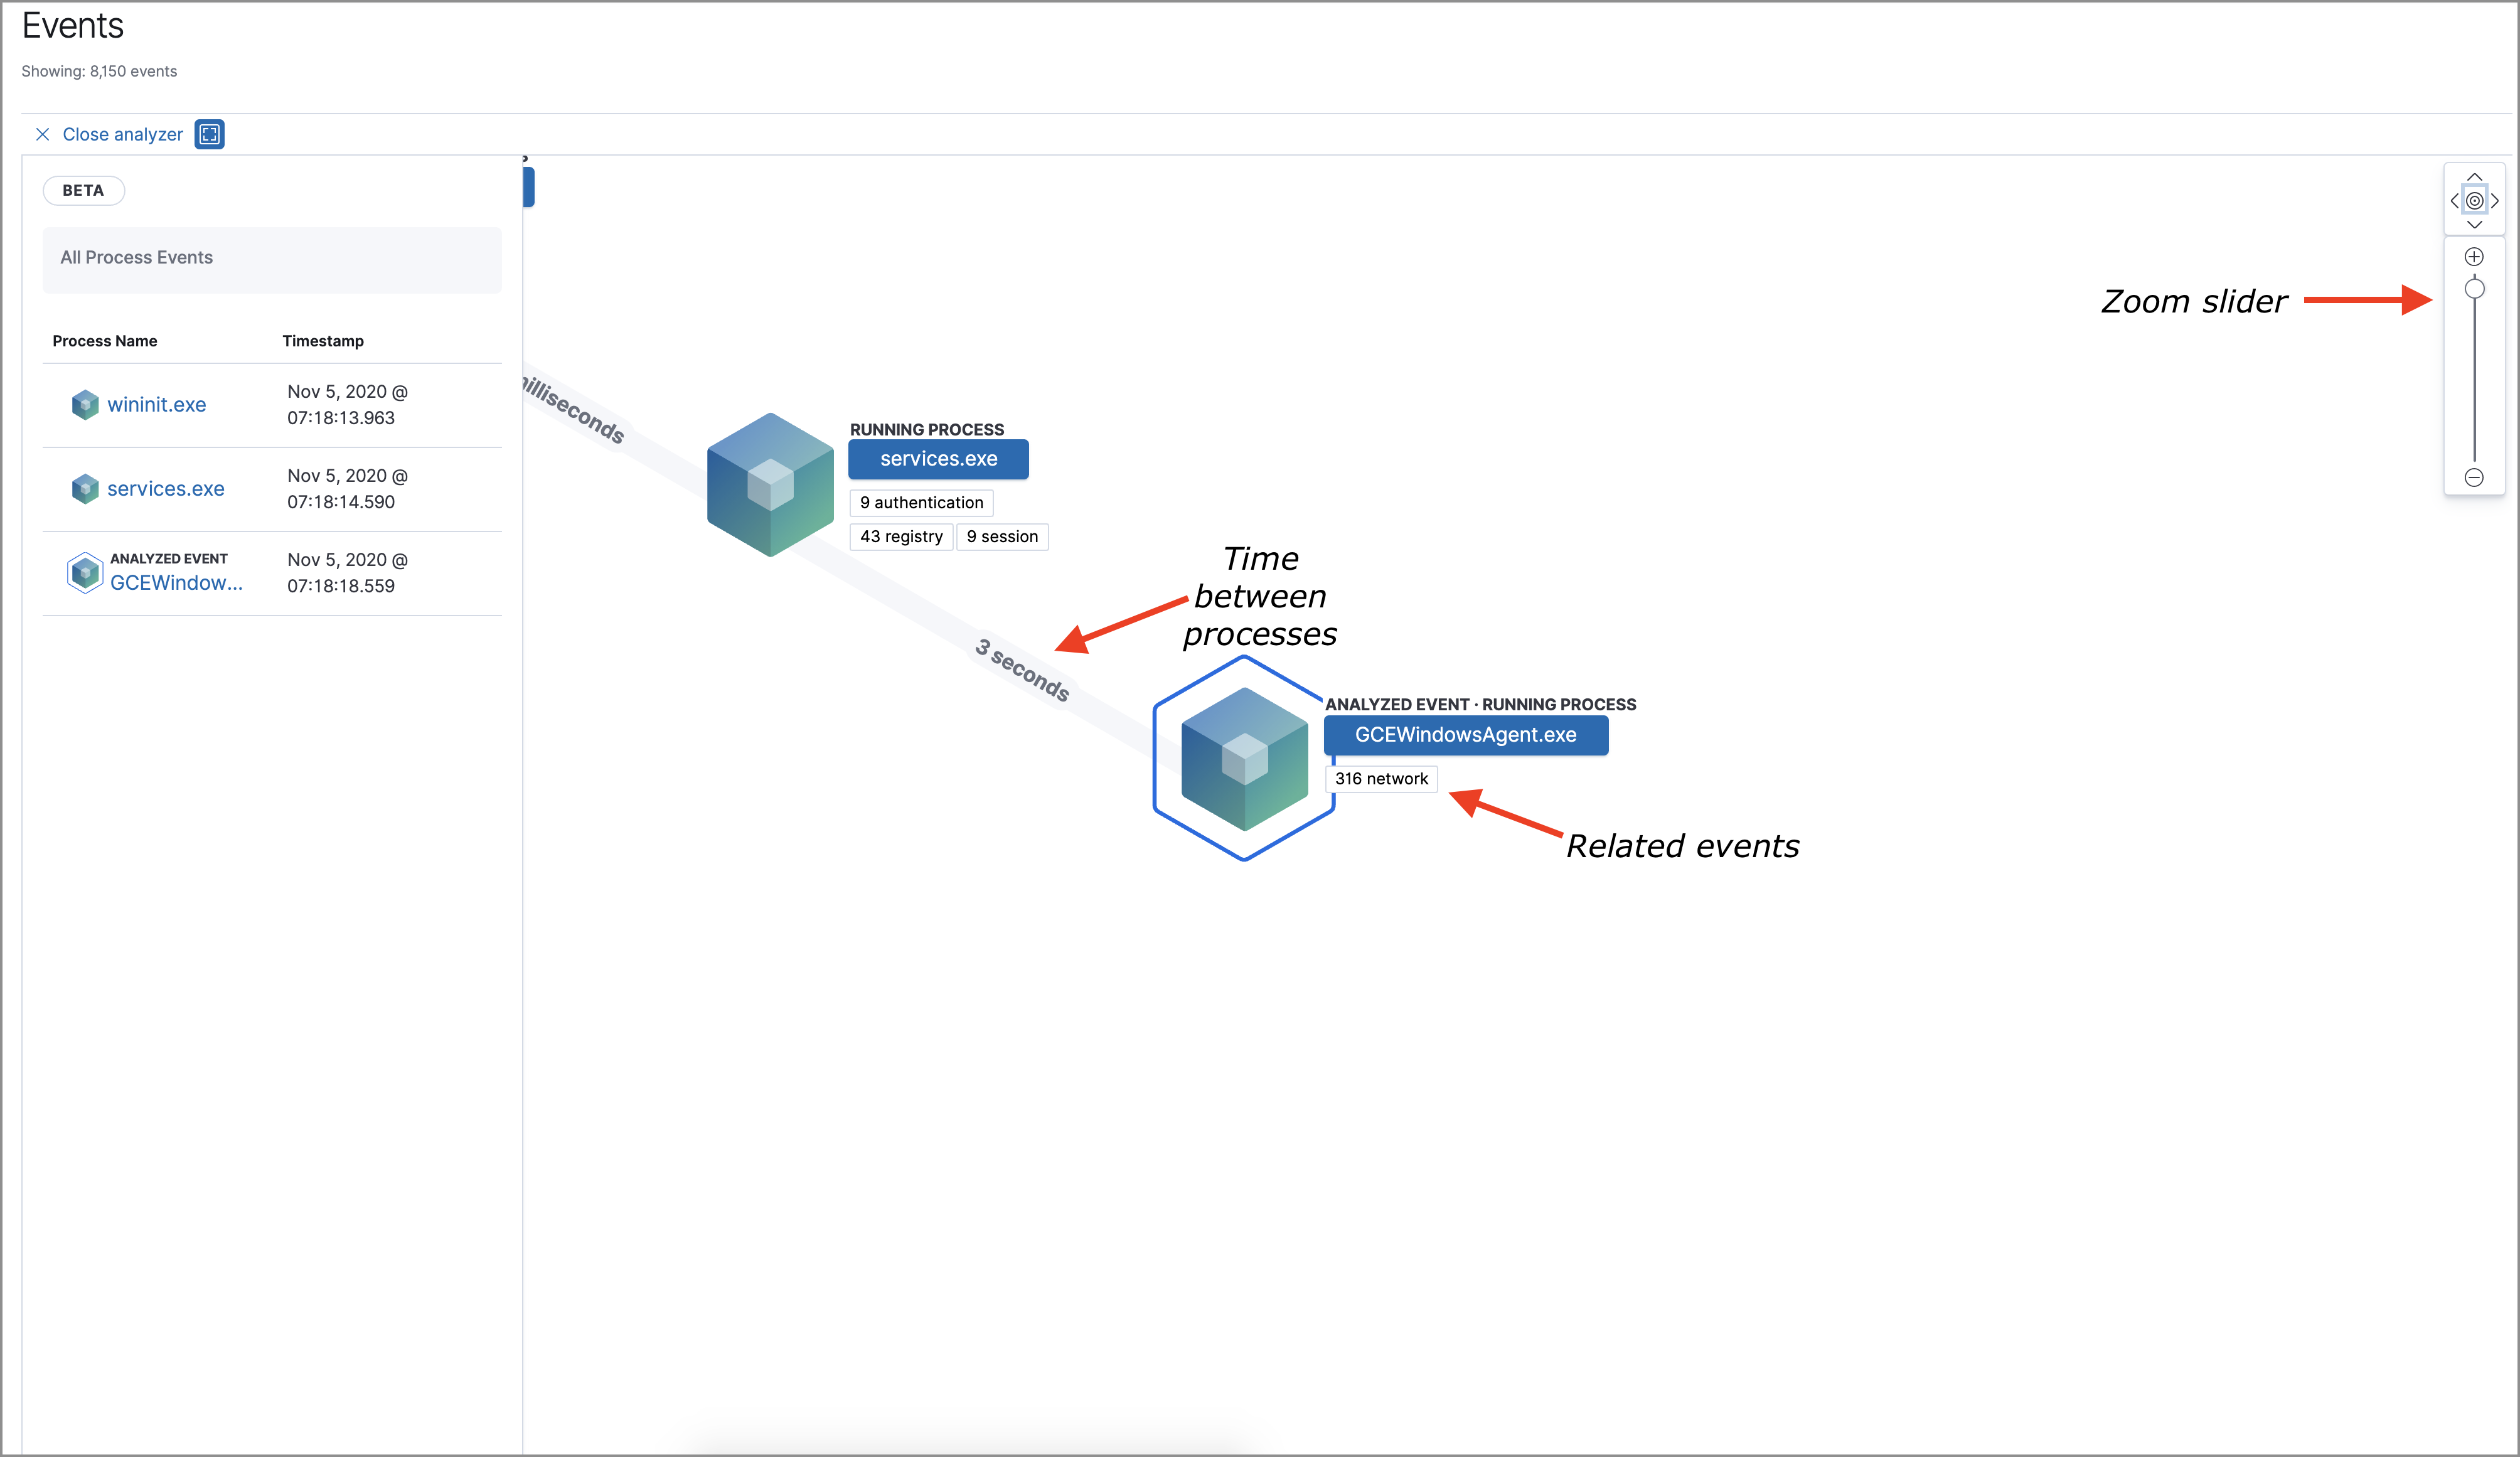
In the graphical view, you can:
- Zoom in and out of the graphical view using the slider to the right of the timeline
- Click and drag around the graphical view to more process relationships
- See the time passed between each process
- See all events related to each process
Process and event details
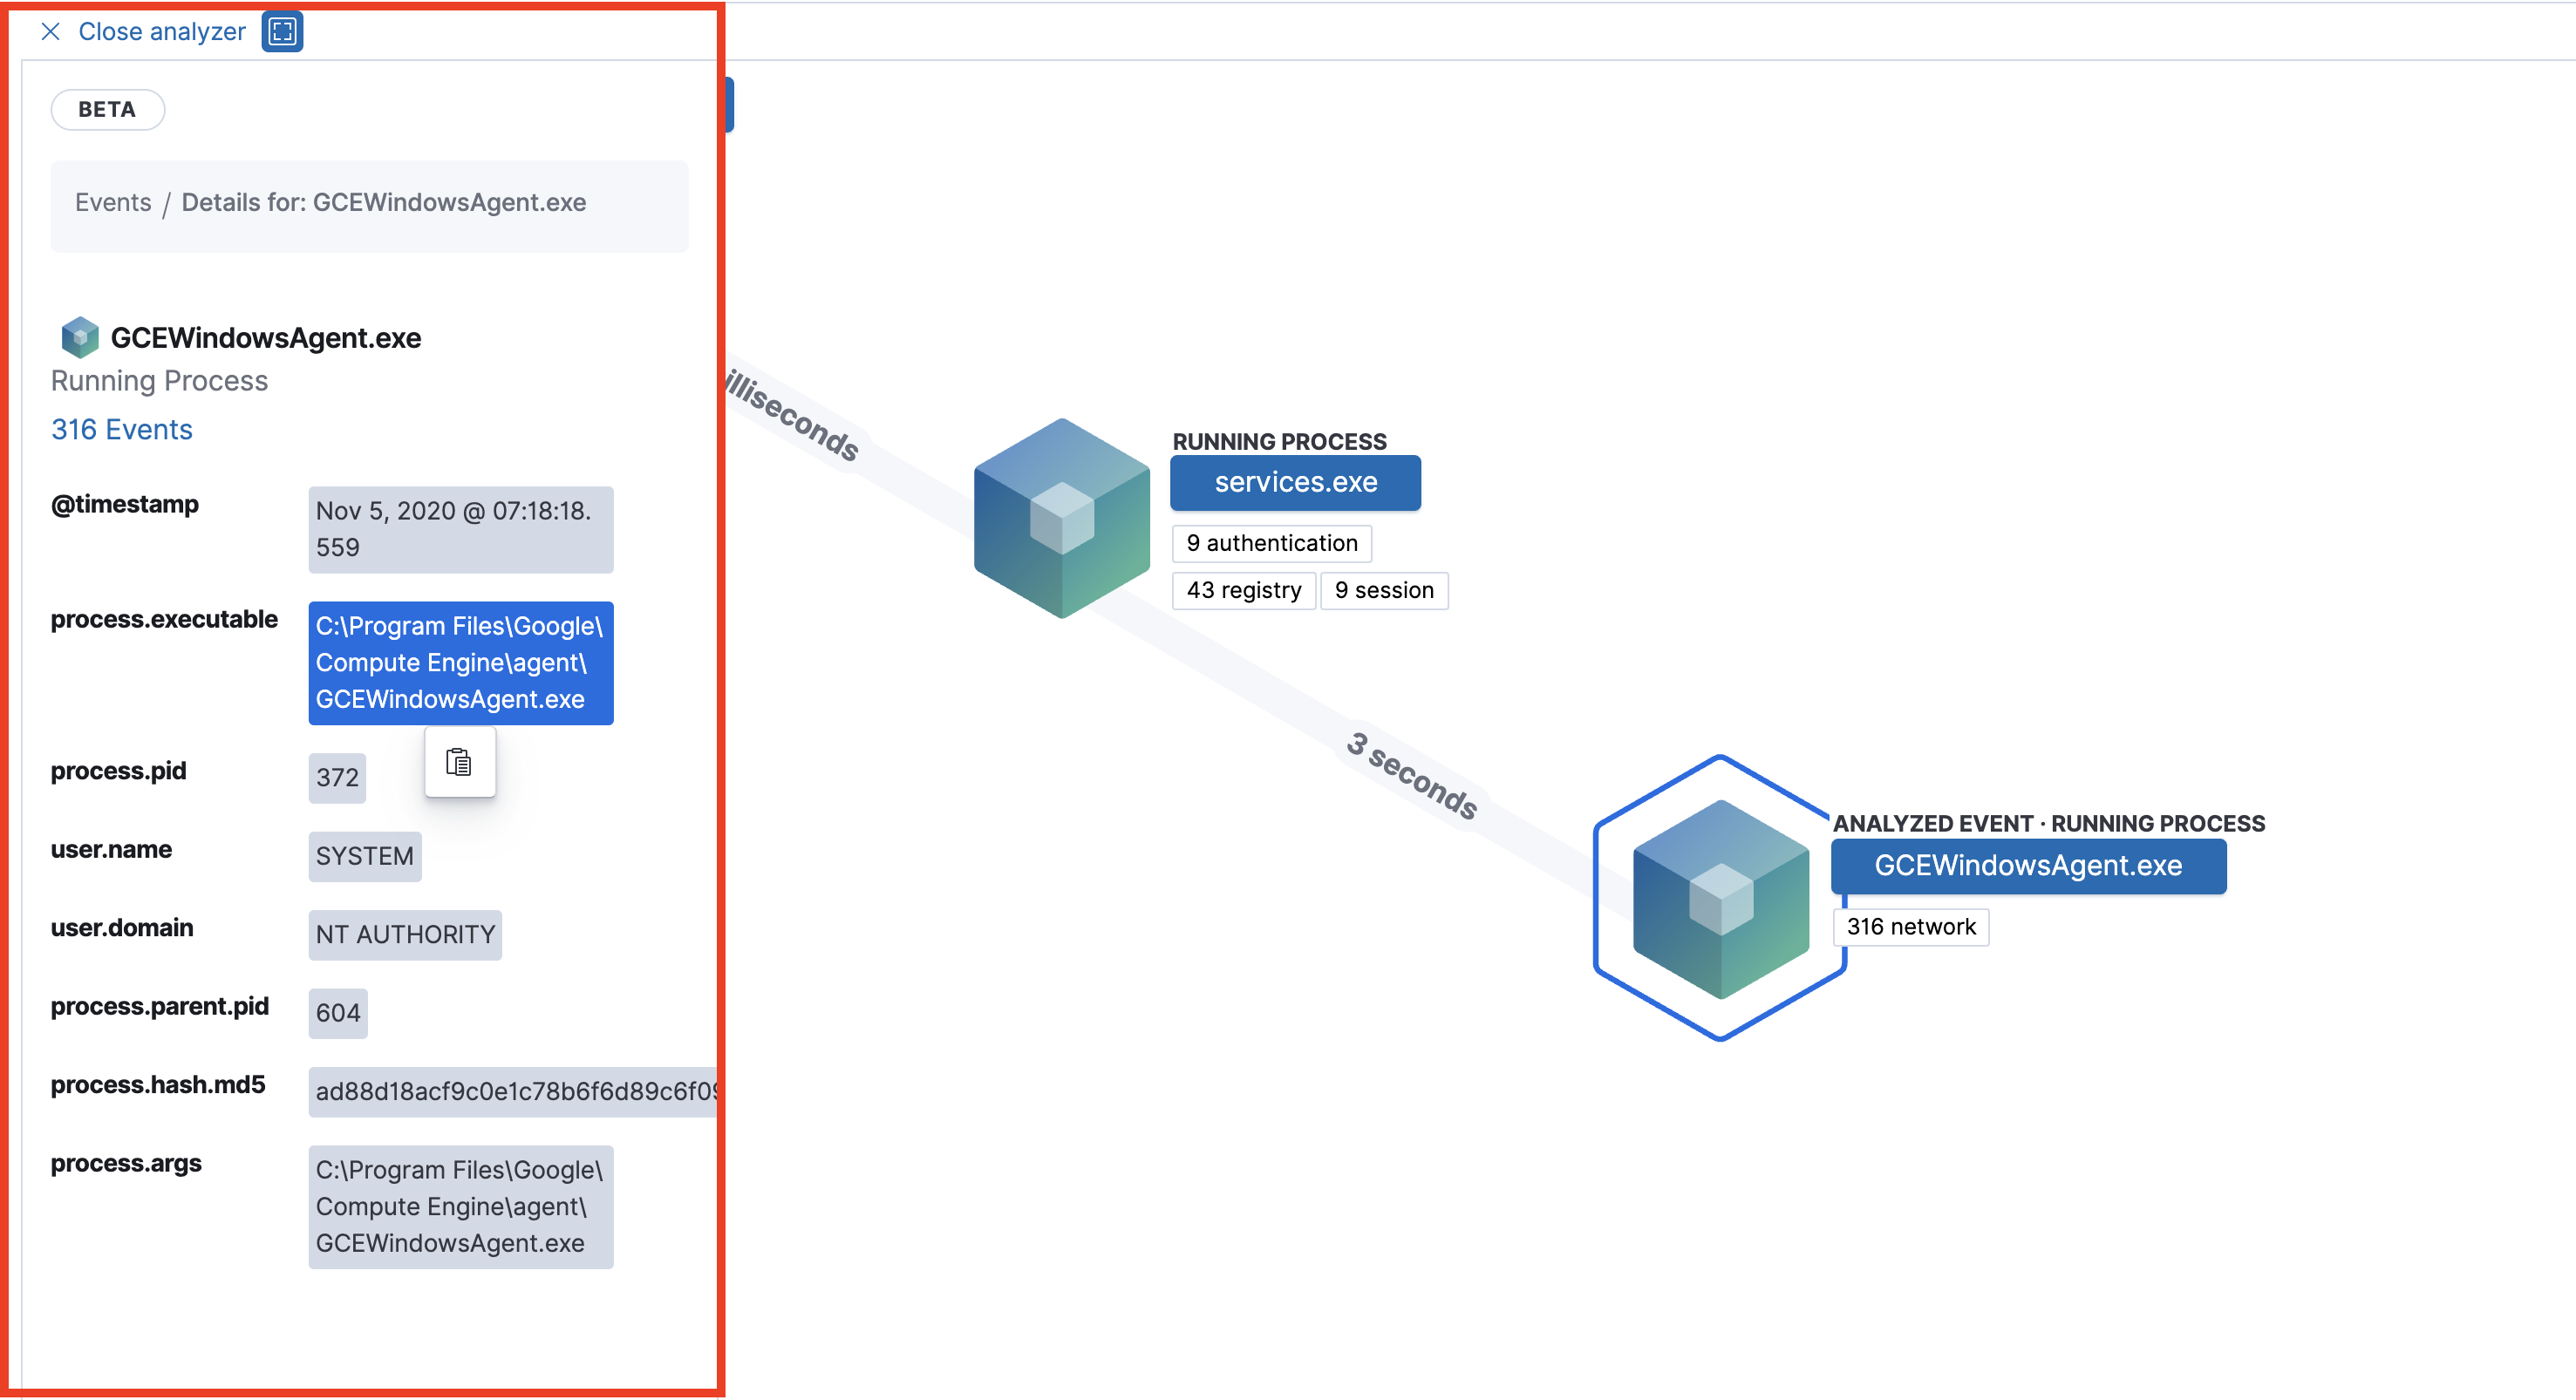
editTo see more details about each related process, select the process in the left panel or the graphical view. The left panel displays process details such as:
- The number of events associated with the process
- The timestamp of when the process was executed
- The file path of the process within the host
-
The
process-pid - The user name and domain that ran the process
- Any other relevant process information
When you first select a process, it appears in a loading state. If loading data for a given process fails, click Reload {process-name} beneath the process to reload the data.
See event details by selecting that event’s URL at the top of the process details view or choosing one of the event pills in the graphical view.
Events are categorized based on their event.category.
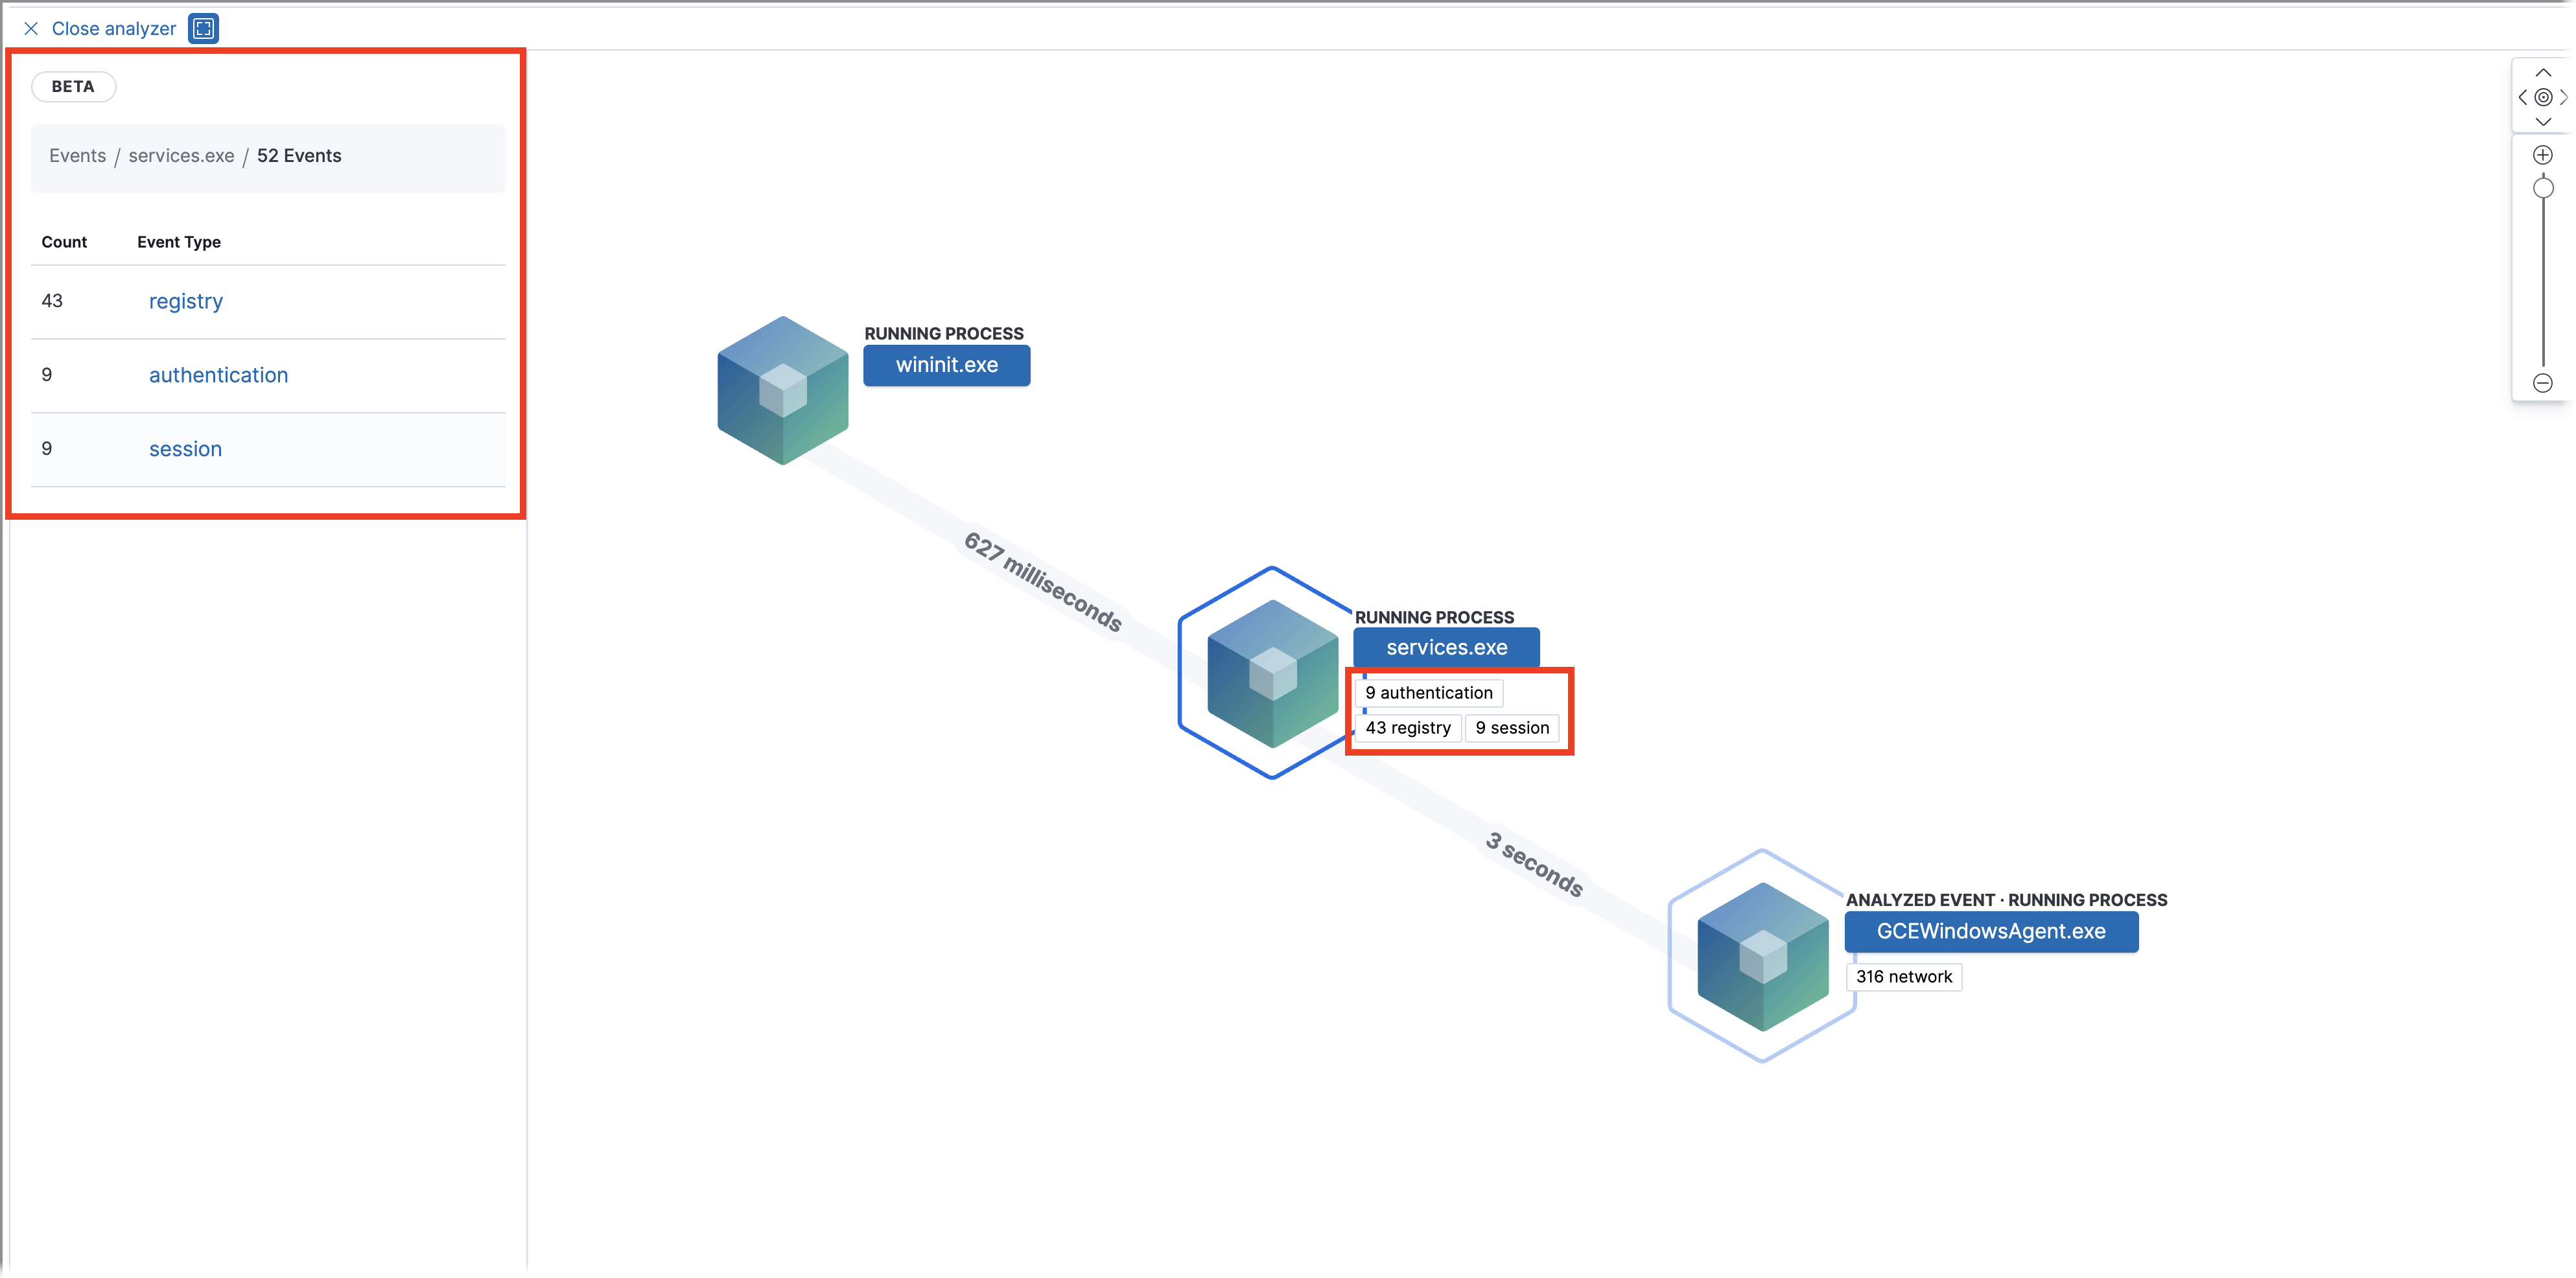
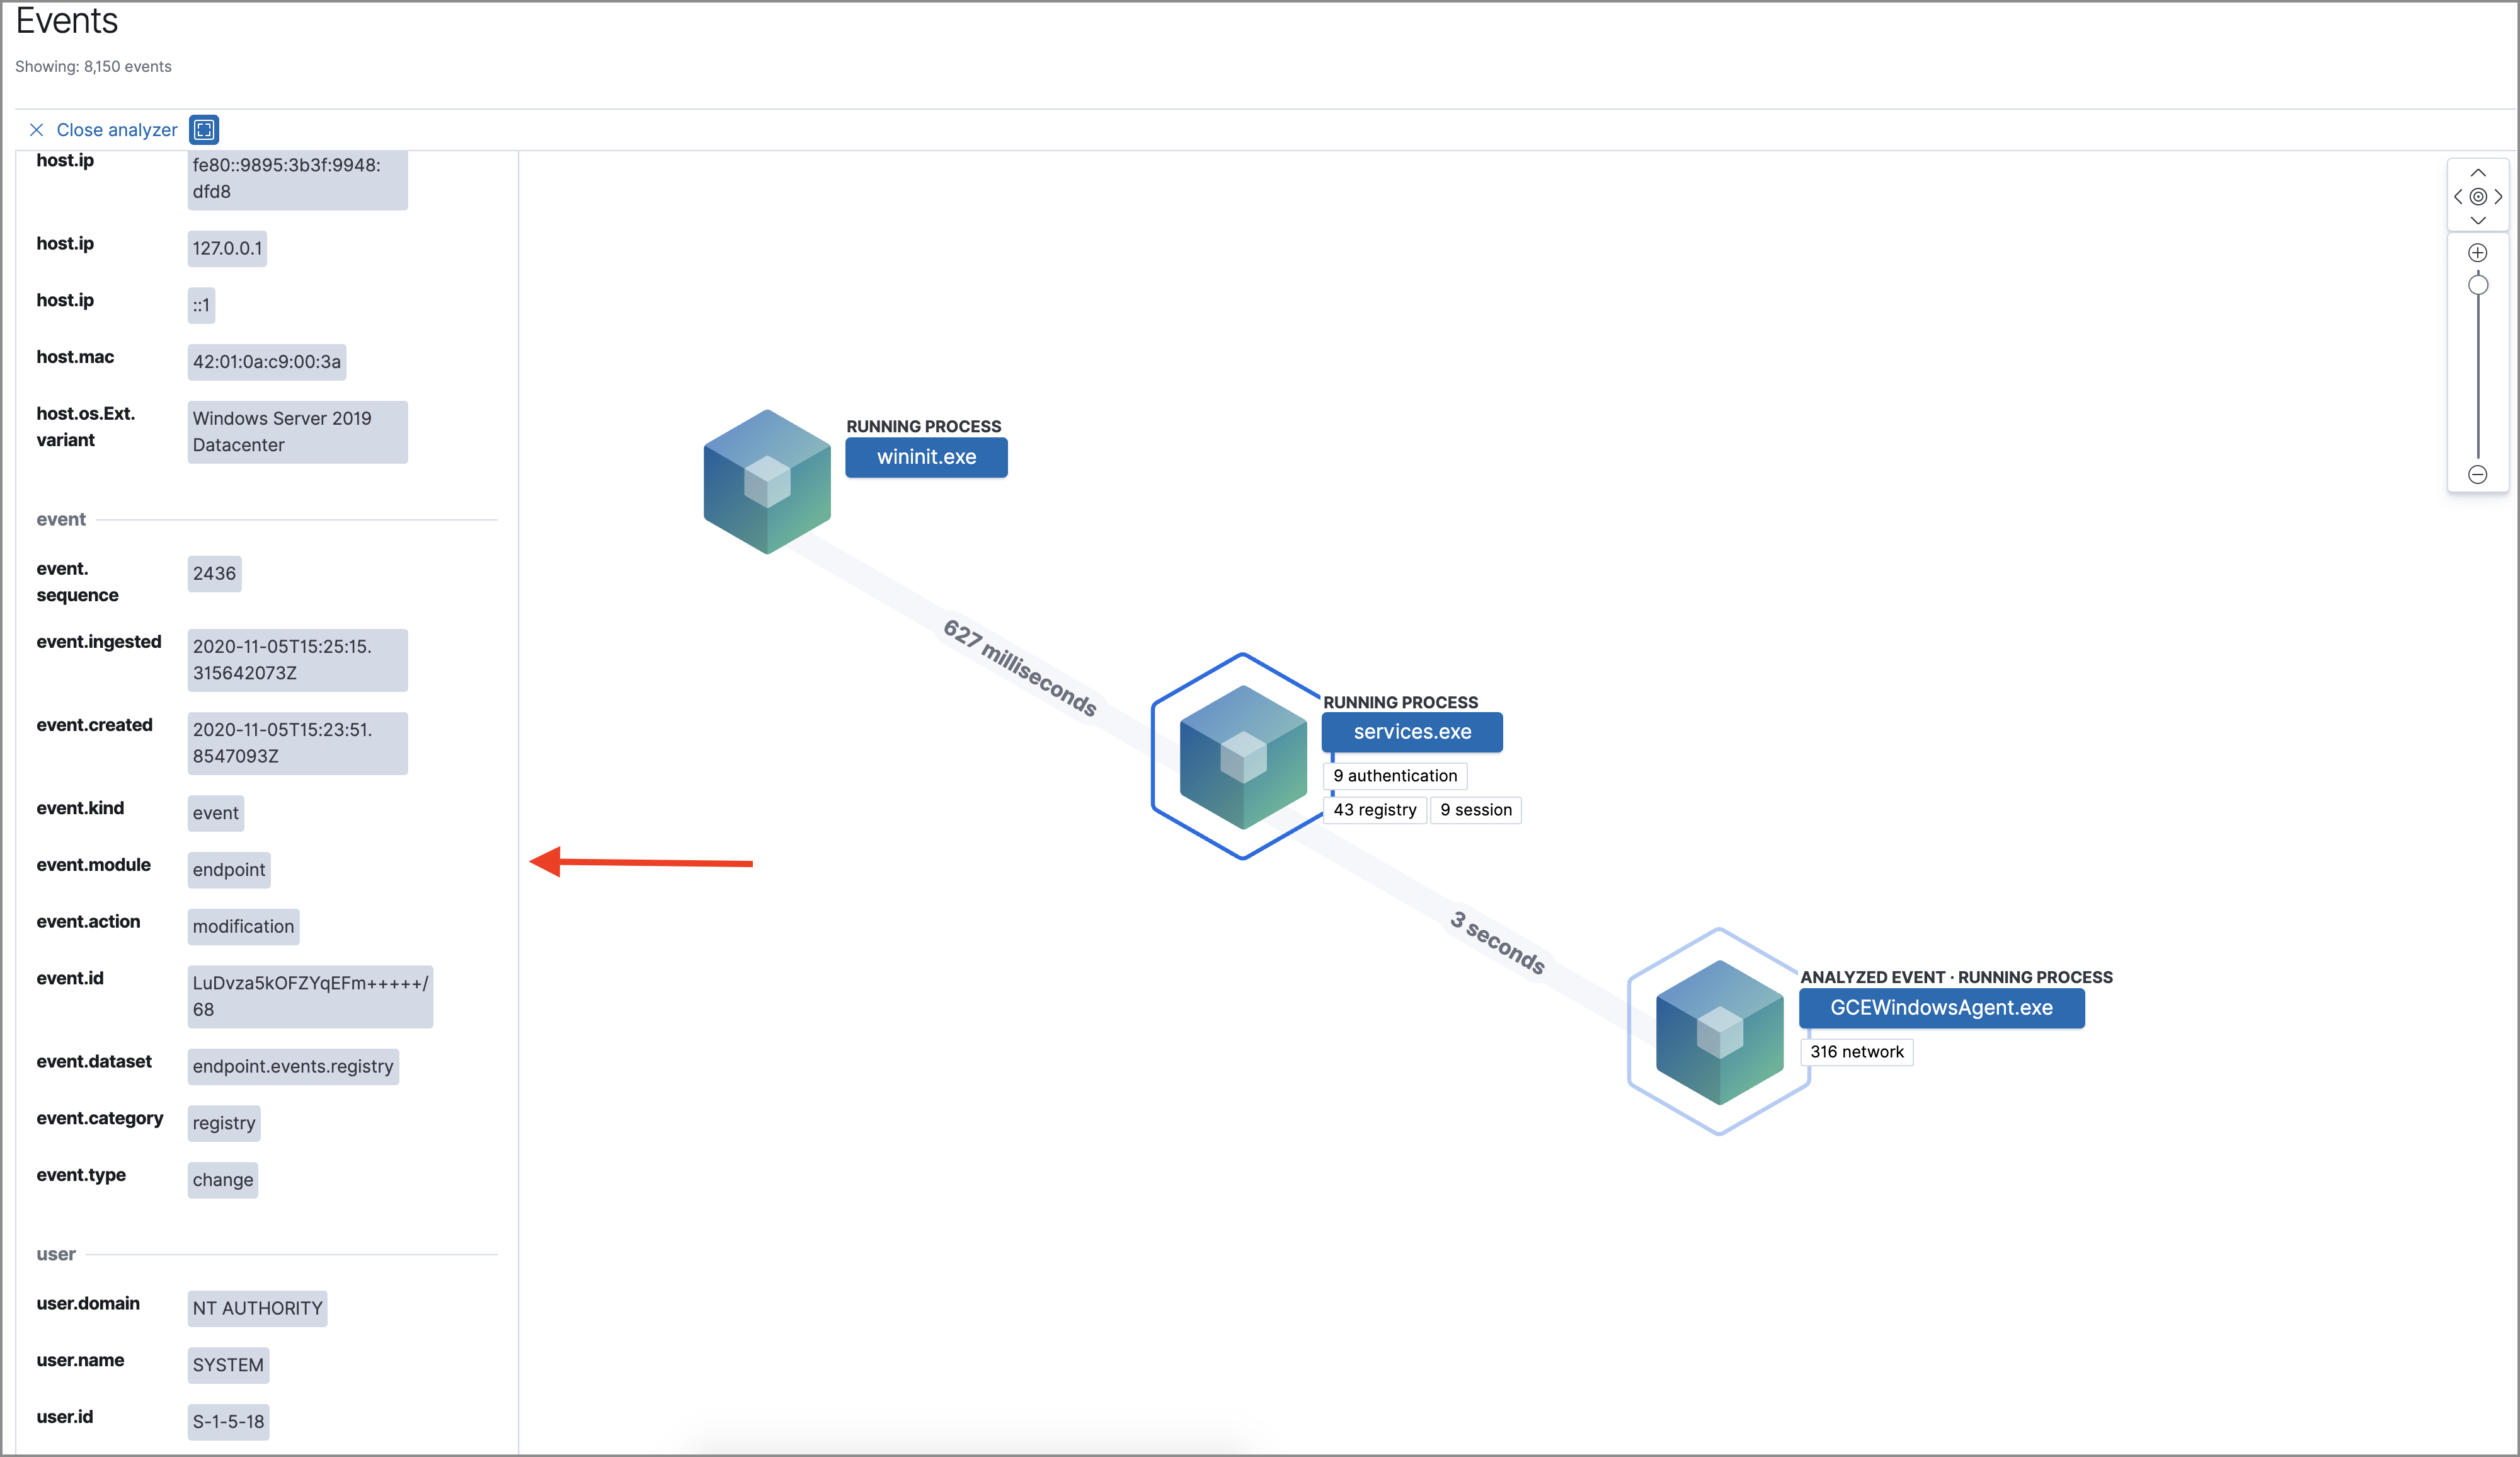
When you select an event.category, pill, all the events within that category are listed in the left panel. To view more details about a specific event, select it from the list.
In Elastic Stack version >= 7.10.0, there is no limit to the number of events that can be associated with a process. However, in Elastic Stack minor versions < = 7.9.0, each process is limited to only 100 events.