Create monitors with Project Monitors
editCreate monitors with Project Monitors
editThis functionality is in beta and is subject to change. The design and code is less mature than official GA features and is being provided as-is with no warranties. Beta features are not subject to the support SLA of official GA features.
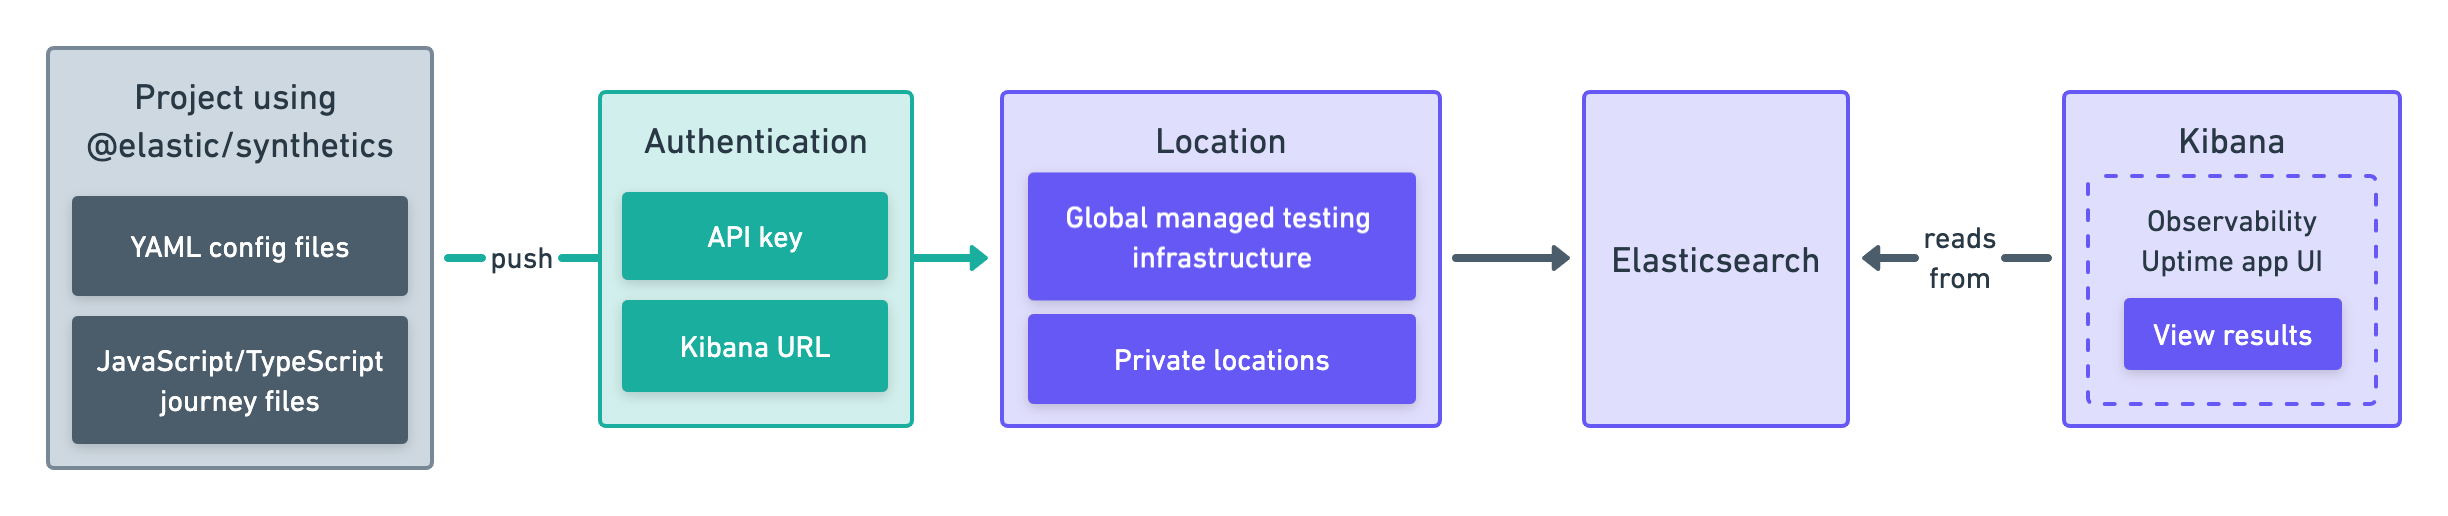
Projects are the most powerful and sophisticated way to configure synthetic monitors in the Elastic Stack. Projects let you define your infrastructure as code, more commonly known as IaaC or Git-ops. With Project Monitors you organize your YAML configuration and JavaScript- or TypeScript-defined monitors on the filesystem, use Git for version control, and deploy via a CLI tool, usually executed on a CI/CD platform.
This is one of three approaches you can use to set up a synthetic monitor.
Prerequisites
editTo try this beta functionality, first you need to enable Monitor Management in Kibana:
- Go to Observability → Uptime.
- Click Monitor Management.
- Review the terms and conditions and click Enable to start using Monitor Management.
To enable Monitor Management, you must be logged into Kibana as a user with the following privileges:
-
Cluster privileges:
monitor,read_ilm,read_pipeline, and at least one ofmanage_own_api_key,manage_security, ormanage_api_key -
Indices privileges for
synthetics-*:view_index_metadata,create_doc,auto_configure
Working with projects requires working with the Elastic Synthetics CLI tool, which
can be invoked via the npx @elastic/synthetics command. Before getting started
you’ll need to:
- Install Node.js
-
Install the package:
npm install -g @elastic/synthetics
-
Confirm your system is setup correctly:
npx @elastic/synthetics -h
You should also decide where you want to run the monitors before getting started. You can run Project Monitors on one or both of the following:
- Elastic’s global managed testing infrastructure: With Elastic’s global managed testing infrastructure, you can create and run monitors in multiple locations without having to manage your own infrastructure. Elastic takes care of software updates and capacity planning for you.
- Private locations: Private locations allow you to run monitors from your own premises. To use private locations you must create a private location before continuing. For step-by-step instructions, refer to Monitor resources on private networks.
Create a project
editStart by creating your first project. Run the command below to create a new
project named projects-test in the current directory.
npx @elastic/synthetics init projects-test
Then, follow the prompts on screen to setup the correct default variables for your project.
When complete, set the SYNTHETICS_API_KEY environment variable in your terminal, which is used
for authentication with your Elastic Stack:
-
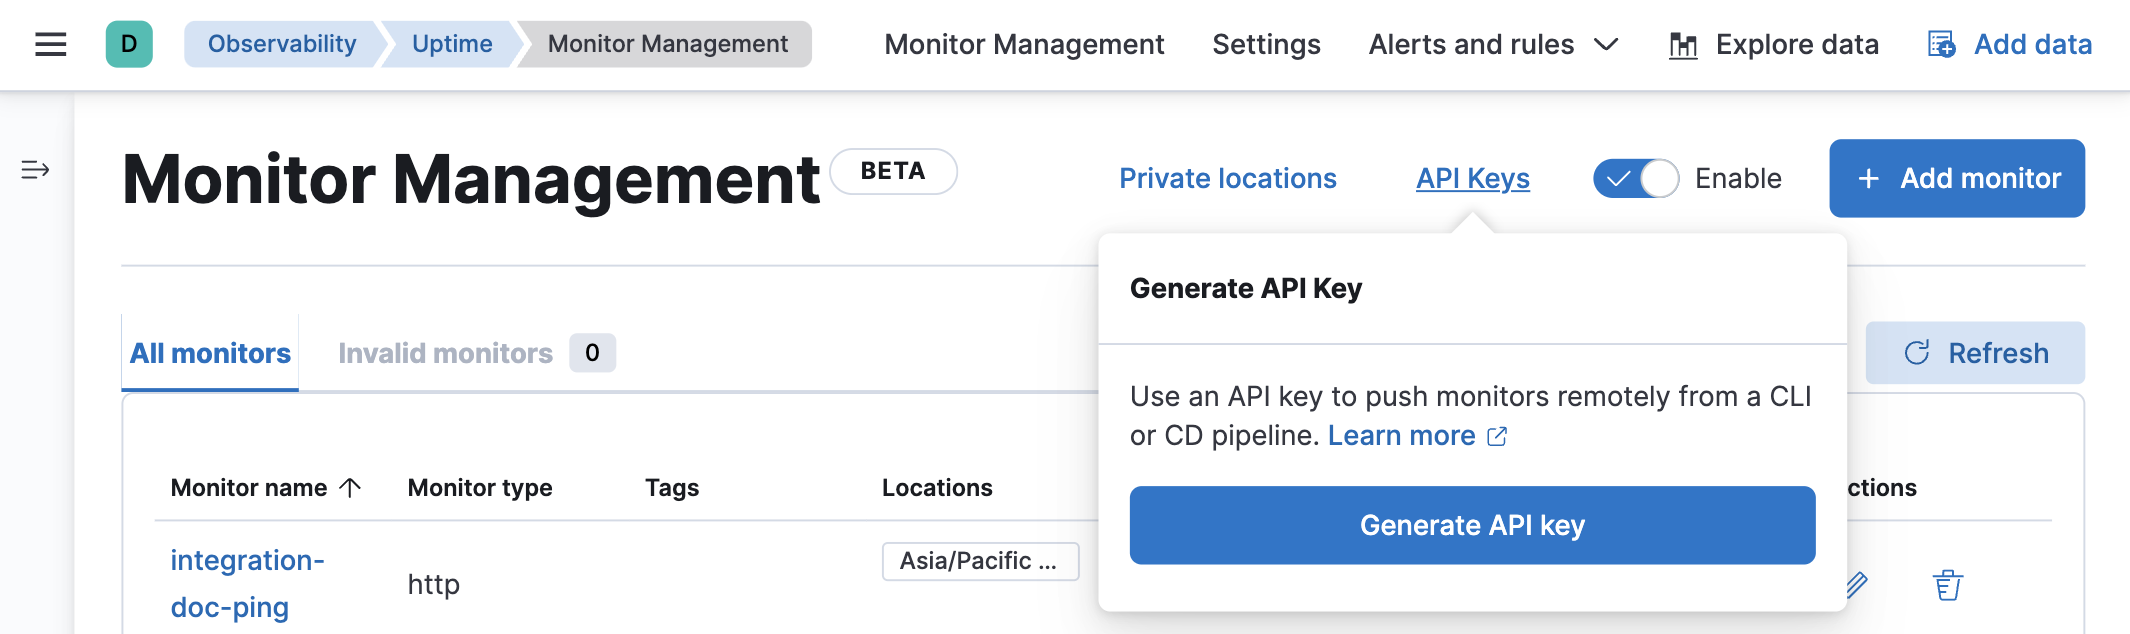
To generate an API key:
- Go to Monitor Management in the Uptime app.
- Click API Keys.
-
Click Generate API key.
-
Set the
SYNTHETICS_API_KEYenvironment variable in your terminal. You will most likely want to set this permanently. This is done differently in Powershell and Bash.
If you are pushing to a private location, you must use an API key generated in 8.4 or higher.
Then, take a look at key files and directories inside your project:
-
journeysis where you’ll add.tsand.jsfiles defining your browser monitors. When you create a new project, this directory will contain files defining sample monitors. -
lightweightis where you’ll add.yamlfiles defining your lightweight monitors. When you create a new project, this directory will contain a file defining sample monitors. -
synthetics.config.tscontains settings for your project. When you create a new project, it will contain some basic configuration options that you can customize later. -
package.jsoncontains NPM settings for your project. Learn more in the NPM documentation. -
.githubcontains sample workflow files to use with GitHub Actions.
Examine sample monitors
editInside the lightweight directory you’ll find sample lightweight monitors.
Here’s an example of a YAML file defining a lightweight monitor:
# lightweight.yml
heartbeat.monitors:
- type: http
  name: Todos Lightweight
  id: todos-lightweight
  urls: "https://elastic.github.io/synthetics-demo/"
  schedule: '@every 1m'
For more details on lightweight monitor configuration options, refer to Configure lightweight monitors.
Inside the journeys directory you’ll find sample browser monitors.
Here’s an example of a TypeScript file defining a browser monitor:
// example.journey.ts
import { journey, step, monitor, expect } from '@elastic/synthetics';
journey('My Example Journey', ({ page, params }) => {
  // Only relevant for the push command to create
  // monitors in Kibana
  monitor.use({
    id: 'example-monitor',
    schedule: 10,
  });
  step('launch application', async () => {
    await page.goto(params.url);
  });
  step('assert title', async () => {
    const header = await page.locator('h1');
    expect(await header.textContent()).toBe('todos');
  });
});
For more details on writing journeys and configuring browser monitors, refer to Scripting browser monitors.
Test and connect to the Elastic Stack
editWhile inside the project directory you can do two things with the npx @elastic/synthetics command:
-
Test browser-based monitors locally. To run all journeys defined in
.tsand.jsfiles:npx @elastic/synthetics journeys
-
Push all monitor configurations to an Elastic deployment. Run the following command from inside your project:
npx @elastic/synthetics push --auth $SYNTHETICS_API_KEY --url <kibana-url>
One monitor will appear on the Monitor management page for each journey or
lightweight monitor, and you’ll manage all monitors from your local environment.
For more details on using the push command, refer to elastic-synthetics push.
If you’ve added a private location,
you can push to that private location.
To list available private locations,
run the elastic-synthetics locations command
with the Kibana URL for the deployment from which to fetch available locations.
View in Kibana
editThen, go to the Uptime app in Kibana. You should see your newly pushed monitors running. You can also go to the Monitor Management page to see the monitors' configuration settings.
Next steps
editLearn more about: