Ingest data from Splunk (Experimental)
editIngest data from Splunk (Experimental)
editIf you haven’t already, you need to install Elasticsearch for storing and searching your data, and Kibana for visualizing and managing it. For more information, see Spin up the Elastic Stack. After Elasticsearch and Kibana are installed, Fleet must be enabled; see the Ingest logs, metrics, and uptime data.
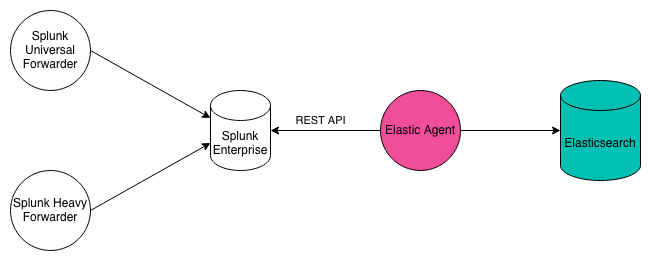
Apache, AWS CloudTrail, Nginx, and Zeek integrations offer the ability to seamlessly ingest data from a Splunk Enterprise instance. Data will be automatically mapped to the Elastic Common Schema, making it available for rapid analysis in Elastic solutions, including Security and Observability.
These integrations work by using the httpjson input in Elastic Agent to
run a Splunk search via the Splunk REST API and then extract the raw
event from the results. The raw event is then processed via the
Elastic Agent. The Splunk search is customizable and the interval between
searches is customizable. These integrations only get new data since
the last query, not historical data.
To ingest Nginx data from Splunk, perform the following steps. The options are the same for Apache, AWS CloudTrail, and Zeek.
Step 1: Add integration
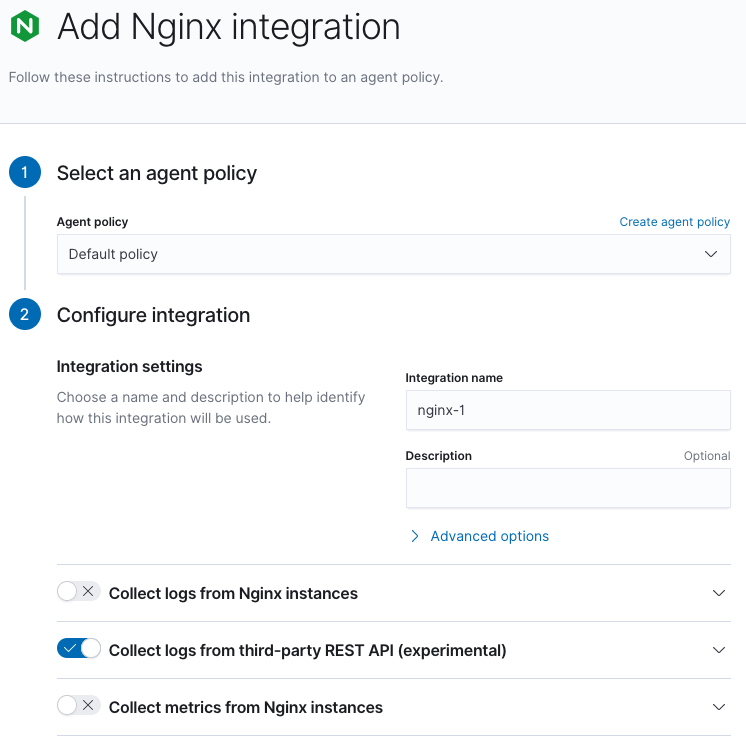
editFind the Nginx integration and begin adding it as described in Ingest logs, metrics, and uptime data.
Step 2: Enable Collect logs from third-party REST API
editEnable "Collect logs from third-party REST API" and disable both "Collect logs from Nginx instances" and "Collect metrics from Nginx instances".
Step 3: Enter connection information
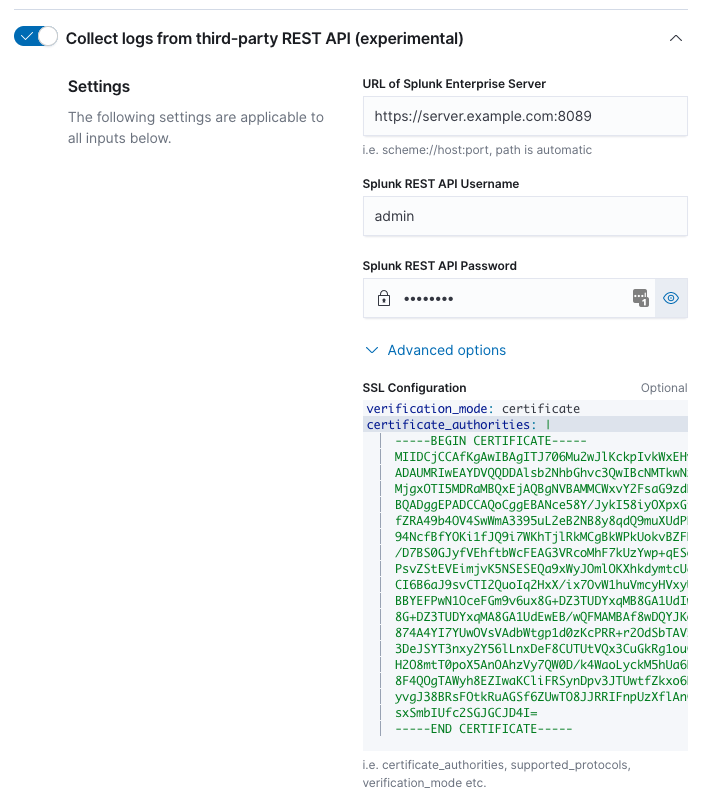
editEnter the required information to connect to the Splunk Enterprise REST API.
The URL of the Splunk Enterprise Server must include the scheme (http or https),
the IP address or hostname of the Splunk Enterprise Server, and the port the
REST API is listening on.
The Splunk username and password must be of a user with a role or capability to use REST API endpoints. Administrative users have these permissions by default.
SSL Configuration is available under the "Advanced options". These may be necessary if Splunk Enterprise server uses self-signed certificates. See SSL Options for valid configuration options.
Step 4: Enter information to select data from Splunk
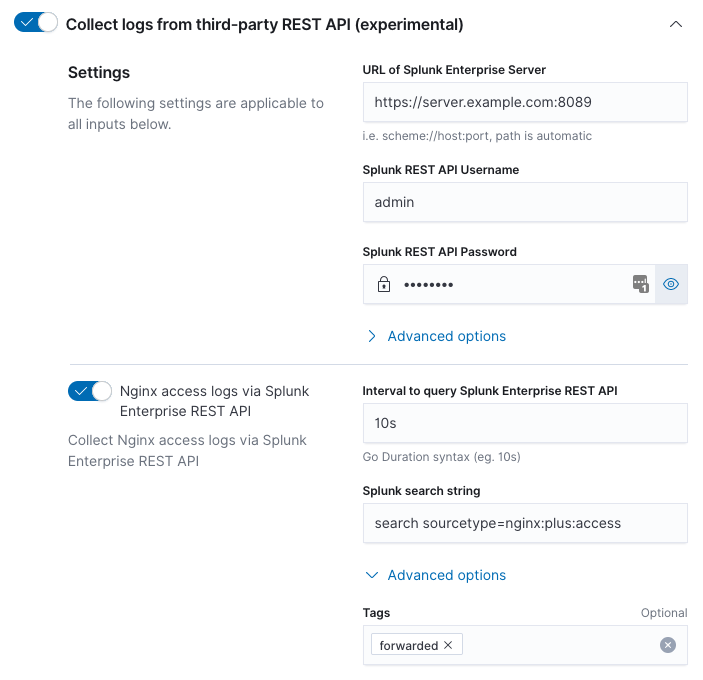
editFor each type of log file, enter the interval and Splunk search string.
The interval is expressed as a Go duration. The interval is the time between requests sent to the Splunk Enterprise REST API to request new information. Intervals less than one second are not recommended; Splunk only maintains second accuracy for index time. The interval should closely match the rate at which data arrives at the Splunk Enterprise Server. For example, an interval of "5s" for data that only arrives at the Splunk Enterprise Server every hour will generate unnecessary load on the Splunk Enterprise Server.
The search string is the Splunk search used to uniquely describe the
events that match the type of log file you are trying to configure.
For example, to uniquely describe Nginx access logs search
sourcetype=nginx:plus:access might be used. Note, the search string
must begin with "search" for details refer to the Splunk REST API
manual and the "search/jobs/export" endpoint.
Be aware that each time the Elastic Agent connects to the Splunk Enterprise REST API a Splunk search is performed. Because of this you want to be sure your search string is as specific as possible, since this reduces the load on the Splunk Enterprise Server.
Tags may be added in the "Advanced options". For example, if you’d like to tag events coming from Splunk with a Splunk tag, you can add it here. By default, the forward tag is present to indicate that events are being forwarded via an intermediary, i.e. Splunk.
Step 5: Save Integration
editClick Save Integration
Data and Dashboards will be available just as if you had collected the data on the Nginx host using log files.
Considerations and questions
editThe time on the host running the agent and the Splunk Enterprise Server should be synchronized to the same time source, with correct timezone information. Failure to do this could result in delays in transferring data or gaps in the data received.
Does the Splunk data need to be in a specific format or mapped to Splunk’s Common Information Model? No, because these integrations take the raw event from Splunk and process that. There is no dependency on any Splunk processing.
Are events mapped to Elastic Common Schema (ECS)? Yes, events from these integrations go through the exact same processing as if Elastic Agent had gotten the event from the original source. So the same level of mapping to ECS occurs.