IMPORTANT: No additional bug fixes or documentation updates
will be released for this version. For the latest information, see the
current release documentation.
Infrastructure monitoring
edit
IMPORTANT: This documentation is no longer updated. Refer to Elastic's version policy and the latest documentation.
Infrastructure monitoring
editIf you haven’t already, you need to install and configure Metricbeat to populate the Infrastructure app with data. For more information, see Ingest metrics.
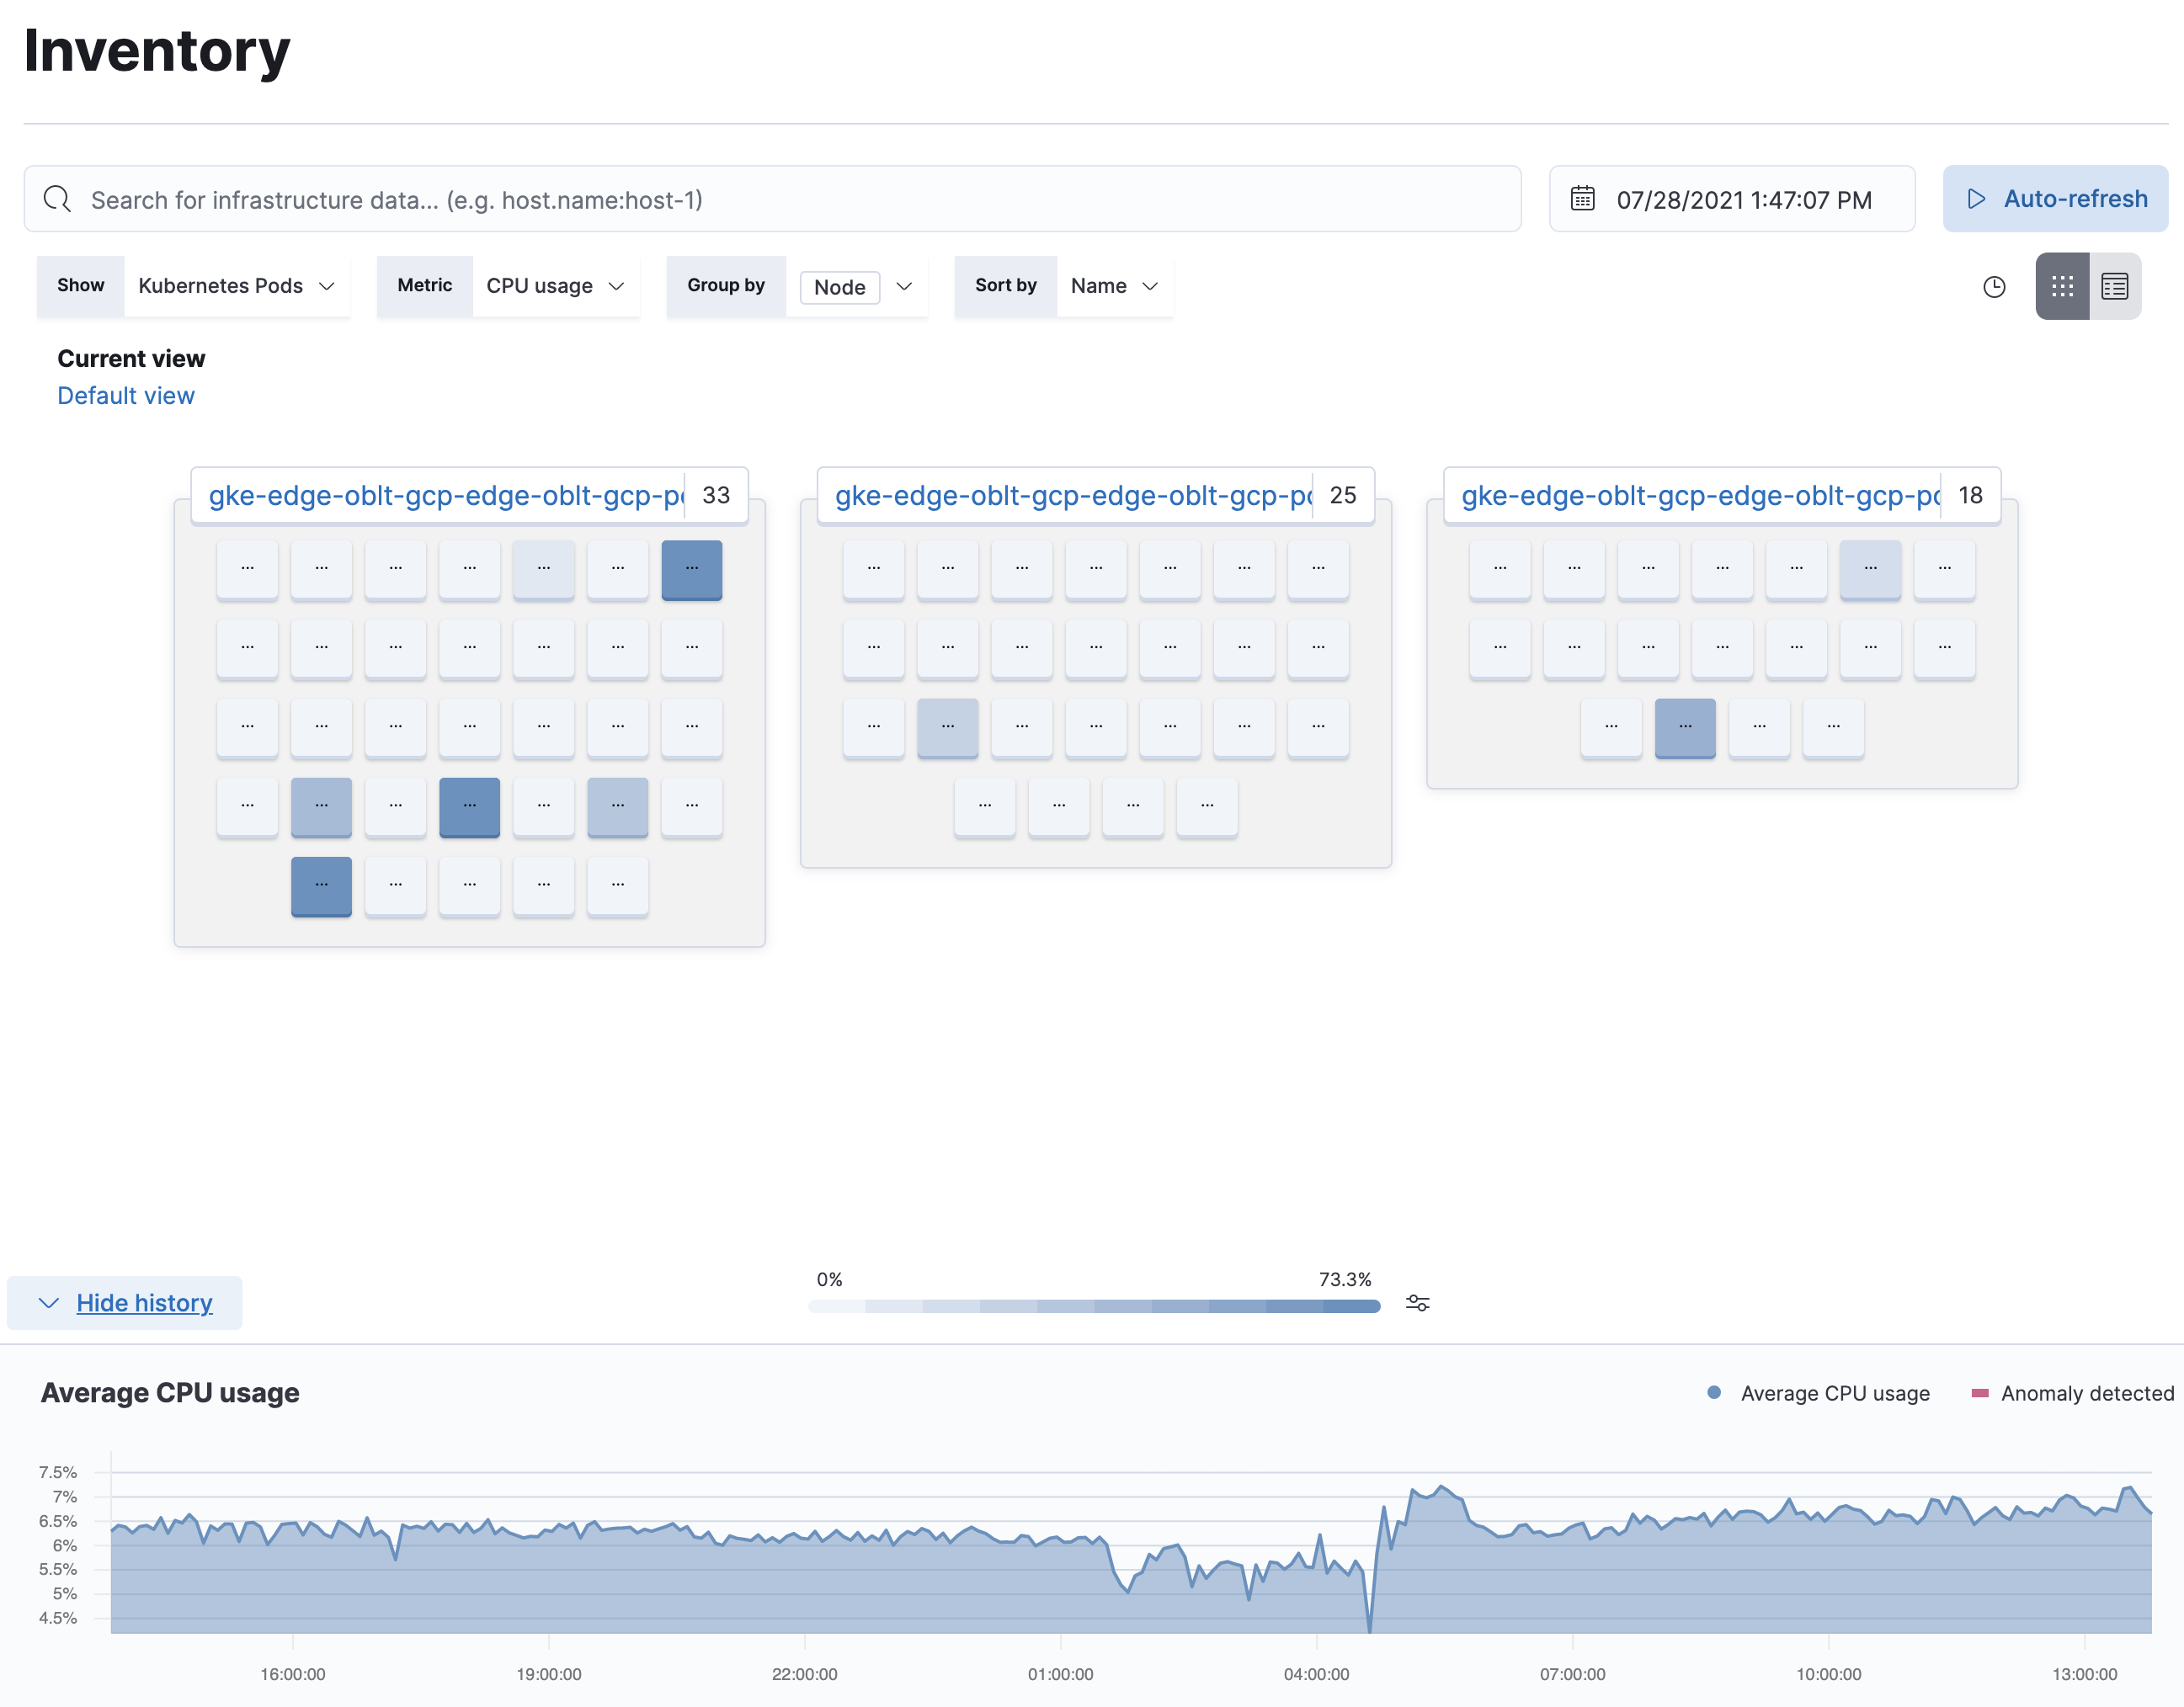
The Infrastructure app in Kibana enables you to visualize infrastructure metrics to help diagnose problematic spikes, identify high resource utilization, automatically discover and track pods, and unify your metrics with logs and APM data in Elasticsearch.
Using Elastic Agent integrations, you can ingest and analyze metrics from servers, Docker containers, Kubernetes orchestrations, explore and analyze application telemetries, and many more.